Results for
Hi, I'm trying to analyze a .vtk data set from MRI. I already calculate the kinetic energy. Now I'm trying to calculate the viscous energy loss but the result that I found does not respect the reality so I think that I'm doing something wrong.
Can someone help me with this?
%% FUNCTION
function energy_loss = calculateViscousEnergyLossForAllPhases(MRI_Velocity, dynamic_viscosity,interval)
% Preallocate the energy_dissipation array
energy_loss = zeros(1, 30);
for idx_phase = 1:30
% Velocity field
vel_x = MRI_Velocity{1, idx_phase}.velocity(:,1) * 1e-2; % Velocity in X from cm/s to m/s
vel_y = MRI_Velocity{1, idx_phase}.velocity(:,2) * 1e-2; % Velocity in Y in m/s
vel_z = MRI_Velocity{1, idx_phase}.velocity(:,3) * 1e-2; % Velocity in Z in m/s
% Coordinates
x = MRI_Velocity{1, idx_phase}.points(:,1) * 1e-3; % from mm to m
y = MRI_Velocity{1, idx_phase}.points(:,2) * 1e-3;
z = MRI_Velocity{1, idx_phase}.points(:,3) * 1e-3;
% Compute partial derivatives
dUdx = gradient(vel_x, x, 1);
dUdy = gradient(vel_x, y, 2);
dUdz = gradient(vel_x, z, 3);
dVdx = gradient(vel_y, x, 1);
dVdy = gradient(vel_y, y, 2);
dVdz = gradient(vel_y, z, 3);
dWdx = gradient(vel_z, x, 1);
dWdy = gradient(vel_z, y, 2);
dWdz = gradient(vel_z, z, 3);
% Calculate energy dissipation
ED = 2 * (dUdx.^2 + dUdy.^2 + dUdz.^2) + ...
2 * (dVdx.^2 + dVdy.^2 + dVdz.^2) + ...
2 * (dWdx.^2 + dWdy.^2 + dWdz.^2) + ...
(dUdz + dWdx).^2 + (dVdx + dUdy).^2 + (dWdy + dVdz).^2;
% Scale by dynamic viscosity of fluid and store
energy_loss(idx_phase) = sum(ED, 'all', 'omitnan') * dynamic_viscosity * interval.^3;
end
end
%% CODE
dynamic_viscosity_blood = 0.0039;
% human dynamic_viscosity_blood from 0.003 to 0.004; % Approximate value for blood at body temperature
% Call the function to calculate viscous energy loss for blood flow for all phases
energy_loss_RV_J = calculateViscousEnergyLossForAllPhases(MRI_Velocity_RV, dynamic_viscosity_blood,interval/1000);
energy_loss_LV_J = calculateViscousEnergyLossForAllPhases(MRI_Velocity_LV, dynamic_viscosity_blood,interval/1000);
% From Joule to milliwatt (mW)
energy_loss_RV_mW = energy_loss_RV_J.*1e3;
energy_loss_LV_mW = energy_loss_LV_J.*1e3;
figure
plot(time, energy_loss_RV_mW, 'r','LineWidth',1.5);
hold on
plot(time, energy_loss_LV_mW,'b','LineWidth',1.5);
title('Viscous energy loss over Cycle','FontSize',14);
xlabel('Cycle','FontSize',12);
ylabel('Viscous energy loss [mW]','FontSize',12);
legend('RV','LV')
Hi Guys
Posting this based on a thought I had, so I don't really ahve any code however I would like to know if the thought process is correct and/or relatively accurate.
Consider a simple spring mass system which only allows compression on the spring however when there is tension the mass should move without the effect of the spring distrupting it, thus the mass is just thrown vertically upwards.
The idea which I came up with for such a system is to have two sets of dfferential equations, one which represents the spring system and another which presents a mass in motion without the effects of the spring.
Please refer to the below basic outline of the code which I am proposing. I believe that this may produce relatively decent results. The code essentially checks if there is tension in the system if there is it then takes the last values from the spring mass differential equation and uses it as initial conditions for the differential equation with the mass moving wothout the effects of the spring, this process works in reverse also. The error which would exist is that the initial conditions applied to the system would include effects of the spring. Would there be a better way to code such behaviour?
function xp = statespace(t,x,f,c,k,m)
if (k*x(1)) positive #implying tension
**Use last time step as initial conditions**
**differential equation of a mass moving""
end
if x(1) negative #implying that the mass in now moving down therefore compression in spring
**Use last time step as initial conditions**
**differential equation for a spring mass system**
end
end
Hi Friends,
I'm looking for a matlab program which calculat deflection of simply supported tapered beam under uniform travers load.
Thank you for your help.
Hello, how can i write a combination of matrcies as follows L=[ai_j] of order 4,M of order 4, then S=[4*ai_j+M] of order 4. i mean each element in S is a matrex of order 4
The Flipbook contest is currently in full swing! It's been truly inspiring to see the incredible artwork you've all created using MATLAB! Checkout the gallery page if you haven't already.
We have some exciting news for our contestants today! In order to allow for more complex and unique creations, we've increased the MATLAB Evaluation timeout limit from 55 to 235 seconds!! So, don't hold back! Feel free to throw in those extra intricate lines of code without worrying about timeouts.
To all those already participating, we commend your efforts and encourage you to keep pushing your boundaries. And remember, there's always room for more. So, why not invite your friends and fellow MATLAB enthusiasts to join in the fun?
We also encourage everyone to engage in the contest discussions channel. Share your experiences, insights, and feedback about this contest. Your contributions enrich our community and help us improve future contests.
Looking forward to seeing more and more entries in coming weeks!
Hello,
I have an equation model following a law of type power: s=aN^b
For the measure equation, I have also a power law: m=cN^d
So I would like to have an extended Kalman Filter code in Matlab for this case. CAN YOU HELP ME PLEASE ?
hi there, my name is ayush. Im a bachelor student from india. I was doing a semester project in topology optimization. can you tell me how you run the file (https://www.topopt.mek.dtu.dk/apps-and-software/new-99-line-topology-optimization-code-written-in-matlab)in matlab. In one of your answers you provided the source, from there i got the matlab file. i was thinking of doing a project on it, but i cant run the file. its showing error.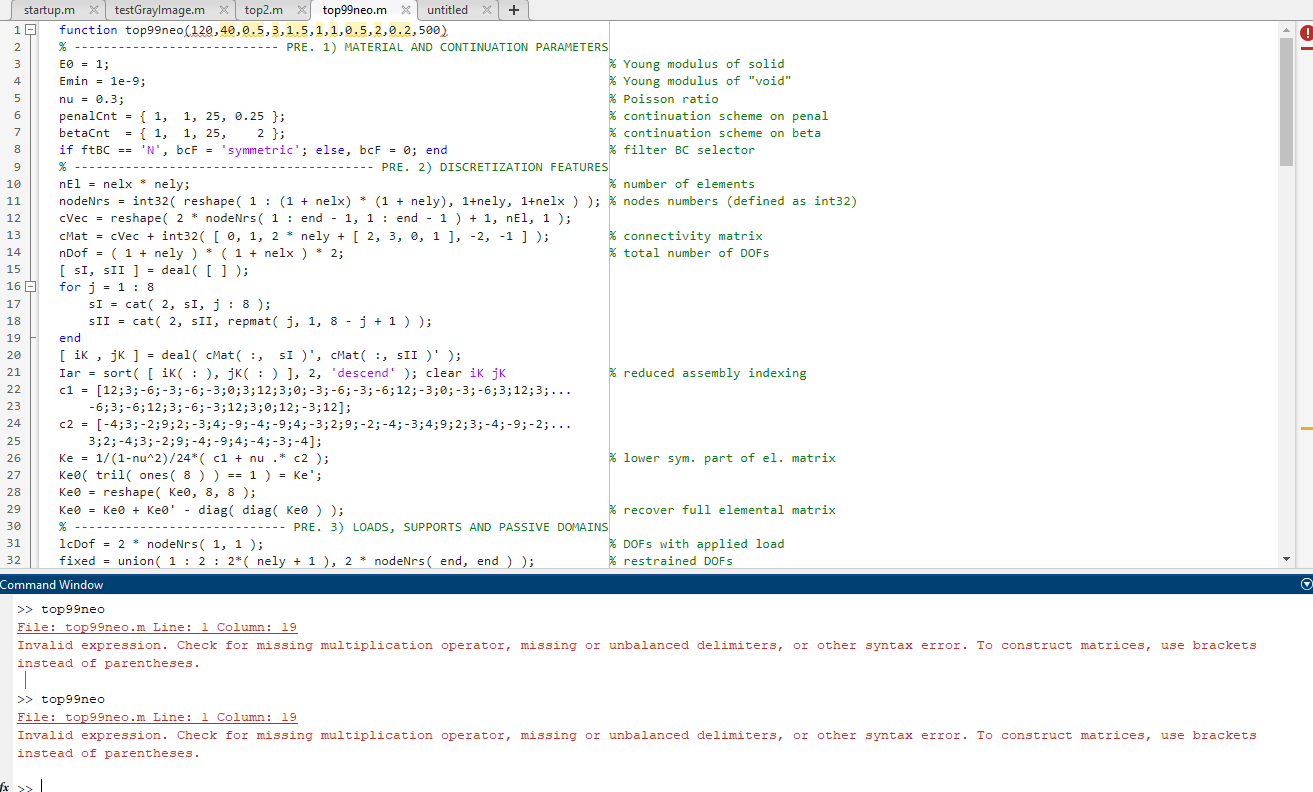
i provided the value of ftBC = 1. I have no priorknowledge of matlab. i want to learn it though.
We reached the 100 animations milestone in less than 3 days! We are thrilled to see so many creative entries and talented members learning from each other.
Note that this contest is not just for experts. People with all skill levels can participate, improve their MATLAB skills, and have fun!
We have created new resources and tips for you to get started.
- Contest introductory video. The 3-minute video provides you with a quick introduction to how the contest works and how to create a simple animation.
- Animations blog post. The post demonstrates some coding techniques that can make your animations easier.
- AI Chat Playground. This is a new community app we just released. You can leverage the Generative AI tool to write initial draft MATLAB code or modify existing one.
- Get ideas from previous Mini Hack contests. There is a large gallery of amazing images, which provide you with ideas and code to start with.
- Remix is highly encouraged. Learning from others is the most effective way to learn. Make some SMALL changes and see what it would look like.

We look forward to seeing more of you joining us and having more fun!
Hello.
I use readgeoraster to read in a 25MB geotiff. I then turn around and immediately write out the data with geotiffwrite. The resultant file is now 250MB.
What is the explanation for this 10x increase in file size? The data read in are 'single' format. And that is the exact data I am writing out.
Dave
Seeing a colleague make this mistake (one I've had to fix multiple times in other's work too) makes me want to ask the community: would you like the awgn() function/blocks to give the option for creating a SNR at the bandwidth of the signal? Your typical flow is something like this:
- Create a signal, usually at some nominal upsampling factor (e.g., 4) such that it's now nicely over sampled, especially if you're using a RRC or similar pulse shaping filter.
- Potentially add a frequency offset (which might make the sample frequency even higher)
- Add AWGN channel model for a desired SNR
- Put this into your detector/receiver model
The problem is, when someone says, "I'm detecting XYZ at foo SNR," it should not magically improve as a function of the oversample. The problem isn't that awgn() generates white noise, that's what it's supposed to do and the typical receiver has noise across the entire band. The problem is that SNR is most properly defined as the signal power over the noise power spectral density times the signal's noise equivalent bandwidth. Now I looked and there's no handy function for computing NEBW for an input signal (there's just a function for assessing analysis windows). In practice it can get a bit tricky. The occupied bandwidth or HPBW are often close enough to the NEBW, we're usually not haggling over hundredths of a dB. So, in my not so humble opinion, the "measured" flag for awgn() should give an option for bandwidth matching or at least document the behavior better in the help page. All too often I'm seeing 3-6 (or worse) dB errors because people aren't taking the signal's bandwidth into account.
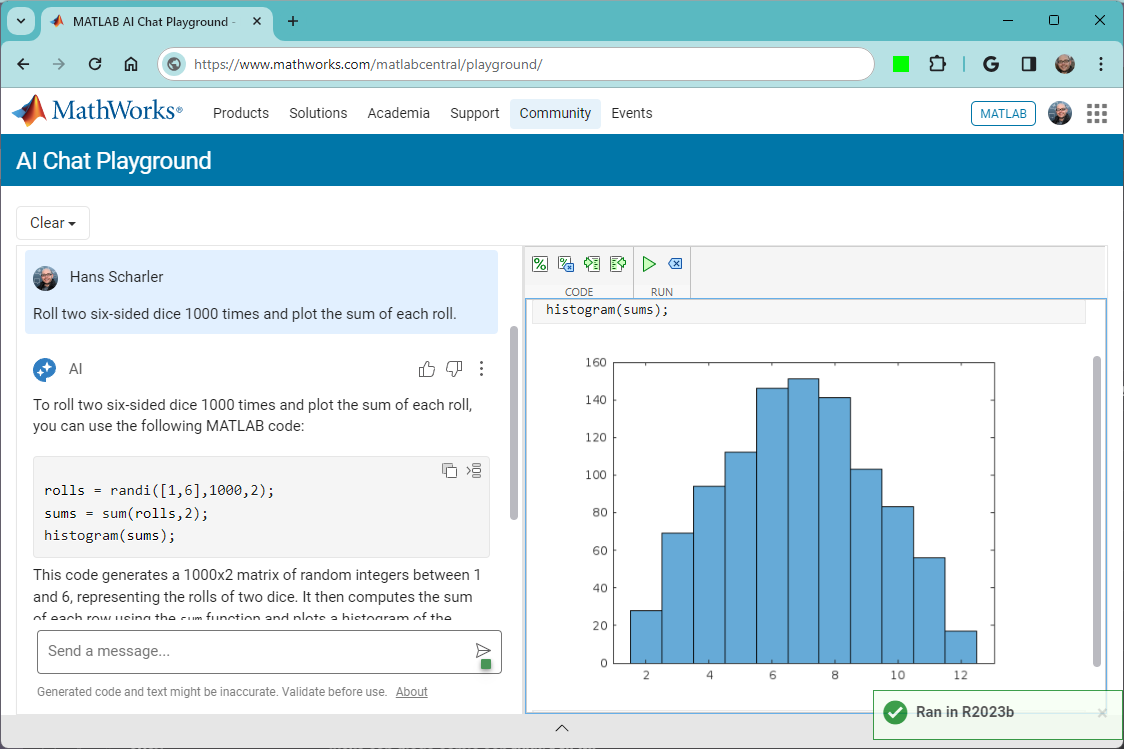
Unlike last year's contest, there are some new technologies this year that might offer some advantages. Namely generative AI's like ChatGPT, Bard, etc. Not to be excluded, MathWorks just launched the AI Chat Playground :)
The MATLAB AI Chat Playground is open to everyone!
Check it out here on the community: https://www.mathworks.com/matlabcentral/playground
i need to create an app in app designer that is able to convert ac to dc. i already created the layout of the app and i created a curcuit that is able to convert ac to dc in sumilink. but i am having troubles linking the circuit simulation to the app.
Basically, i want the user to input the voltage in the app and it should send that data to the simulation and the output should come back to the app.
I want to use "phased" fuction to generate pedestrain dataset, but I don't know how to generate multi-path.
Hi
I connected raspberry pi with MATLAB. But when I deployed the function, I kept reminding me that the function was not found. But my function does exist and can be implemented
Can you tell me why and how to solve it?
Many thanks,
Bang
When I apply genetic algorithm to find the optimal parameter, before the parameter enters the algorithm, I have controlled the parameter to keep two decimals in their respective ranges, but when the final output, the optimal parameter returned is really six decimals. Why? What am I supposed to do? (Note: I need to keep two decimal places in the parameter before entering the algorithm, because a change of 0.001 in the parameter has a great effect on the result, so I can't round the result directly.)Look forward to your reply~
good afternoon everyone my name is Dundu lawan haruna ,i'm a final year student at the department of computer engineering ABU Zaria, Nigerian , and i wanted to do my final year project based on computer vision : project topic , designing an eye glasses to help those people with visual imparement to be able to navigate enviroment efficiently , that's why i need a support from you guys ,all advised are highly well come , thank you for your support.
Participants across all skill levels are welcome to join! You can participate by creating a new animation or remixing an existing one with up to 2,000 characters of MATLAB code.
Contest Tips:
- Before you start, we highly recommend you check out the two examples - Bouncing and Spinning - to understand how the contest works.
- Share your thoughts, ask questions, or connect with others in our contest discussion channel.
Note that the first week (Nov. 6th, 2023, ~ Nov. 12th, 2023) is for creating entries only. Voting does not begin until the second week.
We look forward to seeing your creative work. Let the contest begin!
Hi, Im new to here. I wanted to ask for assitance in plotting ellipsoids onto XYZ plots based on Excel data. The data shows details for seismic events but the analysis needs to be just looking into the data as points on a XYZ graph. I have no experience with Matlab and any help would be greatly appreciated.
The first column is to identify the point; Column B is the time of the event; Column C-E is the location of the point. Column D reflects the amount of energy released. Colums G-R are for eigenvalues and eigenvectors.
Each ellipsoid is described by the 3 semi-major axes, named 1, 2, 3 in our file.
The 3 columns Axis 1, Axis 2, Axis 3 are the length (eigenvalues) of the 3 semi-major axis in metres.
The next 9 columns define the semi-major axis vectors (eigenvectors), so for example [Vector 1 X, Vector 1 Y, Vector 1 Z] define the 3 direction cosines (XYZ) of the Axis 1 vector.
So for example:
Axis 1 of the ellipsoid for Trigger ID 1 (screenshot below) has half-length 61m. It has vector orientation [-0.97, -0.06, 0.25], which can be imagined as a 3D line between point [0,0,0] and [-0.97, -0.6, 0.25].
I want to see if its possible to write something to convert them into XYZ points on an ellipsoid surface.
Or Find the Max value for Axis 1, Axis 2, Axis 3 – which tells you the maximum location uncertainty in metres for each event. This will normally be Axis 3.
If you then look at Vector 3 Z it will usually be close to +1.0 or -1.0 (which are the maximum and minimum values). If it is close to +/- 1.0 it means that the axis is near vertical. If it is close to 0.0 then it is horizontal.
Surface monitoring networks normally have the greatest location uncertainty in depth.
These specific eigenvectors mean:
[X=0.0, Y=+/-1.0, Z=0.0] would be North/South (ie: the Y component is largest).
[X=+/-1.0, Y=0.0, Z=0.0] would be East/West (ie: X biggest)
[X=0.0, Y=0.0, Z=+/-1.0] would be vertical
I have 600+ rows and the aim is to look at the elliposids to make interpretations on there orientation and their distrubtion. Thank you for any help.