Results for
hope this message finds you well. I am currently working on a project involving the design and numerical simulation of metalenses using Zemax and MATLAB. The design phase involves saving phase data from the Zemax simulation, which is later used in a numerical script to generate the metalens in MATLAB.
I have a MATLAB file that contains the phase data saved from Zemax, but I am unsure of the specific method or format used to extract and save the data from Zemax. The phase data I currently have in MATLAB is as follows:
- Phase matrix: 571 x 571 (double)
- X data: 571 x 1 (double)
- Y data: 571 x 1 (double)
Could you please provide guidance on:
- How this phase data was likely saved from Zemax into MATLAB?
- What steps or scripts were used to extract this information from the design, particularly the 571 x 571 phase matrix and the corresponding X and Y data?
- Any best practices or tools available in Zemax for exporting such data?
This information will help me reproduce the workflow and proceed with my analysis.
Thank you for your support. I look forward to your guidance.
Best regards,
Zaka
Always!
29%
It depends
14%
Never!
21%
I didn't know that was possible
36%
1810 votes
I went to perform an IoT for an automated plantation but the same error always occurs to me when I upload it to the mcu node, which is: Connection to ThingSpeak failed.
Hello everyone,
Over the past few weeks, our community members have shared some incredible insights and resources. Here are some highlights worth checking out:
Interesting Questions
Johnathan is seeking help with implementing a complex equation into MATLAB's curve fitting toolbox. If you have experience with curve fitting or MATLAB, your input could be invaluable!
Popular Discussions
Athanasios continues his exploration of the Duffing Equation, delving into its chaotic behavior. It's a fascinating read for anyone interested in nonlinear dynamics or chaos theory.
John shares his playful exploration with MATLAB to find a generative equation for a sequence involving Fibonacci numbers. It's an intriguing challenge for those who love mathematical puzzles.
From File Exchange
Ayesha provides a graphical analysis of linearised models in epidemiology, offering a detailed look at the dynamics of these systems. This resource is perfect for those interested in mathematical modeling.
Gareth brings some humor to MATLAB with a toolbox designed to share jokes. It's a fun way to lighten the mood during conferences or meetups.
From the Blogs
Ned Gulley interviews Tim Marston, the 2023 MATLAB Mini Hack contest winner. Tim's creativity and skills are truly inspiring, and his story is a must-read for aspiring programmers.
Sivylla discusses the integration of AI with embedded systems, highlighting the benefits of using MATLAB and Simulink. It's an insightful read for anyone interested in the future of AI technology.
Thank you to all our contributors for sharing your knowledge and creativity. We encourage everyone to engage with these posts and continue fostering a vibrant and supportive community.
Happy exploring!
Explore the newest online training courses, available as of 2024b: one new Onramp, eight new short courses, and one new learning path. Yes, that’s 10 new offerings. We’ve been busy.
As a reminder, Onramps are free to all. Short courses and learning paths require a subscription to the Online Training Suite (OTS).
- Multibody Simulation Onramp
- Analyzing Results in Simulink
- Battery Pack Modeling
- Introduction to Motor Control
- Signal Processing Techniques for Streaming Signals
- Core Signal Processing Techniques in MATLAB (learning path – includes the four short courses listed below)
I was browsing the MathWorks website and decided to check the Cody leaderboard. To my surprise, William has now solved 5,000 problems. At the moment, there are 5,227 problems on Cody, so William has solved over 95%. The next competitor is over 500 problems behind. His score is also clearly the highest, approaching 60,000.
I've been working on some matrix problems recently(Problem 55225)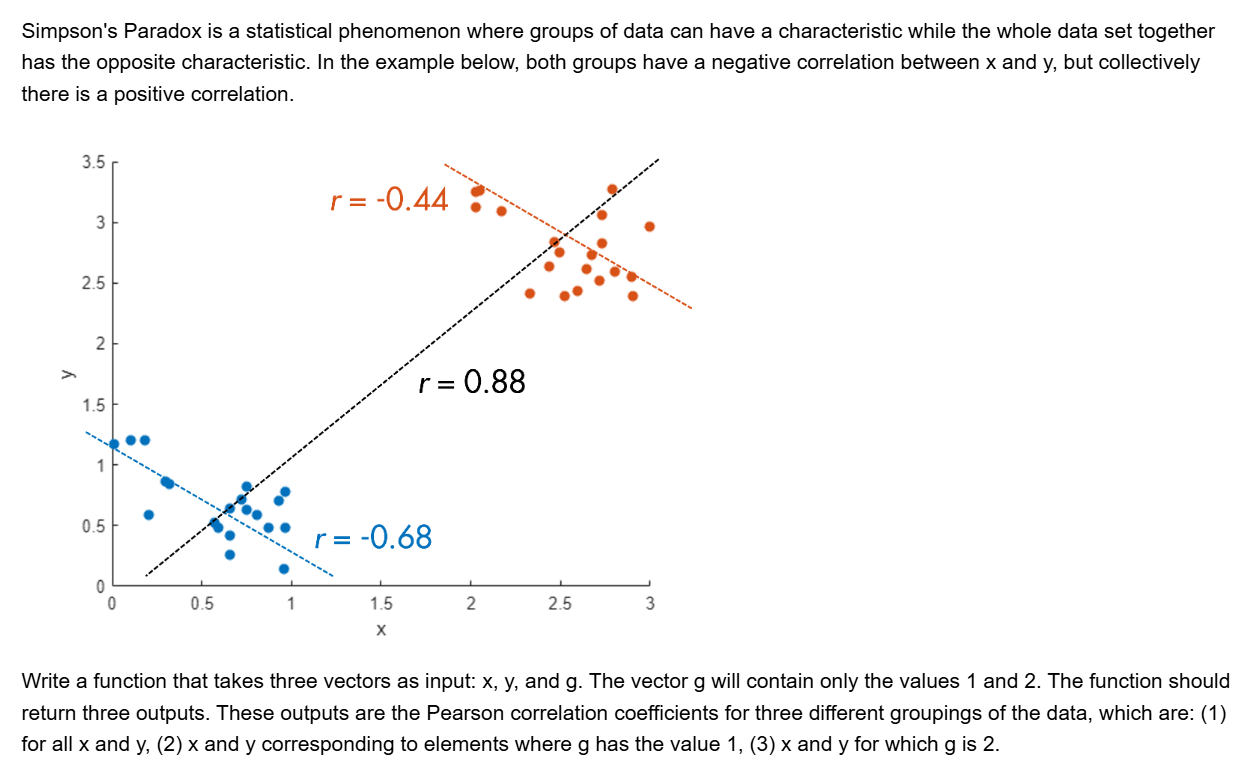
and this is my code
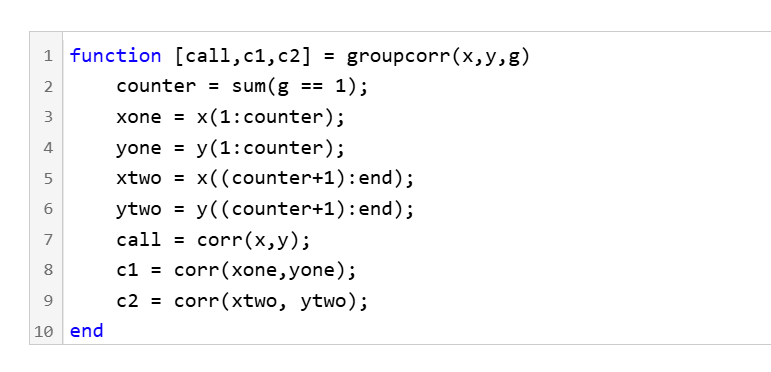
It turns out that "Undefined function 'corr' for input arguments of type 'double'." However, should't the input argument of "corr" be column vectors with single/double values? What's even going on there?
It's been over six years since I've written any serious MATLAB code, so I thought it would be fun to see how easily ChatGPT could help me out. While others have probably already used ChatGPT to generate MATLAB code, I didn't find any evidence of it when I searched through the ThingSpeak forum. That inspired me to post an example to get people thinking about it.
This example reads four temperature fields from the same channel and plots them on a single graph.
My ChatGPT prompt:
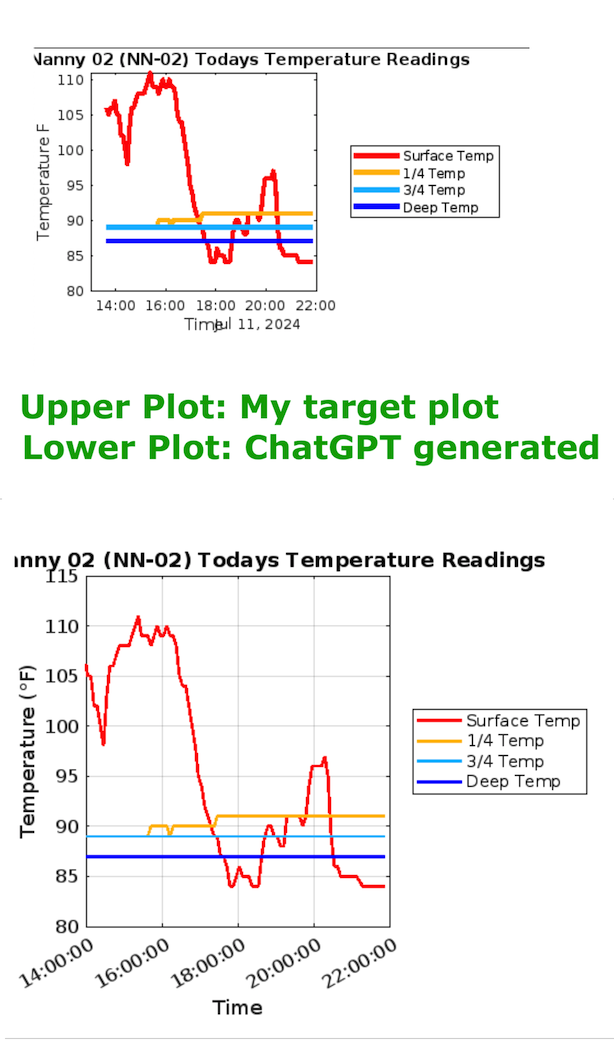
The prompt is pretty straightforward and essentially walks through all the elements of the chart that I wanted. It's also important to consider any filtering or "data cleansing" that should be done. Since this was my first time doing this, I decided to use an existing plot I was already familiar with as my "target state".
The prompt: "I would like you to generate some MATLAB code to create what is called a MATLAB Visualization. Its purpose will be to generate a chart of 4 fields found in a ThingSpeak channel. The ThingSpeak channel name is "Nest Nanny 2 (NN-02)" and its channel id (needed for the code) is xxxxxxx. The read api key is XXXXXXXXXXXXXXXX. The chart title should be "Nest Nanny 02 (NN-02) Todays Temperature Readings" It should plot data from 4 fields (field 3 - 6) who's names are "Surface Temp", "1/4 Temp", "3/4 Temp", and "Deep Temp". I would like the plot lines for these 4 fields to be different colors (red, orange, cyan, and blue) but on the same chart. I would like Temperature in Fahrenheit to be on the Y axis and Time on the x axis. I would like it to display the last 100 data points. I'd like to use this colororder. colororder(["#FF0000","#FFBB00","#00BBFF", "#0000FF"]) I would like the legend to be to the right of the chart, not contained within the chart. No temperature data should have a value of 50 or less and we can assume it's a sensor issue when this is observed. If a data value is 50 or less, use the value of it's nearest (in the time series) non-zero, non-negative value for that field. The data is stored in the channel as Fahrenheit and does not need to be converted from Celsius. "
Because I did this exercise using an existing plot and had a clear objective in mind, it was relatively quick to iterate four or five times with ChatGPT to refine my prompt. In just a few minutes, the generated plot almost perfectly matched my existing plot. (I xxxx'ed out the channel ID and API key before posting.) For someone who now only occasionally uses MATLAB, this approach saves time and will hopefully allow me to tap into elements of MATLAB that are now beyond my skill level and memory. ;)
ChatGPT generated MATLAB code:
% MATLAB code to create a ThingSpeak Visualization for temperature readings
% Define channel ID and Read API Key
channelID = xxxxxxx;
readAPIKey = 'XXXXXXXXXXXXXXXX';
% Number of data points to retrieve
numPoints = 100;
% Read data from the ThingSpeak channel for fields 3 to 6
[data, time] = thingSpeakRead(channelID, ...
'Fields', [3 4 5 6], ...
'NumPoints', numPoints, ...
'ReadKey', readAPIKey);
% Replace any value 50 or less with the nearest non-zero, non-negative value
for i = 1:size(data, 2)
% Identify indices where the data is 50 or less
badIndices = find(data(:,i) <= 50);
% Identify indices where the data is valid (greater than 50)
validIndices = find(data(:,i) > 50);
% Interpolate to replace bad values
if ~isempty(validIndices)
data(badIndices, i) = interp1(validIndices, data(validIndices, i), badIndices, 'linear', 'extrap');
end
end
% Plot the data
figure;
colororder(["#FF0000","#FFBB00","#00BBFF", "#0000FF"]); % Set the color order
plot(time, data(:,1), 'LineWidth', 2); hold on;
plot(time, data(:,2), 'LineWidth', 2);
plot(time, data(:,3), 'LineWidth', 2);
plot(time, data(:,4), 'LineWidth', 2);
hold off;
% Add labels and title
xlabel('Time');
ylabel('Temperature (°F)');
title('Nest Nanny 02 (NN-02) Todays Temperature Readings');
% Add legend and move it to the right of the chart
legend({'Surface Temp', '1/4 Temp', '3/4 Temp', 'Deep Temp'}, ...
'Location', 'eastoutside');
% Format the time on the x-axis
datetick('x', 'HH:MM:SS', 'keepticks');
grid on;
% Adjust the figure for better readability
set(gca, 'FontSize', 12);
Plot Comparison:
I am creating an ESP32 device which will upload data to thingspeak channel and I want the data to be displayed on my website after login. I have succesfully completed the first part of uploading the data to thingspeak. Any suggestions with second part will be very much appreciated.
Hi,
I tried several times to clear my channel data.
I would expect, when I click on Channel settings-clear channel all data from the channel is gone.
For me the data stay in. Delete channel works fine.
Is there a trick?
many thanks for your help
HEP
I'm almost embarressed enough to not ask this. :) I assumed sorting the "Updated" column in the "My Channels" view would sort my channels based on when data was last written to (last updated to) the channel
However, I have channels that have received date in August and yet the date/time stamp in the Uodated column displays a June date and therefore they sort in the wrong order. Does "update" mean something other than a data update, such as a settings update? If so, if there a way to sort the channels by the more recent data update?
With a deployment of ThingSpeak on August 15th, 2024, we are using a new library for visualization of ThingSpeak channel charts. This should require no changes on your part. If you notice any discrepancies/differences in your channel visualization, please post a screenshot on this thread.
Swimming, diving
16%
Other water-based sport
4%
Gymnastics
20%
Other indoor arena sport
15%
track, field
24%
Other outdoor sport
21%
346 votes
Due to API changes at X, formerly known as Twitter, the integration between ThingSpeak and X, specifically the ThingTweet functionality, was not operational for a number of months. As of August 1st, 2024, the ThingTweet functionality is being deprecated.
The alternative, which requires manual steps due to X requiring manual application for a developer account, is to use the TWITTER function from Datafeed toolbox in MATLAB code. You can then create a React that is associated with this MATLAB code to post to X.
Hello, MATLAB enthusiasts! 🌟
Over the past few weeks, our community has been buzzing with insightful questions, vibrant discussions, and innovative ideas. Whether you're a seasoned expert or a curious beginner, there's something here for everyone to learn and enjoy. Let's take a moment to highlight some of the standout contributions that have sparked interest and inspired many. Dive in and see how you can join the conversation or find solutions to your own challenges!
Interesting Questions
How can i edit my code which works on r2014b version at work but not on my personal r2024a version? by Oluwadamilola Oke
Oluwadamilola Oke is seeking assistance with a MATLAB code that works on version r2014b but encounters errors on version r2024a. The issue seems to be related to file location or the use of specific commands like movefile. If you have experience with these versions of MATLAB, your expertise could be invaluable.
Yohay has been working on a simulation to measure particle speed and fit it to the Maxwell-Boltzmann distribution. However, the fit isn't aligning perfectly with the data. Yohay has shared the code and histogram data for community members to review and provide suggestions.
Alessandro Livi is toggling between C++ for Arduino Pico and MATLAB App Designer. They suggest an enhancement where typing // for comments in MATLAB automatically converts to %. This small feature could improve the workflow for many users who switch between programming languages.
Popular Discussions
Athanasios Paraskevopoulos has started an engaging discussion on Gabriel's Horn, a shape with infinite surface area but finite volume. The conversation delves into the mathematical intricacies and integral calculations required to understand this paradoxical shape.
Honzik has brought up an interesting topic about custom fonts for MATLAB. While popular coding fonts handle characters like 0 and O well, they often fail to distinguish between different types of brackets. Honzik suggests that MathWorks could develop a custom font optimized for MATLAB syntax to reduce coding errors.
From the Blogs
Guy Rouleau addresses a common error in Simulink models: "Derivative of state '1' in block 'X/Y/Integrator' at time 0.55 is not finite." The blog post explores various tools and methods to diagnose and resolve this issue, making it a valuable read for anyone facing similar challenges.
Guest writer Gianluca Carnielli, featured by Adam Danz, shares insights on creating time-sensitive animations using MATLAB. The article covers controlling the motion of multiple animated objects, organizing data with timetables, and simplifying animations with the retime function. This is a must-read for anyone interested in scientific animations.
Feel free to check out these fascinating contributions and join the discussions! Your input and expertise can make a significant difference in our community.
I use "x = ThingSpeak.writeFields(myChannelNumber1, myWriteAPIKey1);" in my code to update the ThingSpeak channel. 4 fields are associated with this channel. This statement is executed about once every 5 minutes.
Roughly 60% of the time, I got an error message "HTTP error code -301". The other 40% of time the channel update is successful. What does the "HTTP error code -301" mean? Any suggestion on how to improve the success rate of the channel update
function ans = your_fcn_name(n)
n;
j=sum(1:n);
a=zeros(1,j);
for i=1:n
a(1,((sum(1:(i-1))+1)):(sum(1:(i-1))+i))=i.*ones(1,i);
end
disp
I am trying to earn my Intro to MATLAB badge in Cody, but I cannot click the Roll the Dice! problem. It simply is not letting me click it, therefore I cannot earn my badge. Does anyone know who I should contact or what to do?
Problem statement: I've written a visualization that I'd like to use on potentially hundreds of different channels in my commerical account. Because it contains code that's unique to the channel (channel id, read API key, etc.) I have to create and maintain a duplicate visualization for each channel. This is wasteful, a source of errors, and almost intractable for a commercial customer with a high channel count.
My request is that MATLAB Visualizations be extended to support parameters, but only a predefined set to reduce the scope. I would propose a subset of the parameters currently supported by the ThingSpeak API. For example, thingSpeakRead supports (requires) readChannelID, NumPoints, and a ReadKey etc. If those were elevated to also be allowed as Visualization parameters, I imagine it would satisfy a large subset of user needs.
The poor man's version of this would be if ThingSpeak supported just one special parameter, such as %CHANNEL_ID%. If this was available within the visualization code one could use it as a key into table to get the other pieces of data like API keys, etc. It would be have to be passed on the visualization url (https://thingspeak.com/apps/matlab_visualizations/573779?readChannelID=xxxxx). Not sure how the visualization would pick it up in the use case where it's called from the ThingSpeak website under the user's list of MATLAB Visualizations. Perhaps it can be prompted for.
I initially considered user defined functions or libraries but they are not supported and I can see that that would require even more development work to support. The workarounds described in this thread aren't suitable for me. https://www.mathworks.com/matlabcentral/answers/2102981-how-to-use-private-functions-lib-in-thingspeak?s_tid=srchtitle_community_thingspeak_14_libraries
thanks!
Tom
how can I link a chinese flow meter to this website