eqn =
Results for
I am curious as to how my goal can be accomplished in Matlab.
The present APP called "Matching Network Designer" works quite well, but it is limited to a single section of a "PI", a "TEE", or an "L" topology circuit.
This limits the bandwidth capability of the APP when the intended use is to create an amplifier design intended for wider bandwidth projects.
I am requesting that a "Broadband Matching Network Designer" APP be developed by you, the MathWorks support team.
One suggestion from me is to be able to cascade a second section (or "pole") to the first.
Then the resulting topology would be capable of achieving that wider bandwidth of the microwave amplifier project where it would be later used with the transistor output and input matching networks.
Instead of limiting the APP to a single frequency, the entire s parameter file would be used as an input.
The APP would convert the polar s parameters to rectangular scaler complex impedances that you already use.
At that point, having started out with the first initial center frequency, the other frequencies both greater than and less than the center would come into use by an optimization of the circuit elements.
I'm hoping that you will be able to take on this project.
I can include an attachment of such a Matching Network Designer APP that you presently have if you like.
That network is centered at 10 GHz.
Kimberly Renee Alvarez.
310-367-5768
私の場合、前の会社が音楽認識アプリの会社で、アルゴリズム開発でFFTが使われていたことがきっかけでした。でも、MATLABのすごさが分かったのは、機械学習のオンライン講座で、Andrew Ngが、線型代数を使うと、数式と非常に近い構文のコードで問題が処理できることを学んだ時でした。
Dears,
I am running a MS-DSGE model using RISE toolbox. I want to add a fiscal shock and examine its effect on output, price...
%fiscal shock
shock_type = {'eps_G'};
%here is my variable list of a cell array of character variables and not a struct.
var_list={'log_y','C','pi_ann','B_nominal','B','sp','i_ann','r_real_ann','P'};
% EXOGENOUS SWITCHING
myirfs1=irf(m1,'irf_periods',24,'irf_shock_sign',1);
myirfs1 = struct()
myirfs1.eps_CP = struct();
myirfs1.eps_G = struct();
myirfs1.eps_T = struct();
myirfs1.eps_a = struct();
myirfs1.eps_nu = struct();
myirfs1.eps_z = struct();
var_aux = {'log_y','C','pi_ann','B_nominal','B','sp','i_ann','r_real_ann','P'};
var_aux3 = {'eps_G_log_y','eps_G_C','eps_G_pi_ann','eps_G_B_nominal','eps_G_B','eps_G_sp','eps_G_i_ann','eps_G_r_real_ann','eps_G_P'};
fieldnames(myirfs1)
myirfs1.eps_G.var = var_aux3 % assign the data array to the struct variable
irf_fisc = struct();
for i = 1:numel(var_aux)
irf_fisc.var_aux{i} = [0,myirfs1.eps_G.var{i}]';
end
irf_fisc.var_aux(1)
irf_fisc
% what is the write syntax to assign value (simulated data) to the struct?
myirfs1.eps_G.logy = data(:,1)/10; %Is the suggested code. but where is the data variable located? should I create it data = randn(TMax, N); or it is already simulated?
Dears,
I need your help. hocan I access the subfields within eps_G, where eps_G is a structure.
whos myirfs1
Name Size Bytes Class Attributes
myirfs1 1x1 374094 struct
%% disp(fieldnames(myirfs1))
>> disp(fieldnames(myirfs1))
{'eps_CP'}
{'eps_G' }
{'eps_T' }
{'eps_a' }
{'eps_nu'}
{'eps_z' }
% choose 1 or 2 below
shock_type = {'eps_G','eps_nu'};
var_aux = {'log_y','C','pi_ann','B_nominal','B','sp','i_ann','r_real_ann','P'};
var_aux2 = {'log_y_eps_nu','C_eps_nu','pi_ann_eps_nu','B_nominal_eps_nu','B_eps_nu','sp_eps_nu','i_ann_eps_nu','r_real_ann_eps_nu','P_eps_nu'};
var_aux3 = {'eps_G_log_y','eps_G_C','eps_G_pi_ann','eps_G_B_nominal','eps_G_B','eps_G_sp','eps_G_i_ann','eps_G_r_real_ann','eps_G_P'};
%Irfs of monetary and fiscal policy
irf_mon = struct();
irf_fisc = struct();
%% disp(fieldnames(myirfs1))
>> disp(fieldnames(myirfs1))
{'eps_CP'}
{'eps_G' }
{'eps_T' }
{'eps_a' }
{'eps_nu'}
{'eps_z' }
% when i run the following code it is unrecognized. can you suggest me what to do?
for i = 1:numel(var_aux)
irf_mon.(var_aux{i}) = [0,myirfs1(1).(var_aux3{i})]';
irf_fisc.(var_aux{i}) = [0,myirfs1(1).(var_aux3{i})]';
end
Unrecognized field name "log_y_eps_G".
Let's celebrate what made 2024 memorable! Together, we made big impacts, hosted exciting events, and built new apps.


Resource links:
I have a skeleton and i want to find the start and end point of that skeleton. My skeleton is like an oval/donut where there is little gap between the start and end
Hello,
Now that the "Copilot+PC" (Windows ARM) laptops are rapidly increasing in market share (Microsoft Surface Laptop, Dell XPS 13, HP OmniBook X 14, and more), are there any plans to provide builds for Matlab on Windows arm64?
Since there are already Windows builds of Matlab, it shouldn't be too hard to compile for Windows arm64, as far as I know. But I am not famaliar with Matlab's codebase.
Please try to publish Windows arm64 builds soon so that Matlab can be much more usable on Windows on ARM as it will run natively instead of in emulation.
Thank you very much.
Attaching the Photoshop file if you want to modify the caption.
can i add TMS320F28P55SJ launch pad to matlab simulik
Toolbox 全部入りの MATLAB ライセンス
67%
まだ持っていない Toolbox (下記にコメントください)
0%
MATLAB T シャツ
17%
MATLAB ルービックキューブ
0%
MATLAB 靴下
6%
MathWorks オフィス訪問チケット
11%
18 votes
この場は MATLAB や Simulink を使っている皆さんが、気軽に質問や情報交換ができる場所として作られました。日本語でも気軽に投稿ができるように今回日本語チャネルを解説します。
ユーザーの皆様とのやり取りを通じて、みんなで知識や経験を共有し、一緒にスキルアップしていきましょう。 どうぞお気軽にご参加ください。
そして日本語チャネル開設にあたってコメントくださった皆様、ありがとうございます!
We’d like to announce a change on the Machine Translation feature on MATLAB Answers.
When users are visiting our international domains (e.g. China or Japan), Answers provides the option to translate the content. Recently, we identified several security threats involving high-volume requests from certain IP addresses targeting our translation service.
As one of the countermeasures, we have now placed the Machine Translation feature behind a login requirement. While non-logged-in users will still see the 'Translate' button, it will be inactive (greyed out) until they log in.
We are actively collaborating with adjacent teams to develop solutions to better detect and block malicious requests.
Please let us know if you have any questions or concerns.
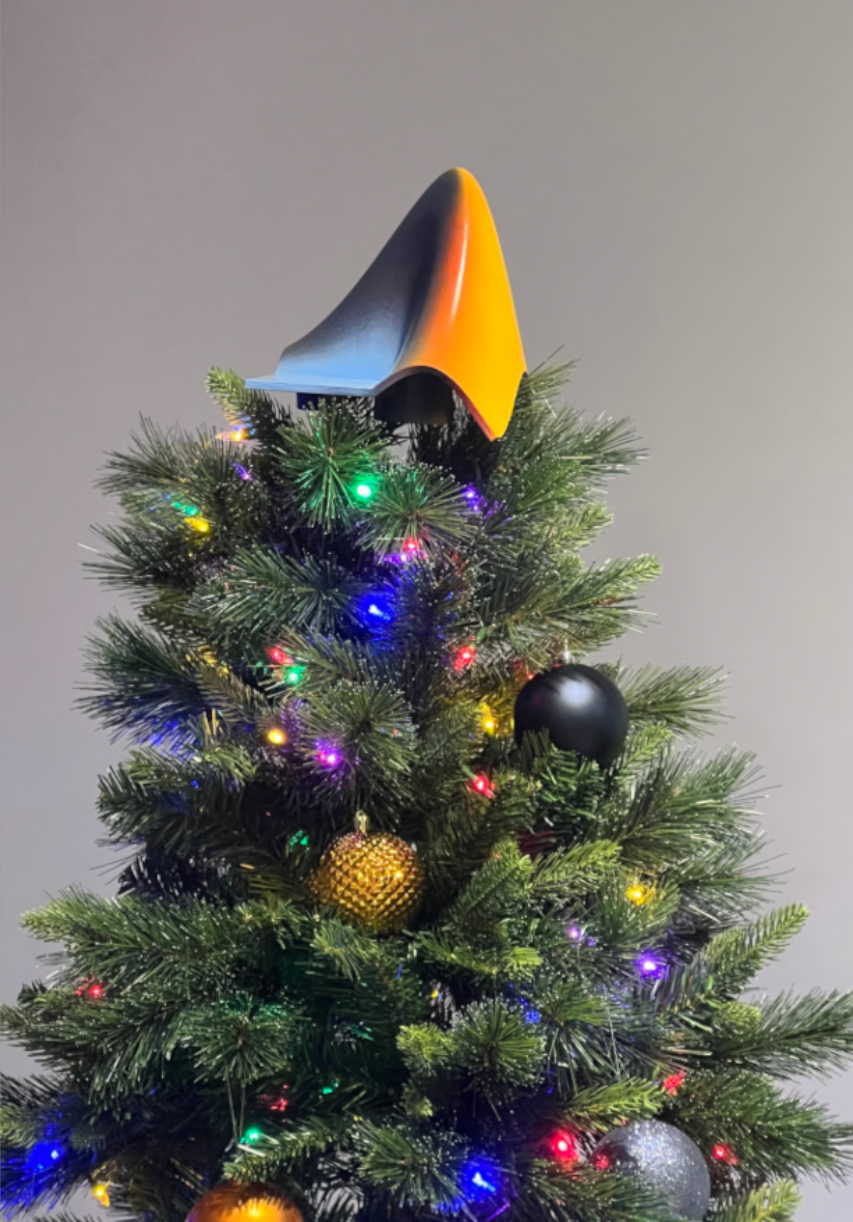
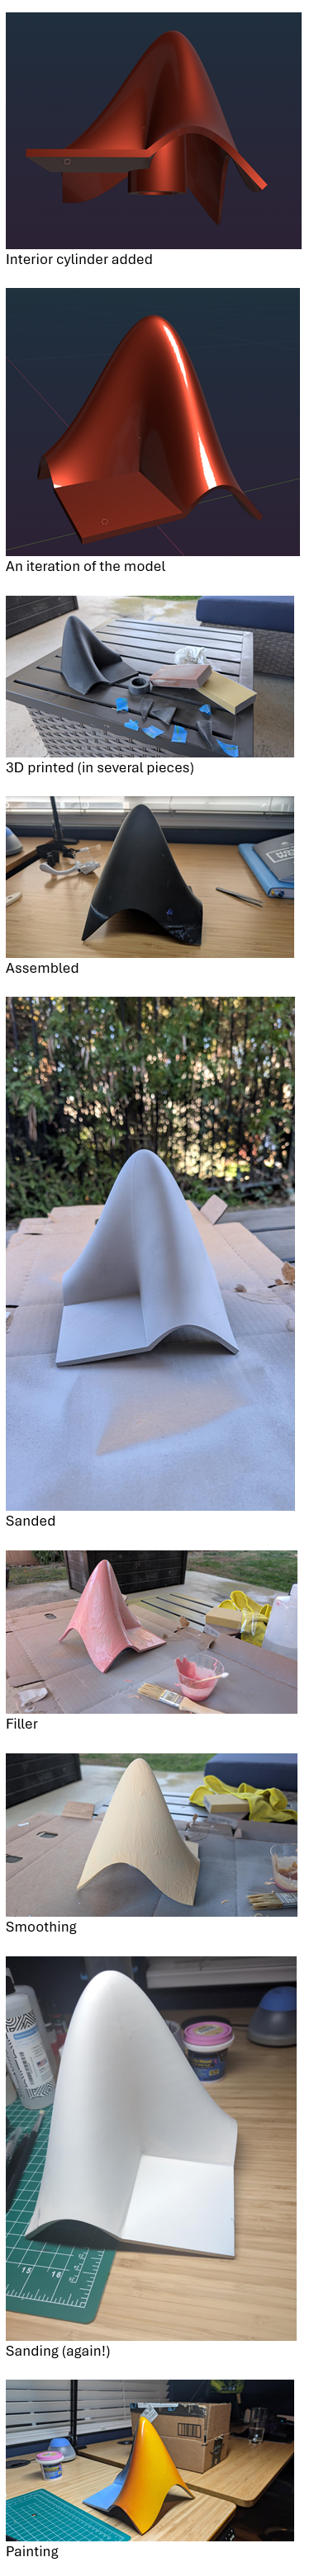
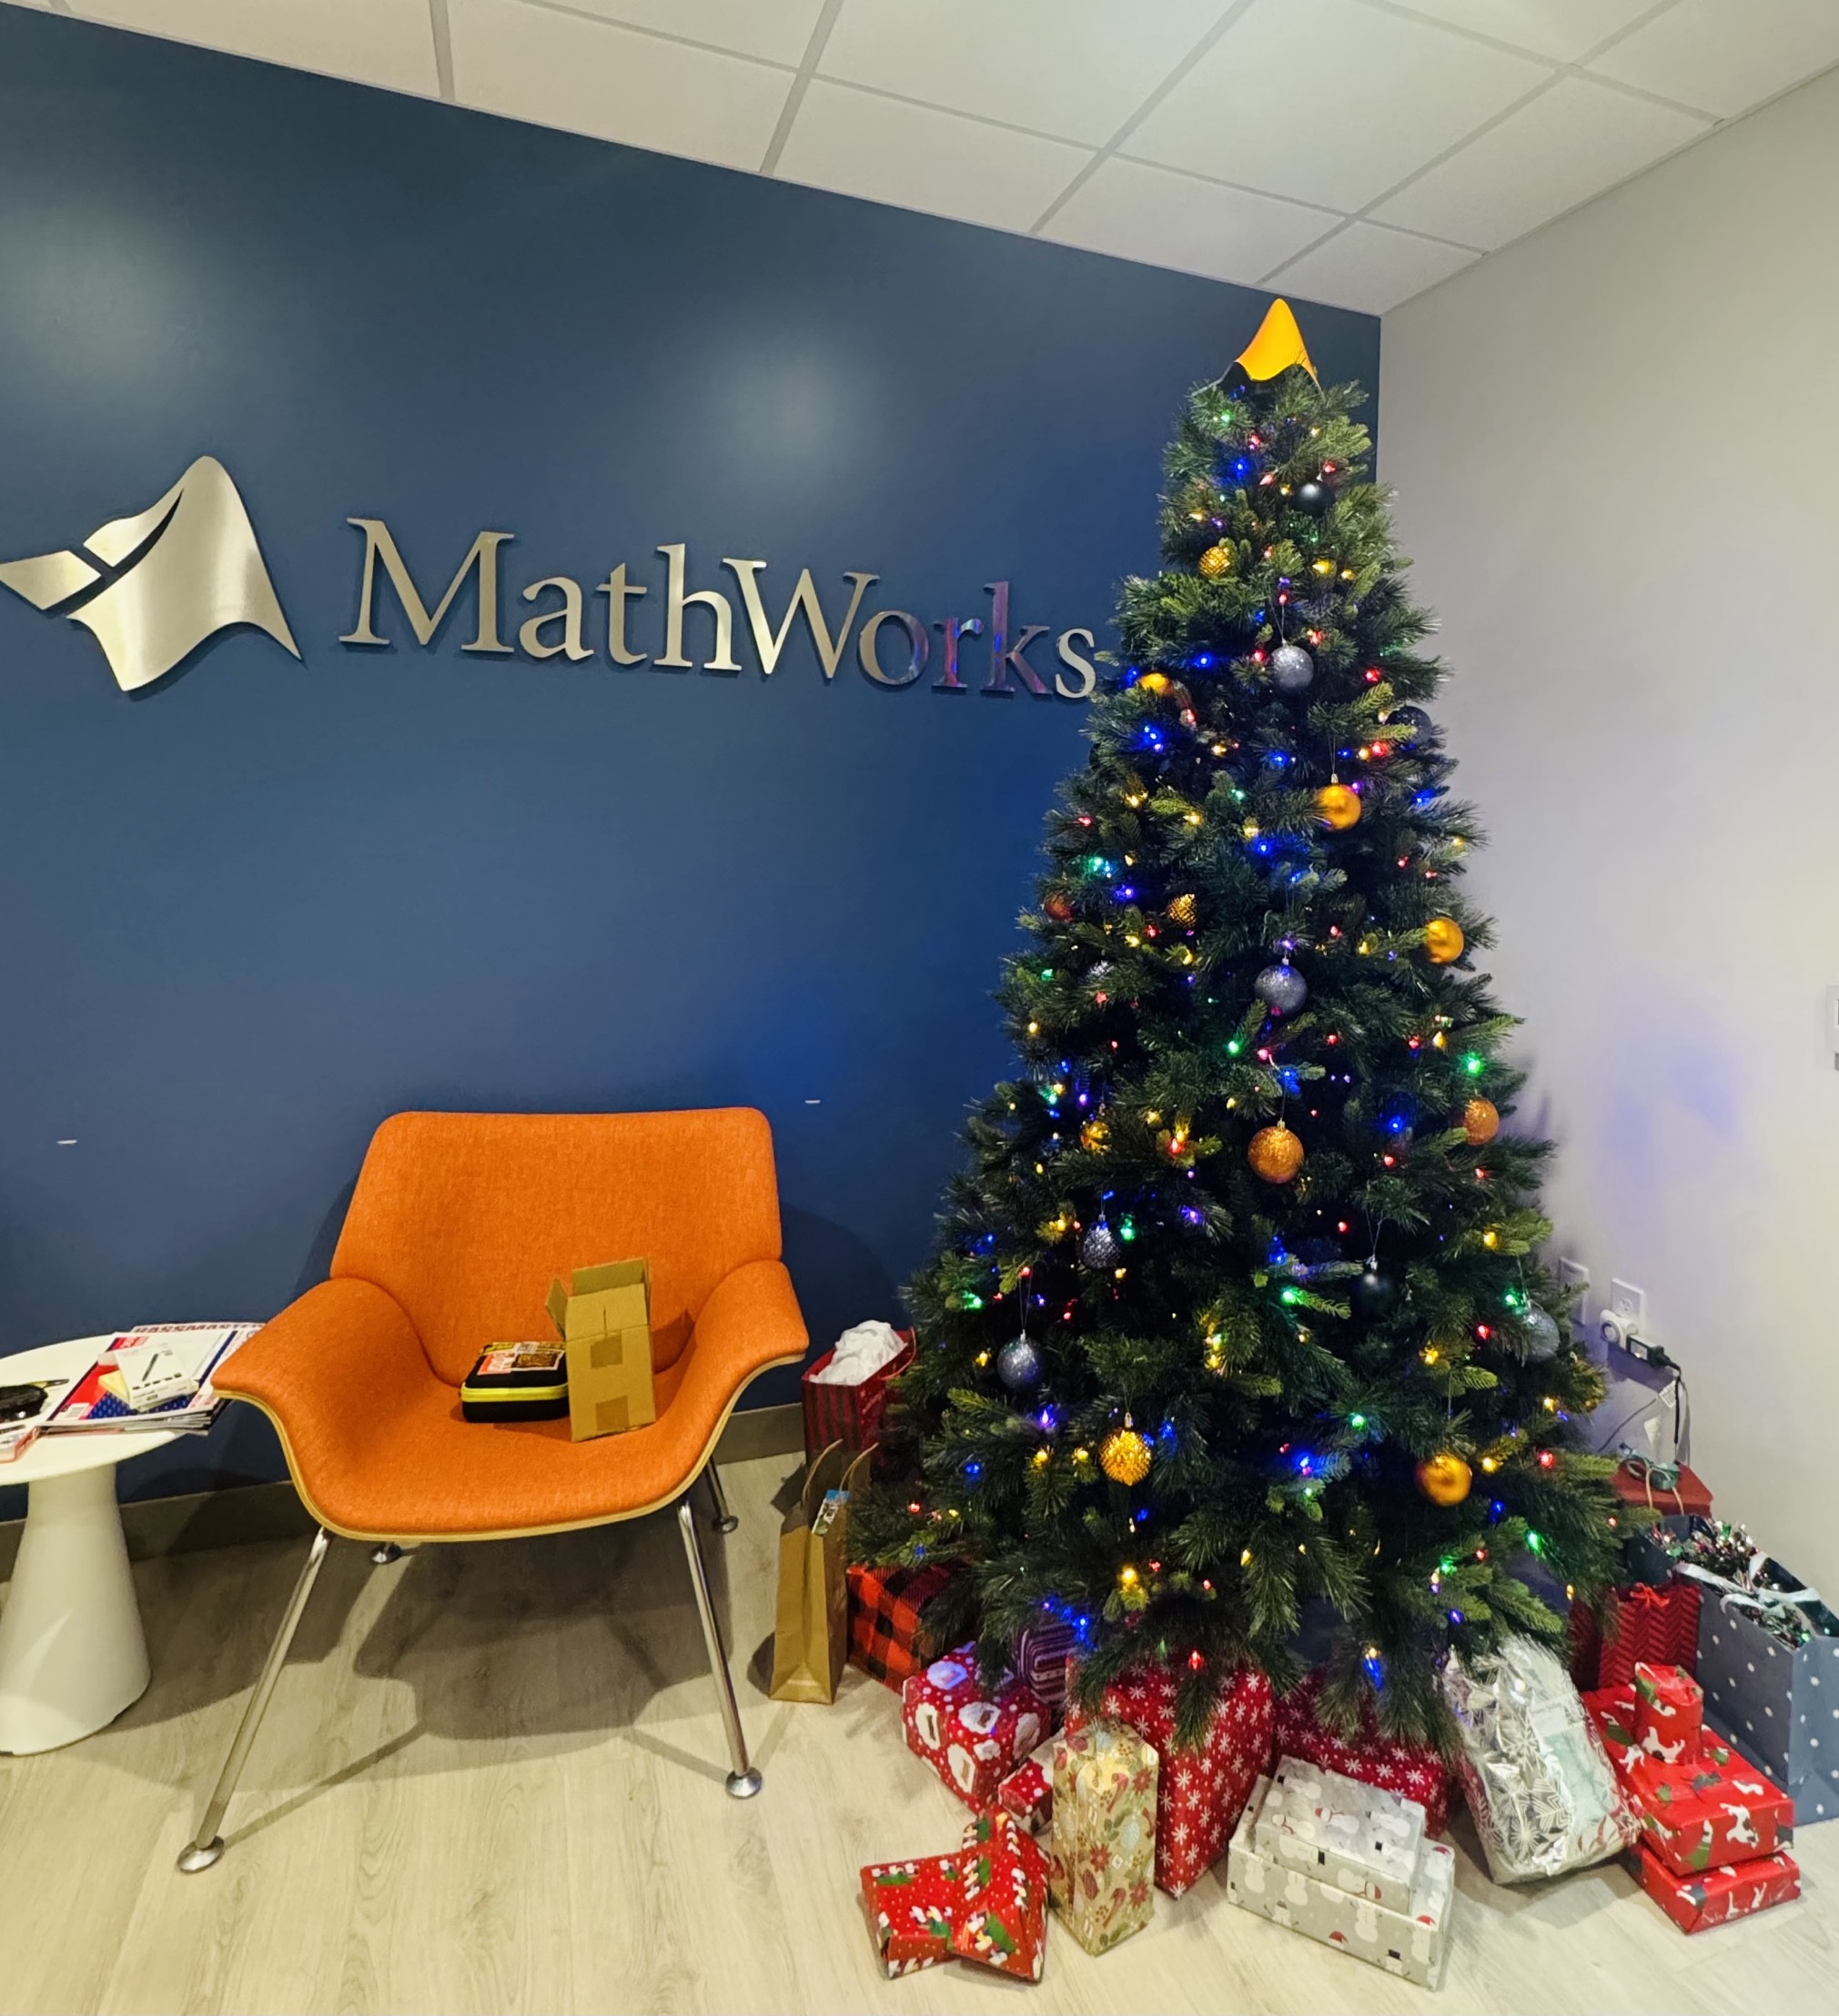
What better way to add a little holiday magic than the L-shaped membrane atop your evergreen? My colleagues output the shape and then added some thickness and an interior cylinder in Blender. Then, the shape was exported to STL and 3D printed (in several pieces). Then glued, sanded, primed, sanded again and painted. If you like, the STL file is attached. Thank you to https://blogs.mathworks.com/community/2013/06/20/paul-prints-the-l-shaped-membrane/ and a tip of the hat to MATLAB Ornament. Happy Holidays!
If you have a folder with an enormous number of files and want to use the uigetfile function to select specific files, you may have noticed a significant delay in displaying the file list.
Thanks to the assistance from MathWorks support, an interesting behavior was observed.
For example, if a folder such as Z:\Folder1\Folder2\data contains approximately 2 million files, and you attempt to use uigetfile to access files with a specific extension (e.g., *.ext), the following behavior occurs:
Method 1: This takes minutes to show me the list of all files
[FileName, PathName] = uigetfile('Z:\Folder1\Folder2\data\*.ext', 'File selection');
Method 2: This takes less than a second to display all files.
[FileName, PathName] = uigetfile('*.ext', 'File selection','Z:\Folder1\Folder2\data');
Method 3: This method also takes minutes to display the file list. What is intertesting is that this method is the same as Method 2, except that a file seperator "\" is added at the end of the folder string.
[FileName, PathName] = uigetfile('*.ext', 'File selection','Z:\Folder1\Folder2\data\');
I was informed that the Mathworks development team has been informed of this strange behaviour.
I am using 2023a, but think this should be the same for newer versions.
This post is more of a "tips and tricks" guide than a question.
If you have a folder with an enormous number of files and want to use the uigetfile function to select specific files, you may have noticed a significant delay in displaying the file list.
Thanks to the assistance from MathWorks support, an interesting behavior was observed.
For example, if a folder such as Z:\Folder1\Folder2\data contains approximately 2 million files, and you attempt to use uigetfile to access files with a specific extension (e.g., *.ext), the following behavior occurs:
Method 1: This takes minutes to show me the list of all files
[FileName, PathName] = uigetfile('Z:\Folder1\Folder2\data\*.ext', 'File selection');
Method 2: This takes less than a second to display all files.
[FileName, PathName] = uigetfile('*.ext', 'File selection','Z:\Folder1\Folder2\data');
Method 3: This method also takes minutes to display the file list. What is intertesting is that this method is the same as Method 2, except that a file seperator "\" is added at the end of the folder string.
[FileName, PathName] = uigetfile('*.ext', 'File selection','Z:\Folder1\Folder2\data\');
I was informed that the Mathworks development team has been informed of this strange behaviour.
I am using 2023a, but think this should be the same for newer versions.


Christmas is coming, here are two dynamic Christmas tree drawing codes:
Crystal XMas Tree
function XmasTree2024_1
fig = figure('Units','normalized', 'Position',[.1,.1,.5,.8],...
'Color',[0,9,33]/255, 'UserData',40 + [60,65,75,72,0,59,64,57,74,0,63,59,57,0,1,6,45,75,61,74,28,57,76,57,1,1]);
axes('Parent',fig, 'Position',[0,-1/6,1,1+1/3], 'UserData',97 + [18,11,0,13,3,0,17,4,17],...
'XLim',[-1.5,1.5], 'YLim',[-1.5,1.5], 'ZLim',[-.2,3.8], 'DataAspectRatio', [1,1,1], 'NextPlot','add',...
'Projection','perspective', 'Color',[0,9,33]/255, 'XColor','none', 'YColor','none', 'ZColor','none')
%% Draw Christmas tree
F = [1,3,4;1,4,5;1,5,6;1,6,3;...
2,3,4;2,4,5;2,5,6;2,6,3];
dP = @(V) patch('Faces',F, 'Vertices',V, 'FaceColor',[0 71 177]./255,...
'FaceAlpha',rand(1).*0.2+0.1, 'EdgeColor',[0 71 177]./255.*0.8,...
'EdgeAlpha',0.6, 'LineWidth',0.5, 'EdgeLighting','gouraud', 'SpecularStrength',0.3);
r = .1; h = .8;
V0 = [0,0,0; 0,0,1; 0,r,h; r,0,h; 0,-r,h; -r,0,h];
% Rotation matrix
Rx = @(V, theta) V*[1 0 0; 0 cos(theta) sin(theta); 0 -sin(theta) cos(theta)];
Rz = @(V, theta) V*[cos(theta) sin(theta) 0;-sin(theta) cos(theta) 0; 0 0 1];
N = 180; Vn = zeros(N, 3); eval(char(fig.UserData))
for i = 1:N
tV = Rz(Rx(V0.*(1.2 - .8.*i./N + rand(1).*.1./i^(1/5)), pi/3.*(1 - .6.*i./N)), i.*pi/8.1 + .001.*i.^2) + [0,0,.016.*i];
dP(tV); Vn(i,:) = tV(2,:);
end
scatter3(Vn(:,1).*1.02,Vn(:,2).*1.02,Vn(:,3).*1.01, 30, 'w', 'Marker','*', 'MarkerEdgeAlpha',.5)
%% Draw Star of Bethlehem
w = .3; R = .62; r = .4; T = (1/8:1/8:(2 - 1/8)).'.*pi;
V8 = [ 0, 0, w; 0, 0,-w;
1, 0, 0; 0, 1, 0; -1, 0, 0; 0,-1,0;
R, R, 0; -R, R, 0; -R,-R, 0; R,-R,0;
cos(T).*r, sin(T).*r, T.*0];
F8 = [1,3,25; 1,3,11; 2,3,25; 2,3,11; 1,7,11; 1,7,13; 2,7,11; 2,7,13;
1,4,13; 1,4,15; 2,4,13; 2,4,15; 1,8,15; 1,8,17; 2,8,15; 2,8,17;
1,5,17; 1,5,19; 2,5,17; 2,5,19; 1,9,19; 1,9,21; 2,9,19; 2,9,21;
1,6,21; 1,6,23; 2,6,21; 2,6,23; 1,10,23; 1,10,25; 2,10,23; 2,10,25];
V8 = Rx(V8.*.3, pi/2) + [0,0,3.5];
patch('Faces',F8, 'Vertices',V8, 'FaceColor',[255,223,153]./255,...
'EdgeColor',[255,223,153]./255, 'FaceAlpha', .2)
%% Draw snow
sXYZ = rand(200,3).*[4,4,5] - [2,2,0];
sHdl1 = plot3(sXYZ(1:90,1),sXYZ(1:90,2),sXYZ(1:90,3), '*', 'Color',[.8,.8,.8]);
sHdl2 = plot3(sXYZ(91:200,1),sXYZ(91:200,2),sXYZ(91:200,3), '.', 'Color',[.6,.6,.6]);
annotation(fig,'textbox',[0,.05,1,.09], 'Color',[1 1 1], 'String','Merry Christmas Matlaber',...
'HorizontalAlignment','center', 'FontWeight','bold', 'FontSize',48,...
'FontName','Times New Roman', 'FontAngle','italic', 'FitBoxToText','off','EdgeColor','none');
% Rotate the Christmas tree and let the snow fall
for i=1:1e8
sXYZ(:,3) = sXYZ(:,3) - [.05.*ones(90,1); .06.*ones(110,1)];
sXYZ(sXYZ(:,3)<0, 3) = sXYZ(sXYZ(:,3) < 0, 3) + 5;
sHdl1.ZData = sXYZ(1:90,3); sHdl2.ZData = sXYZ(91:200,3);
view([i,30]); drawnow; pause(.05)
end
end

Curved XMas Tree
function XmasTree2024_2
fig = figure('Units','normalized', 'Position',[.1,.1,.5,.8],...
'Color',[0,9,33]/255, 'UserData',40 + [60,65,75,72,0,59,64,57,74,0,63,59,57,0,1,6,45,75,61,74,28,57,76,57,1,1]);
axes('Parent',fig, 'Position',[0,-1/6,1,1+1/3], 'UserData',97 + [18,11,0,13,3,0,17,4,17],...
'XLim',[-6,6], 'YLim',[-6,6], 'ZLim',[-16, 1], 'DataAspectRatio', [1,1,1], 'NextPlot','add',...
'Projection','perspective', 'Color',[0,9,33]/255, 'XColor','none', 'YColor','none', 'ZColor','none')
%% Draw Christmas tree
[X,T] = meshgrid(.4:.1:1, 0:pi/50:2*pi);
XM = 1 + sin(8.*T).*.05;
X = X.*XM; R = X.^(3).*(.5 + sin(8.*T).*.02);
dF = @(R, T, X) surf(R.*cos(T), R.*sin(T), -X, 'EdgeColor',[20,107,58]./255,...
'FaceColor', [20,107,58]./255, 'FaceAlpha',.2, 'LineWidth',1);
CList = [254,103,110; 255,191,115; 57,120,164]./255;
for i = 1:5
tR = R.*(2 + i); tT = T+i; tX = X.*(2 + i) + i;
SFHdl = dF(tR, tT, tX);
[~, ind] = sort(SFHdl.ZData(:)); ind = ind(1:8);
C = CList(randi([1,size(CList,1)], [8,1]), :);
scatter3(tR(ind).*cos(tT(ind)), tR(ind).*sin(tT(ind)), -tX(ind), 120, 'filled',...
'CData', C, 'MarkerEdgeColor','none', 'MarkerFaceAlpha',.3)
scatter3(tR(ind).*cos(tT(ind)), tR(ind).*sin(tT(ind)), -tX(ind), 60, 'filled', 'CData', C)
end
%% Draw Star of Bethlehem
Rx = @(V, theta) V*[1 0 0; 0 cos(theta) sin(theta); 0 -sin(theta) cos(theta)];
% Rz = @(V, theta) V*[cos(theta) sin(theta) 0;-sin(theta) cos(theta) 0; 0 0 1];
w = .3; R = .62; r = .4; T = (1/8:1/8:(2 - 1/8)).'.*pi;
V8 = [ 0, 0, w; 0, 0,-w;
1, 0, 0; 0, 1, 0; -1, 0, 0; 0,-1,0;
R, R, 0; -R, R, 0; -R,-R, 0; R,-R,0;
cos(T).*r, sin(T).*r, T.*0];
F8 = [1,3,25; 1,3,11; 2,3,25; 2,3,11; 1,7,11; 1,7,13; 2,7,11; 2,7,13;
1,4,13; 1,4,15; 2,4,13; 2,4,15; 1,8,15; 1,8,17; 2,8,15; 2,8,17;
1,5,17; 1,5,19; 2,5,17; 2,5,19; 1,9,19; 1,9,21; 2,9,19; 2,9,21;
1,6,21; 1,6,23; 2,6,21; 2,6,23; 1,10,23; 1,10,25; 2,10,23; 2,10,25];
V8 = Rx(V8.*.8, pi/2) + [0,0,-1.3];
patch('Faces',F8, 'Vertices',V8, 'FaceColor',[255,223,153]./255,...
'EdgeColor',[255,223,153]./255, 'FaceAlpha', .2)
annotation(fig,'textbox',[0,.05,1,.09], 'Color',[1 1 1], 'String','Merry Christmas Matlaber',...
'HorizontalAlignment','center', 'FontWeight','bold', 'FontSize',48,...
'FontName','Times New Roman', 'FontAngle','italic', 'FitBoxToText','off','EdgeColor','none');
%% Draw snow
sXYZ = rand(200,3).*[12,12,17] - [6,6,16];
sHdl1 = plot3(sXYZ(1:90,1),sXYZ(1:90,2),sXYZ(1:90,3), '*', 'Color',[.8,.8,.8]);
sHdl2 = plot3(sXYZ(91:200,1),sXYZ(91:200,2),sXYZ(91:200,3), '.', 'Color',[.6,.6,.6]);
for i=1:1e8
sXYZ(:,3) = sXYZ(:,3) - [.1.*ones(90,1); .12.*ones(110,1)];
sXYZ(sXYZ(:,3)<-16, 3) = sXYZ(sXYZ(:,3) < -16, 3) + 17.5;
sHdl1.ZData = sXYZ(1:90,3); sHdl2.ZData = sXYZ(91:200,3);
view([i,30]); drawnow; pause(.05)
end
end

I wish all MATLABers a Merry Christmas in advance!
I have a problem with the movement of a pawn by two fields in its first move does anyone have a suggestion for a solution
function chess_game()
% Funkcja główna inicjalizująca grę w szachy
% Inicjalizacja stanu gry
gameState = struct();
gameState.board = initialize_board();
gameState.currentPlayer = 'white';
gameState.selectedPiece = [];
% Utworzenie GUI
fig = figure('Name', 'Gra w Szachy', 'NumberTitle', 'off', 'MenuBar', 'none', 'UserData', gameState);
ax = axes('Parent', fig, 'Position', [0 0 1 1], 'XTick', [], 'YTick', []);
axis(ax, [0 8 0 8]);
hold on;
% Wyświetlenie planszy
draw_board(ax, gameState.board);
% Obsługa kliknięcia myszy
set(fig, 'WindowButtonDownFcn', @(src, event)on_click(ax, src));
end
function board = initialize_board()
% Inicjalizuje planszę z ustawieniem początkowym figur
board = {
'R', 'N', 'B', 'Q', 'K', 'B', 'N', 'R';
'P', 'P', 'P', 'P', 'P', 'P', 'P', 'P';
'', '', '', '', '', '', '', '';
'', '', '', '', '', '', '', '';
'', '', '', '', '', '', '', '';
'', '', '', '', '', '', '', '';
'p', 'p', 'p', 'p', 'p', 'p', 'p', 'p';
'r', 'n', 'b', 'q', 'k', 'b', 'n', 'r';
};
end
function draw_board(~, board)
% Rysuje szachownicę i figury
colors = [1 1 1; 0.8 0.8 0.8];
for row = 1:8
for col = 1:8
% Rysowanie pól
rectColor = colors(mod(row + col, 2) + 1, :);
rectangle('Position', [col-1, 8-row, 1, 1], 'FaceColor', rectColor, 'EdgeColor', 'k');
% Rysowanie figur
piece = board{row, col};
if ~isempty(piece)
text(col-0.5, 8-row+0.5, piece, 'HorizontalAlignment', 'center', ...
'FontSize', 20, 'FontWeight', 'bold');
end
end
end
end
function on_click(ax, fig)
% Funkcja obsługująca kliknięcia myszy
pos = get(ax, 'CurrentPoint');
x = floor(pos(1,1)) + 1; % Zaokrąglij współrzędne w poziomie i dopasuj do indeksów
y = 8 - floor(pos(1,2)); % Dopasuj współrzędne w pionie (odwrócenie osi Y)
% Pobranie stanu gry z figury
gameState = get(fig, 'UserData');
if x >= 1 && x <= 8 && y >= 1 && y <= 8
disp(['Kliknięto na pole: (', num2str(x), ', ', num2str(y), ')']);
if isempty(gameState.selectedPiece)
% Wybór figury
piece = gameState.board{y, x};
if ~isempty(piece)
if (strcmp(gameState.currentPlayer, 'white') && any(ismember(piece, 'RNBQKP'))) || ...
(strcmp(gameState.currentPlayer, 'black') && any(ismember(piece, 'rnbqkp')))
gameState.selectedPiece = [y, x];
disp(['Wybrano figurę: ', piece, ' na pozycji (', num2str(x), ', ', num2str(y), ')']);
else
disp('Nie możesz wybrać tej figury.');
end
else
disp('Nie wybrano figury.');
end
else
% Sprawdzenie, czy kliknięto ponownie na wybraną figurę
if isequal(gameState.selectedPiece, [y, x])
disp('Anulowano wybór figury.');
gameState.selectedPiece = [];
else
% Ruch figury
[sy, sx] = deal(gameState.selectedPiece(1), gameState.selectedPiece(2));
piece = gameState.board{sy, sx};
if is_valid_move(gameState.board, piece, [sy, sx], [y, x], gameState.currentPlayer)
% Wykonanie ruchu
gameState.board{sy, sx} = ''; % Usuwamy figurę z poprzedniego pola
gameState.board{y, x} = piece; % Umieszczamy figurę na nowym polu
gameState.selectedPiece = [];
% Przełącz gracza
gameState.currentPlayer = switch_player(gameState.currentPlayer);
% Odśwież planszę
cla(ax);
draw_board(ax, gameState.board);
else
disp('Ruch niezgodny z zasadami.');
end
end
end
% Zaktualizowanie stanu gry w figurze
set(fig, 'UserData', gameState);
end
end
function valid = is_valid_move(board, piece, from, to, currentPlayer)
% Funkcja sprawdzająca, czy ruch jest poprawny
[sy, sx] = deal(from(1), from(2));
[dy, dx] = deal(to(1), to(2));
dy_diff = dy - sy;
dx_diff = abs(dx - sx);
targetPiece = board{dy, dx};
% Sprawdzenie, czy ruch jest w granicach planszy
if dx < 1 || dx > 8 || dy < 1 || dy > 8
valid = false;
return;
end
% Nie można zbijać swoich figur
if ~isempty(targetPiece) && ...
((strcmp(currentPlayer, 'white') && ismember(targetPiece, 'RNBQKP')) || ...
(strcmp(currentPlayer, 'black') && ismember(targetPiece, 'rnbqkp')))
valid = false;
return;
end
% Zasady ruchu dla każdej figury
switch lower(piece)
case 'p' % Pion
direction = strcmp(currentPlayer, 'white') * 2 - 1; % 1 dla białych, -1 dla czarnych
startRow = strcmp(currentPlayer, 'white') * 2 + 1; % Rząd startowy dla białych i czarnych
if isempty(targetPiece)
% Ruch o jedno pole do przodu
if dy_diff == direction && dx_diff == 0
valid = true;
% Ruch o dwa pola do przodu z pozycji startowej
elseif dy_diff == 2 * direction && dx_diff == 0 && sy == startRow
if isempty(board{sy + direction, sx}) && isempty(board{dy, dx})
valid = true;
else
valid = false;
end
else
valid = false;
end
else
% Zbijanie na ukos
valid = (dx_diff == 1) && (dy_diff == direction);
end
case 'r' % Wieża
valid = (dx_diff == 0 || dy_diff == 0) && path_is_clear(board, from, to);
case 'n' % Skoczek
valid = (dx_diff == 2 && abs(dy_diff) == 1) || (dx_diff == 1 && abs(dy_diff) == 2);
case 'b' % Goniec
valid = (dx_diff == abs(dy_diff)) && path_is_clear(board, from, to);
case 'q' % Hetman
valid = ((dx_diff == 0 || dy_diff == 0) || (dx_diff == abs(dy_diff))) && path_is_clear(board, from, to);
case 'k' % Król
valid = max(abs(dx_diff), abs(dy_diff)) == 1;
otherwise
valid = false;
end
end
function clear = path_is_clear(board, from, to)
% Sprawdza, czy ścieżka między polami jest wolna od innych figur
[sy, sx] = deal(from(1), from(2));
[dy, dx] = deal(to(1), to(2));
stepY = sign(dy - sy);
stepX = sign(dx - sx);
y = sy + stepY;
x = sx + stepX;
while y ~= dy || x ~= dx
if ~isempty(board{y, x})
clear = false;
return;
end
y = y + stepY;
x = x + stepX;
end
clear = true;
end
function nextPlayer = switch_player(currentPlayer)
% Przełącza aktywnego gracza
if strcmp(currentPlayer, 'white')
nextPlayer = 'black';
else
nextPlayer = 'white';
end
end
Speaking as someone with 31+ years of experience developing and using imshow, I want to advocate for retiring and replacing it.
The function imshow has behaviors and defaults that were appropriate for the MATLAB and computer monitors of the 1990s, but which are not the best choice for most image display situations in today's MATLAB. Also, the 31 years have not been kind to the imshow code base. It is a glitchy, hard-to-maintain monster.
My new File Exchange function, imview, illustrates the kind of changes that I think should be made. The function imview is a much better MATLAB graphics citizen and produces higher quality image display by default, and it dispenses with the whole fraught business of trying to resize the containing figure. Although this is an initial release that does not yet support all the useful options that imshow does, it does enough that I am prepared to stop using imshow in my own work.
The Image Processing Toolbox team has just introduced in R2024b a new image viewer called imageshow, but that image viewer is created in a special-purpose window. It does not satisfy the need for an image display function that works well with the axes and figure objects of the traditional MATLAB graphics system.
I have published a blog post today that describes all this in more detail. I'd be interested to hear what other people think.
Note: Yes, I know there is an Image Processing Toolbox function called imview. That one is a stub for an old toolbox capability that was removed something like 15+ years ago. The only thing the toolbox imview function does now is call error. I have just submitted a support request to MathWorks to remove this old stub.
The int function in the Symbolic Toolbox has a hold/release functionality wherein the expression can be held to delay evaluation
syms x I
eqn = I == int(x,x,'Hold',true)
which allows one to show the integral, and then use release to show the result
release(eqn)
Maybe it would be nice to be able to hold/release any symbolic expression to delay the engine from doing evaluations/simplifications that it typically does. For example:
x*(x+1)/x, sin(sym(pi)/3)

If I'm trying to show a sequence of steps to develop a result, maybe I want to explicitly keep the x/x in the first case and then say "now the x in the numerator and denominator cancel and the result is ..." followed by the release command to get the final result.
Perhaps held expressions could even be nested to show a sequence of results upon subsequent releases.
Held expressions might be subject to other limitations, like maybe they can't be fplotted.
Seems like such a capability might not be useful for problem solving, but might be useful for exposition, instruction, etc.
I want to build a neural network that takes a matrix A as input and outputs a matrix B such that a constant C=f(A,B)is maximized as much as possible.(The function f()is a custom complex computation function involving random values,probability density,matrix norms,and a series of other calculations).
I tried to directly use 1/f(A,B)or-f(A,B)as the loss function,but I encountered an error stating:"The value to be differentiated is not tracked.It must be a tracked real number dlarray scalar.Use dlgradient to track variables in the function called by dlfeval."I suspect this is likely because f(A,B)is not differentiable.
However,I've also seen people say that no matter what function it is,the dlgradient function can differentiate it.
So,I'm not sure whether it's because the function f()is too complex to be used as a loss function to calculate gradients,or if there's an issue with my code.
If I can't directly use its reciprocal or negative as the loss function,how should I go about training this neural network?Currently,I only know how to implement:providing target values and using functions like mse or huber as loss functions.