Results for
4 months ago, the new API was published to access content on the MATLAB Central community. I shared my MATLAB code to access the API at that time, but the team just released the official SDK.
MATLAB toolbox on File Exchange: https://www.mathworks.com/matlabcentral/fileexchange/135567-matlab-central-interface-for-matlab
Houman and Rameez will talk about how you can model wireless networks (5G, WLAN, Bluetooth, 802.11ax WLAN mesh, etc.) in MATLAB in the upcoming livestream. They will start with the basics such as nodes, links, topology and metrics. Then they will introduce a new free add-on library that lets you model such networks, and show you how to use it.
- Date: Thu, Oct 5, 2023
- Time: 11 am EDT (or your local time)
Bookmark this link:

Congratulations, @Adam Danz for winning the Editor's Pick badge awarded for MATLAB Answers, in recognition of your awesome solution in overlapping images in grid layout.
Thank you for going to great lengths to help a user in this thread by suggesting alternative approach to representing stack of playing cards in MATLAB, highlighting very interesting features like hggroup.
This badge recognizes awesome answers people contribute and yours was picked for providing a very detailed and helpful answer.
Thank you so much for setting a high standard for MATLAB Answers and for your ongoing contribution to the community.
MATLAB Central Team

You had a meteoric rise to in our community since you started answering questions in June 2020.
You provided 3218 answers and 926 votes. You are ranked #23 in the community. Thank you for your contribution to the community and please keep up the good track record!
MATLAB Central Team
Hi All,
I'm attempting to put a set of simbiology global sensitivity analysis plots into my thesis and I'm running into some issues with the GSA plots. Firstly, the figures are very large, it would be quite beneficial to grab a set of the plots and arrange them myself, is there any documentation on how to mess around with the '1x1 Sobol' produced by sbiosobol? Or just GSA plots in general.
The second problem is that the results appear to be relative to the most sensitive parameter in that run. Is it recommended to have a resonably sensitive 'baseline' parameter in each run? I find it difficult to compare plots when a not so sensitive parameter is being recorded as near '1' for the whole run because it's being stacked against a set of very insensitive parameters. I.e. if i have multiple sets of GSAs due to a large model, how can I easily compare results? If I could do some single run through with every parameter that would be the ideal, I imagine, but then the default plot would be half a mile off the bottom of my screen, haha! Perhaps there is a solution to the first question that might help there?
Thank you for your help,
Dan
MATLAB Onramp is a free online tutorial and it has been very popular with new MATLAB users to learn how to use it, and MathWorks have been adding more and more modules. The lastest one just dropped https://matlabacademy.mathworks.com/details/power-systems-simulation-onramp/orps
It shows you the basics of power system simulation by modeling a simple microgrid. You will learn how to simulate and measure three-phase circuits, and how to evaluate algorithms like droop control and maximum power point tracking.
Here's a screenshot from 22 years ago. Thanks for building one of the best engineering and science communities together.
cities
15%
beaches, islands, or cruises
22%
rivers, lakes, or mountains
33%
National Parks or historical sites
14%
wherever my family lives
12%
somewhere else
5%
13709 votes
Hi all,
I've translated a model from another piece of software (monolix) into simbio programmatically to make use of your very easy global sensitivity analysis system.
It looks a little something like this, for a 'single' line example:
r1 = addreaction(model,'InsI -> InsP');
r1.ReactionRate = 'InsI*kip/vi'; %- is + panc
k1 = addkineticlaw(r1, 'Unknown');
Multiplied about 20 fold, as you can see I have included my volumes within the reaction rates myself (vi). The model functions perfectly and I have corrected the outputs at the end:
[time, x, names] = sbiosimulate(model,csObj,dObj1);
x(:,1) = x(:,1)/vi;
So that they are in concentration, as needed. However, when it comes to sensitivity analysis because I have corrected them post-model it is technically incorrect, it is analysing the absolute quantities. This is quite noticible in the sensitivity to the volumes.
Is there an easy fix to this, I've had to fight dimensionality with units in the past using simbio and I'd be great if there was some way of dividing a compartment output by a volume, for example. It is a functionality that exists in monolix, so I was hopeful it might here!
Thank you for your time.
EDIT:
I think I've worked it out, I had to refactor my model to operate in concentrations, just refitting it now. Now I should just be able to use unitless compartments.
Hello, an intern working at MathWorks is finishing up his program soon and he would like to interview some MATLAB users. He is looking for people who can give their perspective on the question:
"What makes MATLAB and Simulink special in comparison to other languages?"
Ultimately he plans to condense the answers into 15-second videos or sound bites.
If people are willing to participate but want more time to talk about their experience with MATLAB, he doesn't have time left for in-depth interviews but he can find someone else to take over the project.
Please send me an email via my profle if you are interested.
Yes, in my company that I own
35%
Yes, for someone else (or Univ.)
21%
Only for free, for charities
13%
Only in my charitable foundation
5%
No, I'd just play, travel, & relax
25%
15668 votes
1
33%
2
34%
3
18%
4
5%
5
3%
6+
6%
1643 votes
I am trying to simulate model of blood lymphocyte count from a paper using Simbiology. The rate of in or out following circadian rythym is kp(t)=km + kb cos [(t-tpeak)*2pi/24] Where and how do I write the expression ? I dont think I can write in repeated assignment ?
half full.
12%
half empty.
4%
both.
12%
twice as big as it needs to be.
15%
1/2 full of beer, 1/2 full of air.
17%
What glass???
39%
6618 votes
I am currently facing a compatibility issue when attempting to load a SimBiology model created in MATLAB 2021a into MATLAB 2023a. Specifically, the code capture functionality does not seem to be working.
If anyone has encountered a similar situation or has insights on how to capture the code for a SimBiology model created in an older version of MATLAB, I would greatly appreciate your guidance. Are there any alternative methods or specific steps that can be followed to ensure successful code capture?
Thank you in advance for your time and expertise.
figure out what my old code does
18%
write code comments for future me
11%
address a code analyzer warning
3%
reflect on the skills I've gained
8%
get food on my mouse and keyboard
38%
All of the above
22%
16434 votes
Getting Started with Simulink | Tips and Tricks to Get the Most Out of Simulink
Watch live as Tianyi Zhu and Ashwin Dhawad walk through how you can get started with Simulink by modeling, simulating, and tuning a PID controller for a DC Motor. This session isn’t just for beginners; they will show you the latest and greatest tips and tricks to help you get the most out of Simulink.

MATLAB Central has been great community-based MATLAB resources, but you can now access its content programmatically via the public API, and I created a MATLAB function to take advantage of that. You can learn more here https://api.mathworks.com/community
Example:
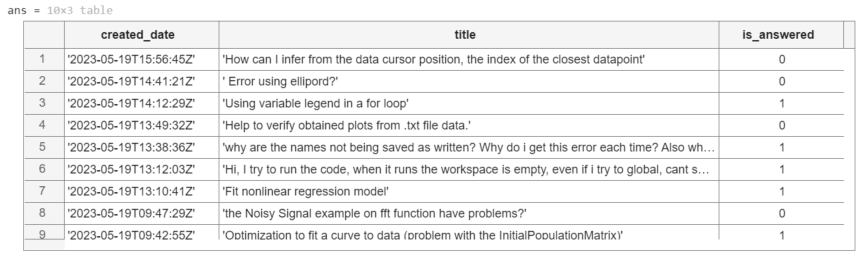
data = searchMATLABCentral("plotting",scope="matlab-answers",sort_order="created desc",created_after=datetime("2023-01-01"));
T = struct2table(data.items);
T(:,["created_date","title","is_answered"])
Output
Function
function results = searchMATLABCentral(query,options)
% SEARCGMATLABCENTRAL retrieves content of the MATLAB Central for a given
% query and returns the result as a struct.
% The function uses MathWorks RESTful API to search for content.
% The API is rate limited via IP throttling. No authentication is required.
% See API documentation for more details https://api.mathworks.com/community
%
% Input Arguments:
%
% query (string) - Required. The search query string.
% scope (string) - Optional. Specify the artifact. If not specified,
% the scope defaults to 'matlab-answers'.
% Other options include 'file-exchange','blogs','cody',
% 'community-highlights', and 'community-contests'.
% tags (string) - Optional. Specify a comma-separated list of tags.
% created_before (datetime) - Optional. Specify the last date in the results
% created_after (datetime) - Optional. Specify the first date in the results
% sort_order (string) - Optional. Speficy the order of the results.
% If not specified, it defaults to "relevance desc".
% Other options include 'created asc', 'created desc',
% 'updated asc','updated desc', 'relevance asc',
% and 'relevance desc'.
% page (integer) - Optional. Specify the page to retrieve.
% If the 'has_more' field in the result is positive,
% increment this argument to retrieve the next page.
% count (integer) - Optional. Specify the number of results as a value
% between 1 and 50; The default is 10.
%
% Output Arguments:
%
% results (struct) - Structure array containing the results of the search.
% validate input arguments
arguments
query string {mustBeNonzeroLengthText,mustBeTextScalar}
options.scope string {mustBeMember(options.scope,["matlab-answers", ...
"file-exchange","blogs","cody","community-highlights", ...
"community-contests"])} = "matlab-answers";
options.tags string {mustBeNonzeroLengthText,mustBeVector}
options.created_before (1,1) datetime
options.created_after (1,1) datetime
options.sort_order string {mustBeMember(options.sort_order,["created asc", ...
"created desc","updated asc","updated desc","relevance asc","relevance desc"])}
options.page double {mustBeInteger,mustBeGreaterThan(options.page,0)}
options.count double {mustBeInteger,mustBeInRange(options.count,1,50)}
end
% API URL and endpoint
url = "https://api.mathworks.com/community";
endpoint = "/v1/search";
% convert MATLAB datetime to the internet datetime format string
if isfield(options,"created_before")
options.created_before = string(options.created_before,"yyyy-MM-dd'T'HH:mm:ss'Z'");
end
if isfield(options,"created_after")
options.created_after = string(options.created_after,"yyyy-MM-dd'T'HH:mm:ss'Z'");
end
% convert optional inputs into a cell array of key-value pairs
keys = fieldnames(options);
vals = struct2cell(options);
params = [keys,vals].';
% call the API
try
results = webread(url+endpoint,"query",query,params{:});
catch ME
rethrow(ME)
end
end
Congratulations, @John D'Errico for winning the Editor's Pick badge awarded for MATLAB Answers, in recognition of your awesome solution in What to be chosen c so that all elements of matrix B will be a round number. B=A.c; where A is the matrix of non integers. The OP has not accepted his answer yet, but
As with other nominated answers, you provided detailed explanation with examples to show that what the OP is looking for may not be possible in some cases.
Unfortunately, you can only get this badge once - perhaps this raises a question about how this award should work. In any case, we nonetheles appreciate your ongoing effort to help other users in the community. Thnk you so much!
MATLAB Central Team
Object Detection and Tracking using Computer Vision
In this event, Matt and Megan show you how to perform one or the more difficult task in computer vision: tracking multiple objects.
They will walk through an example from the new Coursera specialization, Computer Vision for Engineering and Science. The code and video used in the example are available to those who sign up for the specialization.