Results for
Congratulations, @DGM for winning the Editor's Pick badge awarded for MATLAB Answers, in recognition of your awesome solution in searching for a line of pixels in an image.
Thank you for a very detailed explanation of your solution with a lot of references and working code, providing rationale for why you prefer to use spline.
This is a new badge we just introduced to recognize awesome answers people contribute and yours was picked for discovering a creative way to solve the problem, and made the solution clear, and reproducible. Thank you so much for setting a high standard for MATLAB Answers and for your ongoing contribution to the community.
MATLAB Central Team
I can upload an image using postman. But when I try it with my rpi the image never shows. I receive status code 202. Then the current image from postman goes blank. Tells me the post sort of worked... Does anyone have working python3 code that they can share?
Last update is Friday March 10th. It appears from this end that the WS is correctly sending data.
If I can get Arduino running again I will try recompiling the code and update the board.
Hello people,
I made a program to read a dataset from JSON and make an API request to Thingspeak (bulk_write).
After the transmission I display the response of the request, which is 202 (compliant data).
My data updates fine on my Thingspeak channel but the longitude and latitude fields do not change.
Do you have any explanation for this problem?
Here is the code:
import json
import requests
import time
apiKey = "xxxxxxxxxxxxxxxx"
channel_ID = "xxxxxxx"
url = "https://api.thingspeak.com/channels/" + channel_ID + "/bulk_update.json" # ThingSpeak server settings
message_buffer = []
message = {}
while True:
f = open("data.json", "r")
jsonContent = f.read()
objJson = json.loads(jsonContent)
message['delta_t'] = 15
message['field1'] = (objJson['GPS']['speed'])
message['field2'] = (objJson['GROVE'][3]['degNord'])
message['field3'] = (objJson['GIROUETTE']['degVent'])
message['latitude'] = str((objJson['GPS']['latitude']))
message['longitude'] = str((objJson['GPS']['longitude']))
message['elevation'] = 100
latitude = (objJson['GPS']['latitude'])
longitude = (objJson['GPS']['longitude'])
#print(latitude)
#print(longitude)
message_buffer.append(message)
bulk_data = json.dumps({'write_api_key':apiKey,'updates':message_buffer})
print(bulk_data)
message_buffer = []
request_headers = {"User-Agent":"mw.doc.bulk-update","Content-Type":"application/json","Content-Length":str(len(bulk_data))}
print(request_headers)
response = requests.post(url,headers=request_headers,data=bulk_data)
print (response) # Response 200 : Validated data / Response 429 : Too many request, please wait
print("_________________________________________")
print()
time.sleep(15)
My JSON file :
{
"GPS": {
"latitude": 48.75607,
"longitude": 2.30202,
"speed": 10.04384
},
"GROVE": [
{
"Compas": {
"x": 2.583,
"y": -4.439,
"z": 0.435
}
},
{
"Gyroscope": {
"x": 2.56433,
"y": -4.45352,
"z": 0.47237
}
},
{
"Acceleration": {
"x": 0.28,
"y": 0.01,
"z": 0.93
}
},
{
"degNord": 20.743
}
],
"GIROUETTE": {
"degVent": 30.46389
}
}
Congratulations, @John D'Errico for winning the Editor's Pick badge awarded for MATLAB Answers, in recognition of your awesome solution in Finding linear combination of two vectors such as every element is positive.
Thank you for providing a very detailed and elegant discussion about an interesting math question, both fun and instructional.
This is a new badge we just introduced to recognize awesome answers people contribute and yours was picked for discovering a creative way to solve the problem, and made the solution clear, and reproducible. Thank you so much for setting a high standard for MATLAB Answers and for your ongoing contribution to the community.
MATLAB Central Team
In our community poll ‘Which MathWorks resource is most helpful to you while learning MATLAB?’, Documentation is listed as the most helpful resource by 47% of respondents. However, it’s also worth noting that there is tons of information in the documentation. When you want to learn a topic or get quick reference, a cheat sheet would be very useful and save you time!
We’d like to share with you 9 MATLAB Cheat Sheets for Data Science and Machine Learning! These cheat sheets let you find just the right command for the most common tasks for your data science or machine learning projects.
- Automated Machine Learning (AutoML): automate difficult and iterative steps of your model building
- MATLAB Live Editor: create an executable notebook with live scripts
- Importing and Exporting Data: read and write data in many forms
- Preprocessing Time Series Data: store, merge, and clean multirate time series sensor data
- Machine Learning: discover patterns and build predictive models
- Deep Learning: create, train, and validate deep neural networks
- Text Analytics: preprocess, analyze, and model text data
- Problem-Based Optimization: solve optimization problems using a natural syntax
- Solver-Based Optimization: solve optimization problems using matrices and functions
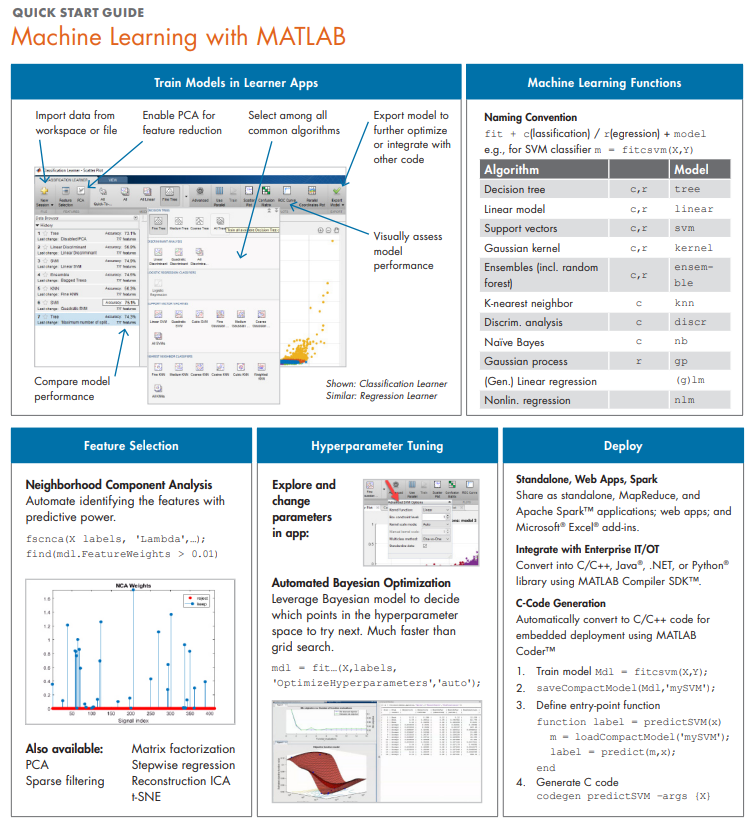
Check it out and let us know your thoughts.
Why this kind of problem is showing everytime?
Below is my code which I wish can change the color for the visualization without refresh the page.
% Set your ThingSpeak channel and API keys
channelID = 2044216;
readAPIKey = '4SVDGTR02R02PFAD';
% Initialize variables
threshold = 0;
circleRadius = 6;
circleCenterX = 30;
circleCenterY = 40;
greenColor = [0 1 0];
redColor = [1 0 0];
% Create the circle visualization
figure('Position',[100 100 200 200]);
circle = rectangle('Position',[circleCenterX - circleRadius, circleCenterY - circleRadius, circleRadius*2, circleRadius*2],...
'Curvature',[1,1],'FaceColor',greenColor);
axis square;
axis off;
% Continuously update the circle color based on the ThingSpeak channel data
while true
% Read the latest value of field 2 from your ThingSpeak channel
fieldData = thingSpeakRead(channelID, 'ReadKey', readAPIKey, 'Fields', 2, 'NumPoints', 1);
% Update the circle color based on the value of field 2
if fieldData == threshold
circle.FaceColor = redColor;
else
circle.FaceColor = greenColor;
end
end
Hi, I am currently doing a parking system that able to show red colour when the parking space is filled and change to green colour when the parking space is empty. I am using Matlab visualizations because I need the same indicator to show both two colours.
I am currently facing a problem to let the visualization change colour according to my input. Figure below show the visualization and the chart. I want the visualization able to change between green and red colour with 1 and 0 value from the chart. May I know how could I done this? Thank you.
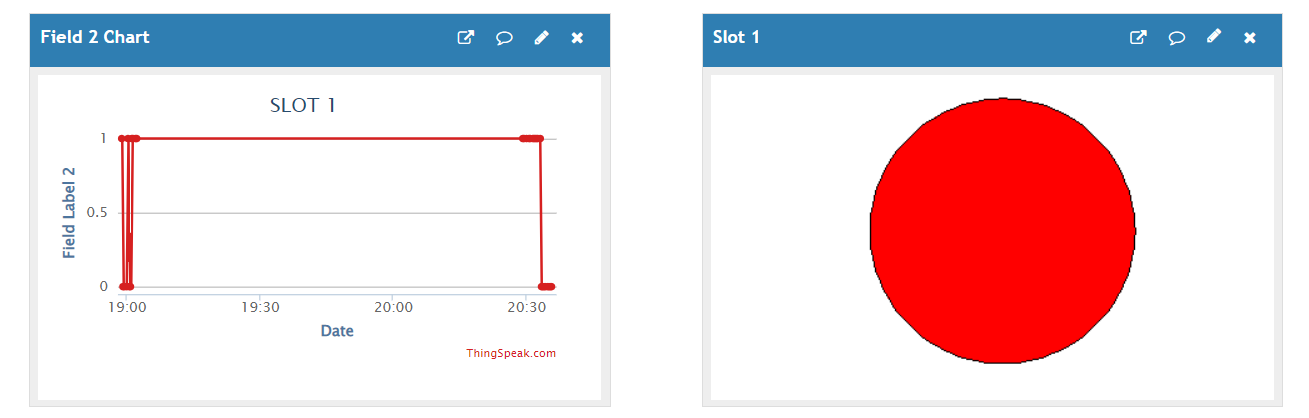
The code for the visualization are shown below:
radius = 6;
centerX = 30;
centerY = 40;
myColor=[1 0 0];
rectangle('Position',[centerX - radius, centerY - radius, radius*2, radius*2],...
'Curvature',[1,1],'FaceColor',myColor);
axis square;
axis off;
Join us for three lightening talks about awesome MATLAB projects built by our community. Each talk will be 5-10 minutes and allow everyone a chance to ask questions.
- antonio - Using "uihtml" to create custom app components
- Balrog - Creating generative art with Matlab
- xxtankmasterx - Using Matlab on the Steam Deck for mobile processing and data collection
Time: Check your local time
Contact me if you have a talk for our next event!

Hello,
i want to implement a Energy Storage System with a Battery and a Supercapacitor, where the Supercapacitor comes in when the Battery has a short circuit for an emergency system. How can i implement something like this ? I think the right way is to implement a function where a switch is controlled by the SOC of the two storage systems or ?
Currently the lamp indicator in my channel can only respond to one condition. How to let the lamp indicator respond to multiple conditions for example the lamp shows red colour when condition is 1 and the same lamp shows green colour when condition is 0?
Hi, I am currently studying the effects of varying switching frequency towards the inverter and motor system efficiency. I am using the three-phase converter which the gate signal is sent by a PWM generator. Inside the PWM generator block, there is switching frequency parameter. Therefore, is it possible if I can tune the value of switching frequency by making it as input and receving the signal in Matlab Simulink similar with Vabc and Vdc instead of tuning from Matlab code?
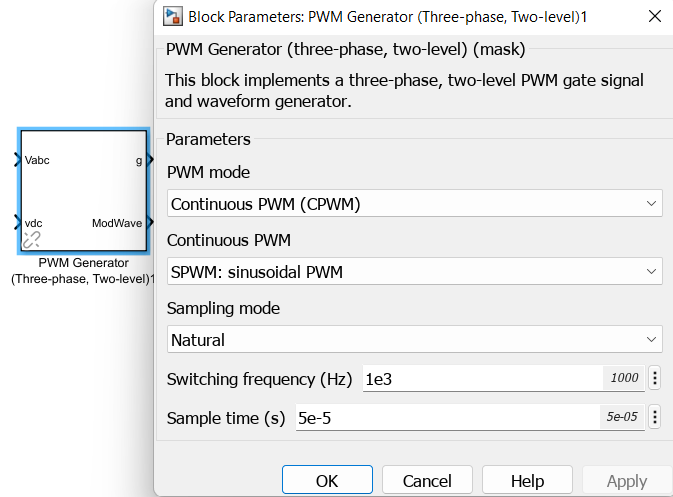
Hope to receive any comment or suggestion. Thank you.
Hello,
I want to fetch Data from the openweather API.
I want to fetch the value "day" from the API for every hour (Time Control)
But there is a Problem with indexing. I tried also "{ }" but there is also the same Error:
Dot indexing is not supported for variables of this type. Error in Wettervorhersage von openweather (line 10) temperature_Morgen = temperature.temp.day;
Does anyone have a good solution for indexing?
Code
api_url = 'https://api.openweathermap.org/data/2.5/onecall?lat=XXXX&lon=XXXXX&exclude=alerts&appid=XXXXXXXXXXXXXXX&lang=de&units=metric';
options = weboptions('ContentType','json');
%% Daten von der API abrufen
weather_data = webread(api_url,options);
% Werte für die Felder des ThingSpeak-Channels auswählen
temperature = weather_data.daily(1);
temperature_Morgen = temperature.temp.day;
humidity = weather_data.daily(1);
humidity_Morgen = humidity.humidity;
uvindex = weather_data.daily(1);
uvindex_Morgen = uvindex.uvi;
%Dieser Code berechnet die Summe von drei möglicherweise vorhandenen Regenwerten, die im Abschnitt daily{1}, daily{2} und daily{3} eines Wetterdaten-Structs enthalten sein können.
%Jeder Regenwert wird durch Überprüfung der Existenz des Felds 'rain' im jeweiligen Abschnitt geprüft. Wenn das Feld existiert, wird der Regenwert gespeichert. Andernfalls wird ein Nullwert verwendet.
%Die gespeicherten Regenwerte werden schließlich addiert und in der Variable "rain" gespeichert.
rain = 0;
for i = 1:3
if isfield(weather_data.daily(i),'rain')
rain_Next = weather_data.daily(i);
rain_Next = rain_Next.rain;
rain = rain + rain_Next;
end
end
% Daten an ThingSpeak senden
writeChannelID = XXXXXXXX; % ID des ThingSpeak-Channels
writeAPIKey = 'XXXXXXXXXXX'; % API-Schlüssel des ThingSpeak-Channels
thingSpeakWrite(writeChannelID, [temperature_Morgen, humidity_Morgen, rain, uvindex_Morgen], 'WriteKey', writeAPIKey);
Openweather json
{
{current}
{today}
{daily[{temp{day}}
{temp{day}}
{temp{day}}
{temp{day}}
{temp{day}}
]
}}
Error:
Dot indexing is not supported for variables of this type. Error in Wettervorhersage von openweather (line 10) temperature_Morgen = temperature.temp.day;
i dont send values tu my channel. my log is this
thanks all
Gretings
juan
log.
Fri Mar 3 22:37:20 2023 user.notice root: [IoT.MQTT]:MQTT Publish Case: 1
Fri Mar 3 22:37:20 2023 user.notice root: [IoT.MQTT]:MQTT Publish Parameters
Fri Mar 3 22:37:20 2023 user.notice iot_keep_alive: Internet Access OK: via wlan0-2
Fri Mar 3 22:37:20 2023 user.notice root: [IoT.MQTT]:server[-h]: mqtt3.thingspeak.com
Fri Mar 3 22:37:20 2023 user.notice root: [IoT.MQTT]:port[-p]: 1883
Fri Mar 3 22:37:20 2023 user.notice iot_keep_alive: use WAN or WiFi for internet access now
Fri Mar 3 22:37:20 2023 user.notice root: [IoT.MQTT]:user[-u]: mwa0000029370786
Fri Mar 3 22:37:20 2023 user.notice root: [IoT.MQTT]:pass[-P]: CCHFW9ZV7F0LDW7C
Fri Mar 3 22:37:20 2023 user.notice root: [IoT.MQTT]:pub_qos[-q]: 0
Fri Mar 3 22:37:20 2023 user.notice root: [IoT.MQTT]:cafile[--cafile]:
Fri Mar 3 22:37:20 2023 user.notice root: [IoT.MQTT]:cert[--cert]: /etc/iot/cert/
Fri Mar 3 22:37:20 2023 user.notice root: [IoT.MQTT]:key[--key]: /etc/iot/cert/
Fri Mar 3 22:37:20 2023 user.notice root: [IoT.MQTT]:clientID[-i]: dragino-1fb960
Fri Mar 3 22:37:20 2023 user.notice root: [IoT.MQTT]:remote_id: 2052257
Fri Mar 3 22:37:20 2023 user.notice root: [IoT.MQTT]:pub_topic[-t]: channels/2052257/publish/X7B8RVY2VP7XERPJ
Fri Mar 3 22:37:20 2023 user.notice root: [IoT.MQTT]:decoder: Not Set
Fri Mar 3 22:37:20 2023 user.notice root: [IoT.MQTT]:mqtt_data[-m]: field1=87&status=MQTTPUBLISH
Definitely not
29%
Probably not
15%
Neutral
11%
Yes, somewhat
18%
Yes, definitely
20%
Not sure
6%
4598 votes
Hello, I am trying to display my Charts in a React Native App but I can't figure out what is the URL that I should use to display it. Any ideas?
Salve, ho appena realizzato la stazione meteo con l'esp8266 ma non riesco a capire come impostare l'ora di roma (it) sul display. Qualcuno può aiutarmi? Grazie.
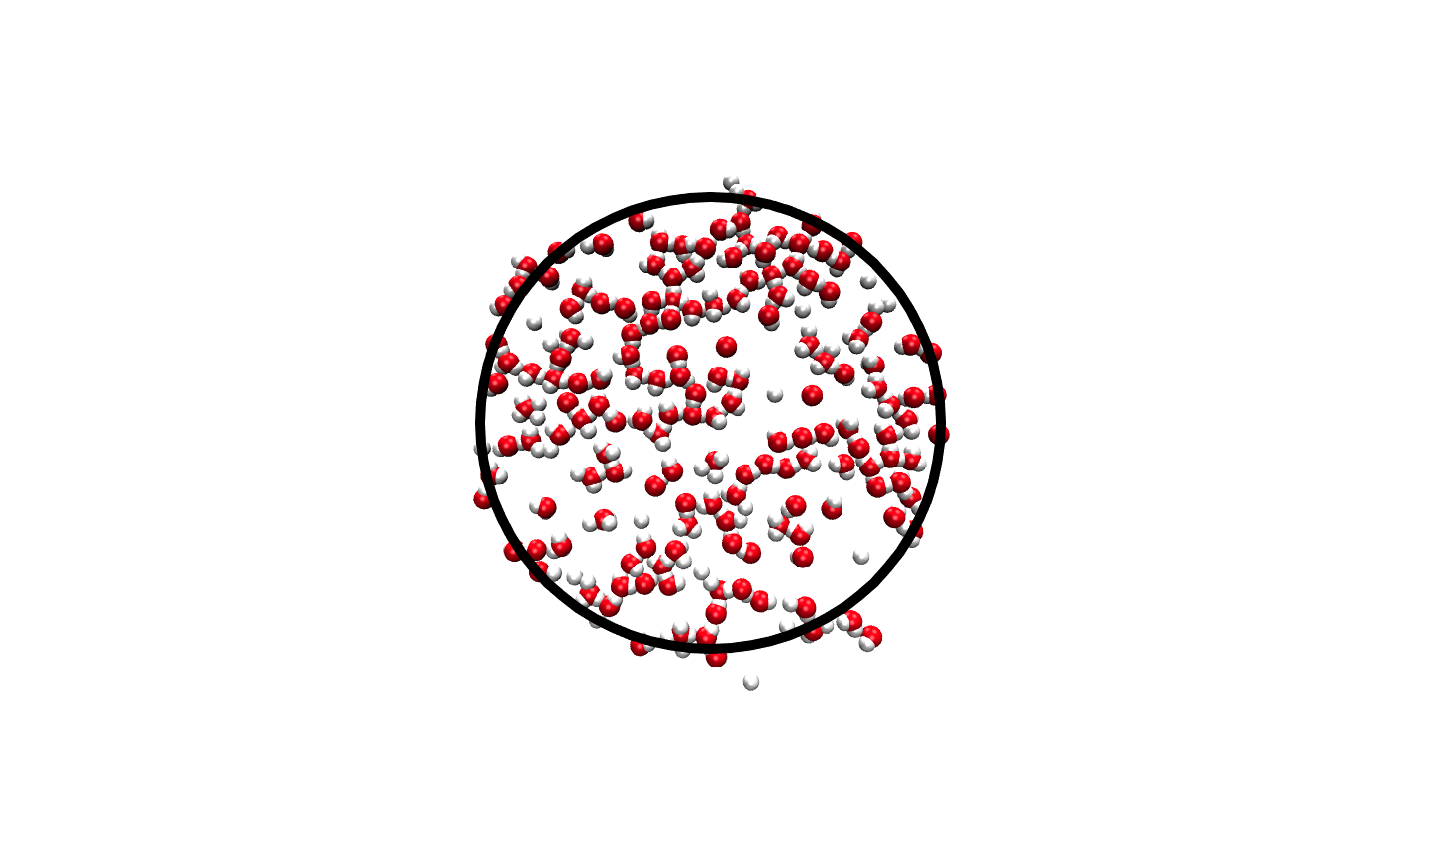
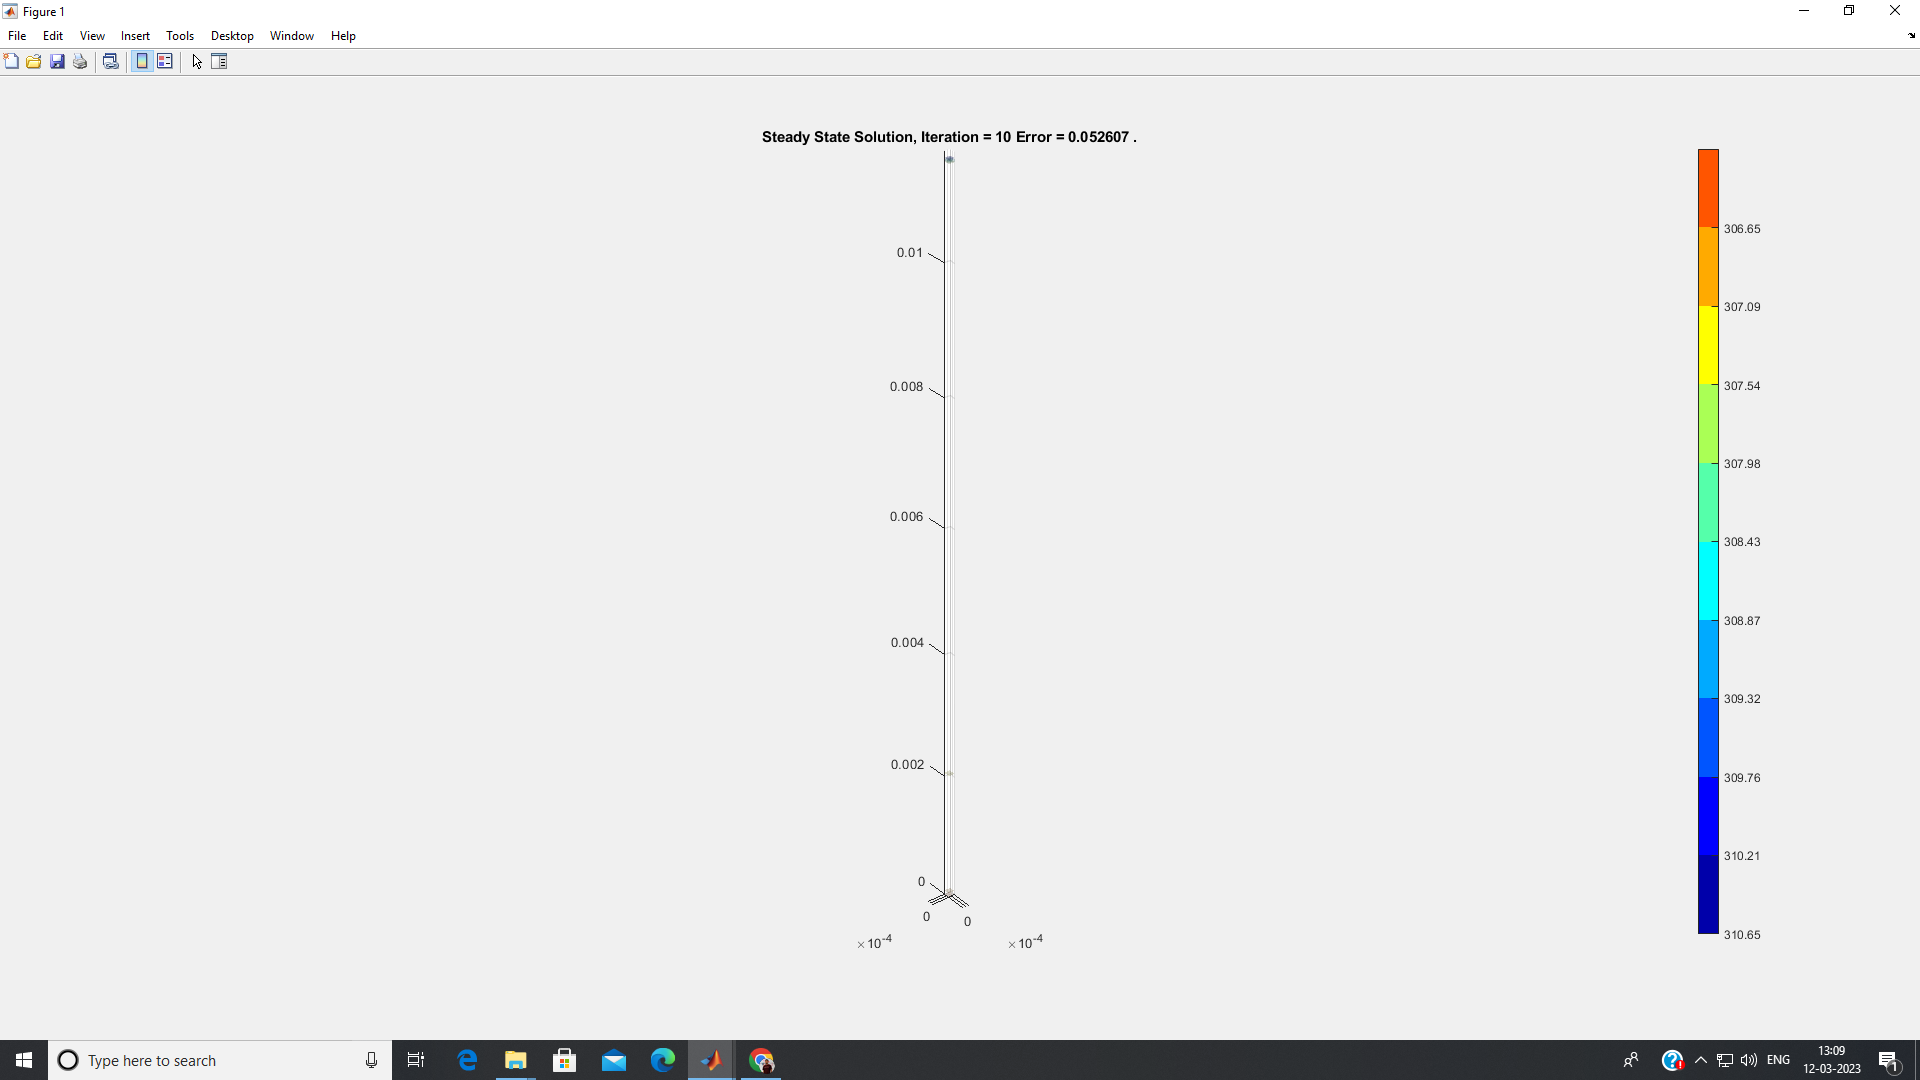
I want to fit a circle just like the black line drawn in the figure and trying to find its radius. below is the code i am writing but not getting anything significant. kindly help me how to approch this kind of problems
%%---------------------------- matlab code -----------------------------------%%
clear all
clc
% read the image
img = imread('gra.png');
% convert the image to grayscale
img_gray = rgb2gray(img);
% perform edge detection using the Canny algorithm
edge_img = edge(img_gray, 'sobel');
% perform hough transform to detect circles
[centers, radii] = imfindcircles(edge_img, [10 50000],'ObjectPolarity','bright','Sensitivity', 0.95);
% find the largest circle
[max_r, max_i] = max(radii);
max_center = centers(max_i, :);
% plot the results
figure;
imshow(img);
hold on;
viscircles(max_center, max_r, 'EdgeColor', 'b');
Need some guidance on how to model the mutual inductance model from Simscape. The secondary side does not receive the voltage.