Results for
What's your way?

Mari is helping Dad work.

Today, he got dressed for work to design some new dog toy-making algorithms. #nationalpetday

Transforming my furry friend into a grayscale masterpiece with MATLAB! 🐾 #MATLABPetsDay ✌️


This is Stella while waiting to see if the code works...

Join us for a hands-on workshop focussing on Global Sensitivity Analysis (GSA) for QSP using SimBiology. This complimentary session aims to give you theoretical background and hands-on experience with GSA methods.
🗓️ Event Details: June 25, 1-5pm CEST @PAGE 2024, Rome
🔖 Registration: Free, but space is limited. Early registration is recommended to ensure your place in this workshop.
For more details and to register, please visit https://www.mathworks.com/company/events/seminars/global-sensitivity-analysis-with-simbiology-4361208.html
Hi All,
I'm trying to produce some nice figures from the graphical user interface and have a set of local sensitivity analyses that I'd like to combine.
I have two inputs that vary the sensitivies of my system and would like to plot them on top of each other like:
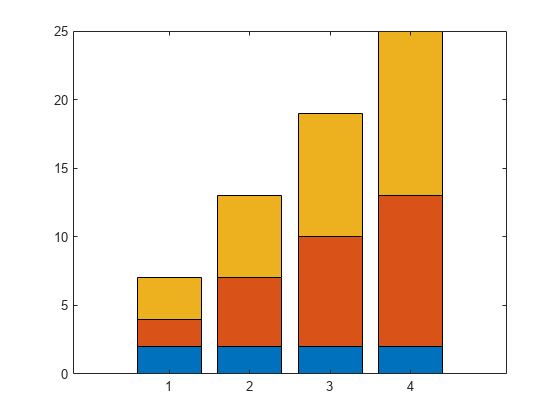
Is there either a way to do this natively in simbiology (when you try and use 'keep results from each run' it plots them both as a time series) or to export the sensitivity data to the normal matlab programatic UI where I can combine them by hand?
Thank you for your help!
In one line of MATLAB code, compute how far you can see at the seashore. In otherwords, how far away is the horizon from your eyes? You can assume you know your height and the diameter or radius of the earth.
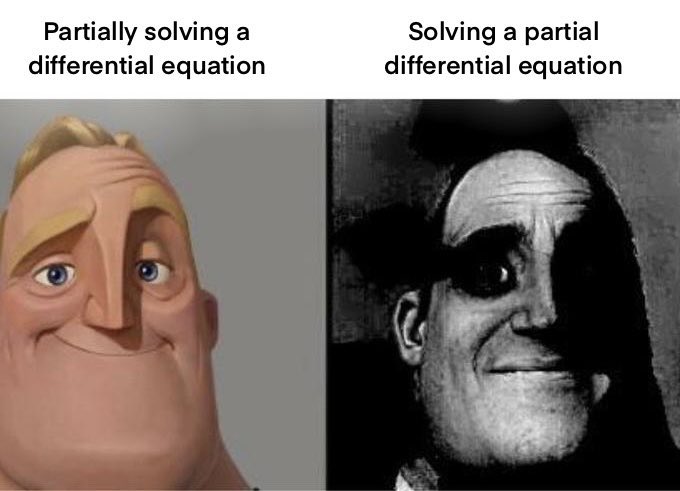
Keep calm and study PDEs
Me at the beginning of every meeting

A bit late. Compliments to Chris for sharing.
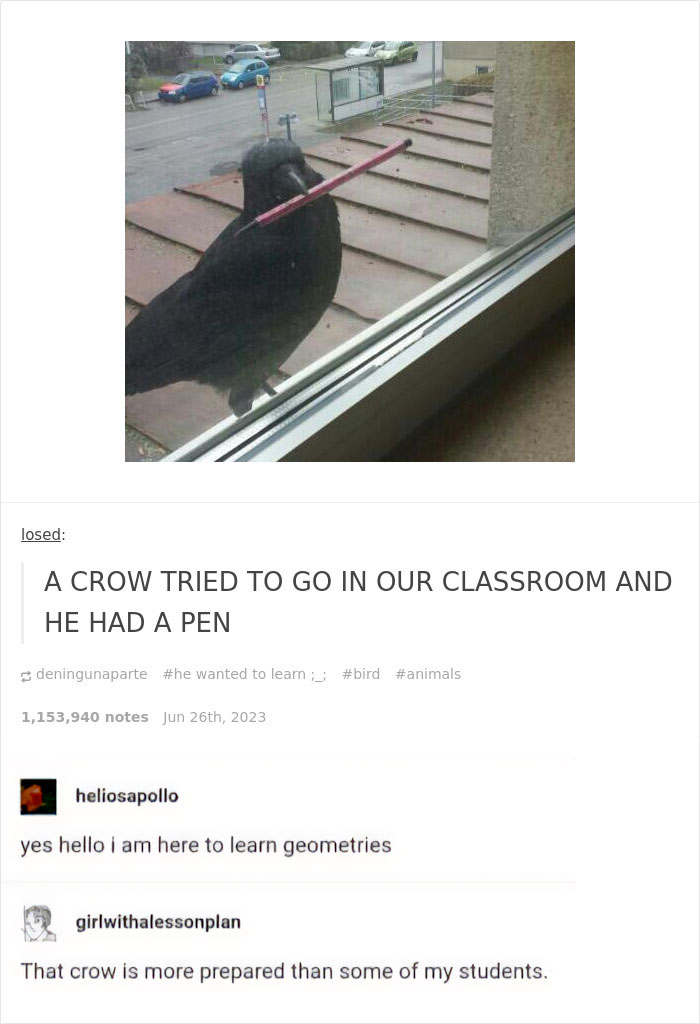
can you relate?
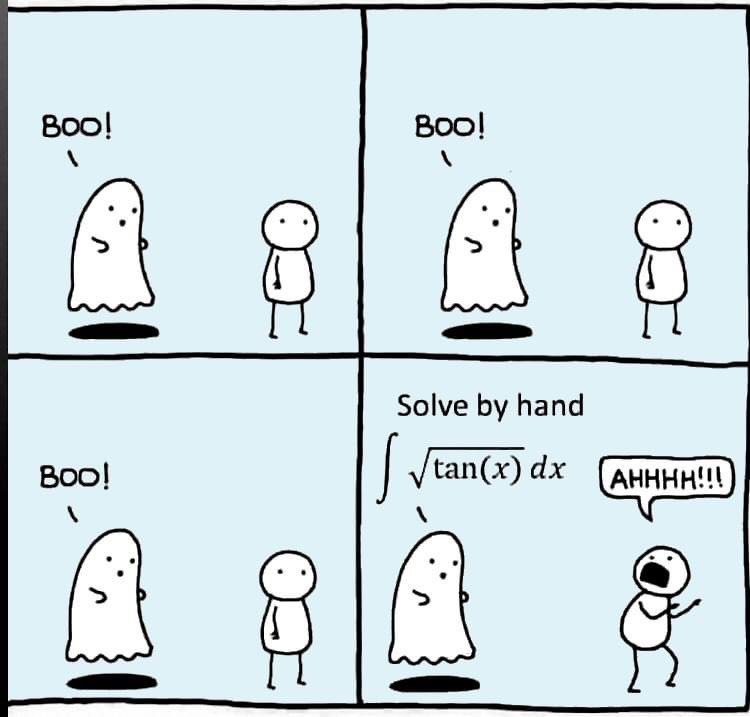
Can you solve it?
Happy year of the dragon.
Greetings to all MATLAB users,
Although the MATLAB Flipbook contest has concluded, the pursuit of ‘learning while having fun’ continues. I would like to take this opportunity to highlight some recent insightful technical articles from a standout contest participant – Zhaoxu Liu / slandarer.
Zhaoxu has contributed eight informative articles to both the Tips & Tricks and Fun channels in our new Discussions area. His articles offer practical advice on topics such as customizing legends, constructing chord charts, and adding color to axes. Additionally, he has shared engaging content, like using MATLAB to create an interactive dragon that follows your mouse cursor, a nod to the upcoming Year of the Dragon in 2024!
I invite you to explore these articles for both enjoyment and education, and I hope you'll find new techniques to incorporate into your work.
Our community is full of individuals skilled in MATLAB, and we're always eager to learn from one another. Who would you like to see featured next? Or perhaps you have some tips & tricks of your own to contribute. Remember, sharing knowledge is a collaborative effort, as Confucius wisely stated, 'When I walk along with two others, they may serve me as my teachers.'
Let's maintain our commitment to a continuous learning journey. This could be the perfect warm-up for the upcoming 2024 contest.

Can you see them?
I have been procrastinating on schoolwork by looking at all the amazing designs created in the last MATLAB Flipbook Mini Hack! They are just amazing. The voting is over but what are y'all's personal favorites? Mine is the flapping butterfly, it is for sure a creation I plan to share with others in the future!
Hi All,
I'm trying to plot my observables in the analyzer and running into far more problems than expected. I have two species in my model that are invovled, blood.Insulin (pM) and blood.Glucose (mM), all I want to do is plot the ratio of these two (blood.Insulin/blood.Glucose (dimensionless)) along with my other species in Model Simulation, to compare it to the same ratio from my data.
First, there doesn't seem to be a way to directly add an observable to the logged states in 'Simulate Model', so I've tried to used 'Calculate Observable' based on the data from my last run (IVGTT.LastRun.results) but it says that units are required when unit conversion is enabled, but it should be dimensionless!
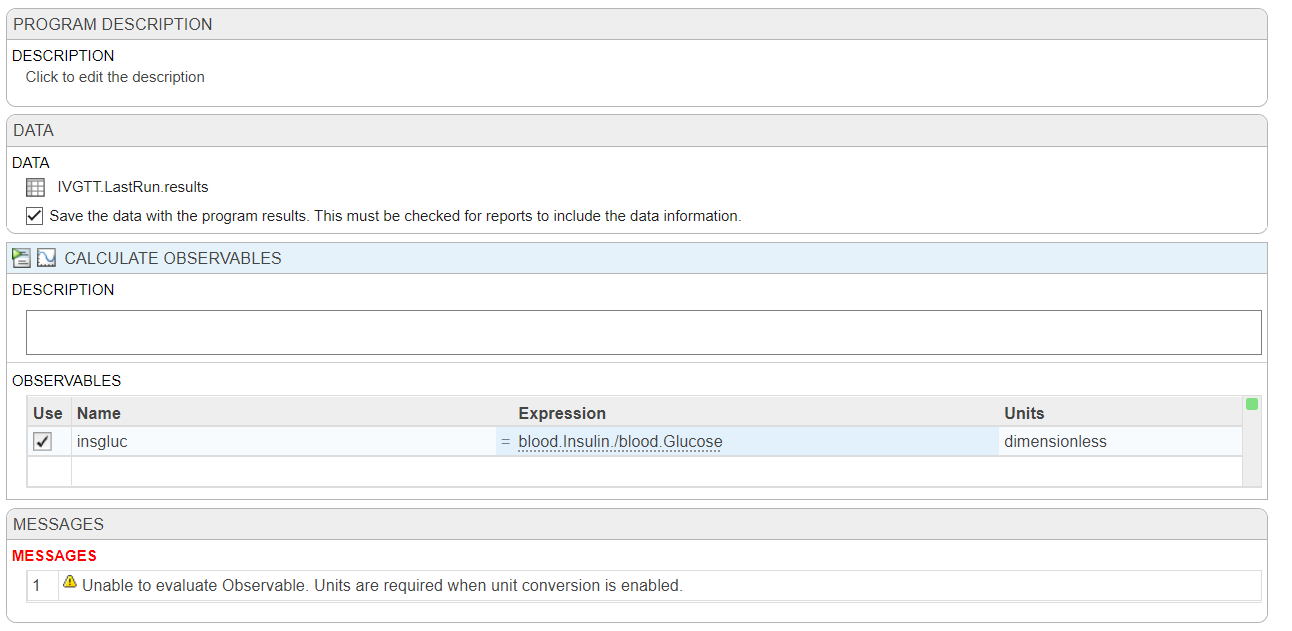
My next idea would be to make a non-constant parameter with a repeated assignment, but I feel like I should be able to do this without resorting to that?
Any help or ideas would be appreciated. Thank you, best regards,
Dan
One of my colleauges, Michio, recently posted an implementation of Pong Wars in MATLAB
- Here's the code on GitHub.https://lnkd.in/gZG-AsFX
- If you want to open with MATLAB Online, click here https://lnkd.in/gahrTMW5
- He saw this first here: https://lnkd.in/gu_Z-Pks
Making me wonder about variations. What might the resulting patterns look with differing numbers of balls? Different physics etc?
I based my model construction on this PBPK model: PBPK by Armin Sepp. While this is a very convenient script for building a PBPK two-pore model, it's very incovenient for my application to have the species Units defined in molarity. Is there a convenient way to organically switch this model from molarity to grams (or any weight unit)?