Results for
Hello, I am a student and I am working on a neural network for a line follower car and I would like you to recommend a tutorial to implement it in simulink.
The title is resonably non-descript, but I can explain it easily:
Say I have an initial Emax model:
v = emax1*[G]^n1/(ec501^n1+[G]^n1)
And I want to place v inside of a second Emax model:
y = emax2*v^n2/(ex502^n2+v^n2)
Currently, I have the full function of v inside y, twice, it's very long and whilst I only need to get it correct once, for readability in the future I'd rather have it in form #2. I've played around with non-constant parameters but I need the steady state to be v, not the rate rule, and I haven't worked out how to make a parameter shift to a form like v, as an observation might.
Are there any recommended solutions or do I simply need to keep with having v fully expressed in y?
Thank you,
Dan
good afternoon everyone my name is Dundu lawan haruna ,i'm a final year student at the department of computer engineering ABU Zaria, Nigerian , and i wanted to do my final year project based on computer vision : project topic , designing an eye glasses to help those people with visual imparement to be able to navigate enviroment efficiently , that's why i need a support from you guys ,all advised are highly well come , thank you for your support.
Hi All,
I'm currently attempting to implement a Hodgkin-Huxley-type model of membrane potential, ideally I would like a species that represents the membrane potential as its own distinct entity, so as the reference elsewhere. I've currently established a molarity-based work around but it would be great if I could set the units for the species as millivolt, but that throws an error.
Is there an established way to do this? I imagine I'm not the first person to be trying to model a voltage-gated ion channel!
Thank you for your help.


Share your fun photos in the comments!
Here's a MATLAB class I wrote that leverages the MATLAB Central Interface for MATLAB toolbox, which in turn uses the publicy available Community API. Using this class, I've created a few Favorites that show me what's going on in MATLAB Central - without having to leave MATLAB 🙂
The class has a few convenient queries:
- Results for the last 7 days
- Results for the last 30 days
- Results for the current month
- Results for today
And supporting a bunch of different content scopes:
- All MATLAB Central
- MATLAB Answers
- Blogs
- Cody
- Contests
- File Exchange
- Exclude Answers content
The results are displayed in the command window (which worked best for me) and link to each post. Here's what that looks like for this command
>> CommunityFeed.thisMonth("app designer", CommunityFeed.Scope.ExcludeAnswers)
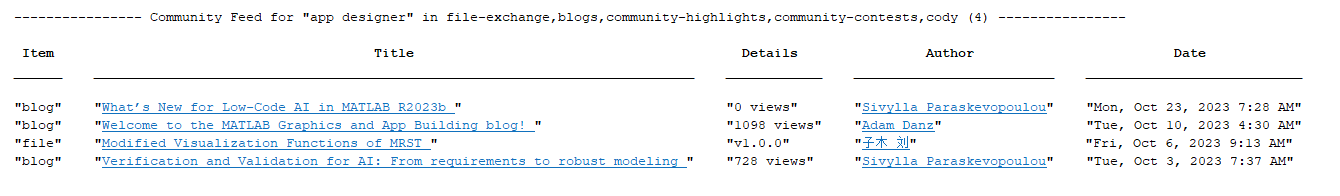
Let me know if you find this class useful and feel free to suggest changes.
Hello,
I've looked around and I haven't found anything obvious about this, but is it possible to link to species/reactions, graphically, in a non-mass transfer sense? I have areas in my model where it would conceptually make sense to be able to see that species or reactions are linked, but if I link them in the standard way it demands that it be involved in the stoichiometry.
Perhaps some kind of dotted line, or similar?
Thank you, best regards,
Dan
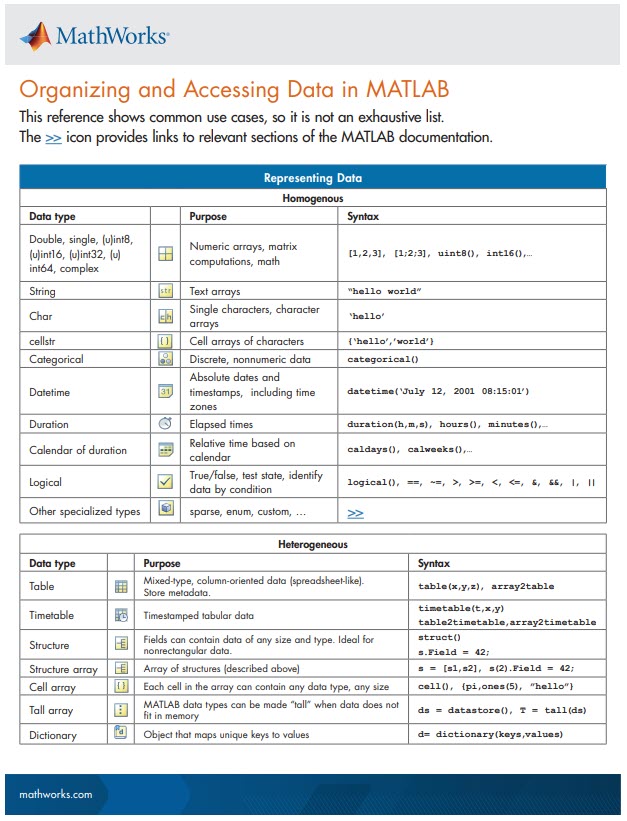
New Cheat Sheet Alert!
Level up your data organization and access skills in MATLAB with our latest cheat sheet! Download the full cheat sheet on MATLAB GitHub for Students here.
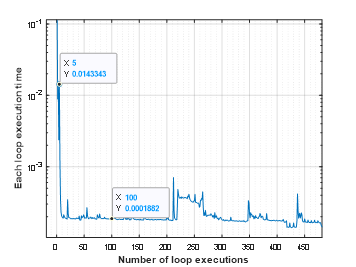
Recently, I came across a post about the JIT compiler on this Korean blog. In the post. The writer discussed the concept of the "Compile Threshold" and how it is calculated.
"The JVM accumulates the number of calls for each method called and compiles when the number exceeds a certain number. In other words, there is a standard for checking how often it is called and then deciding, 'It is time to compile.' This standard is called the compilation threshold. But what is this and why should it be used as a standard?"
The concept of the "Compile Threshold," as used above, seems to be more commonly associated with Tracing just-in-time compilation.
The writer used the simple Java code below to calculate the threshold.
for (int i = 0; i < 500; ++i) {
long startTime = System.nanoTime();
for (int j = 0; j < 1000; ++j) {
new Object();
}
long endTime = System.nanoTime();
System.out.printf("%d\t%d\n", i, endTime - startTime);
}
Since the MATLAB execution engine uses JIT compilation, I just wanted to perform the same experiment that the writer did.
I experimented using simple codes based on the code in the blog. I iterated a function 500 time using for-loop and calculated the execution time for each iteration using tic and toc. Then I plotted the execution time for each loop as blow. First five execution times are much higher than followings (10 times!) The test is very rough so I am not sure that I can conclude "MATLAB has Compile Threshold and it is 5!" but this value is actually correct ;-)
t0 = 0;
tfinal = 10;
y0 = [20;20];
timeToRun = zeros(500,1);
for i = 1:500
tStart = tic;
[preypeaks,predatorpeaks] = solvelotka(t0, tfinal, y0);
tEnd = toc(tStart);
timeToRun(i) = tEnd;
end
VS Code Extension for MATLAB was introduced back in April and has been downloaded 75K times since. Do people here use VS Code for writing MATLAB code?


Wait for Walter, the rest of us are mere users.

MATLAB Training

MATLAB Training

Mathworks tech support

Stand Back. I'm going to try MATLAB.
Embarassed by Walter Roberson

I use MATLAB.

MATLAB Reloaded

MATLAB Men