Results for
Hallo, ich bin Anfänger und beschäftige mich gerade mit dem ELV-Modulsystem mit dem man über Steckmodule eine Sensor-Datenstation aufbauen kann, die Temp und Hum misst . Die Daten gehen dann vom Modul zu TTN und werden dort dann in einer decodierten Payload ausgegeben. Mittels Webhook Integration zu ThingSpeak will ich die Daten dann in zwei Felder-Widget für Temp und Hum ausgeben/auswerten.
Der erste Teil funktioniert und die Payload wird ausgegeben. Die Daten darin sind vernünftig.
Nun habe ich in TTN eine Integration mit Webhook "ThingSpeak" erstellt und den Decoder um zwei Zeilen entsprechend erweitert in denen Die Temperatur-Variable in "field1"-Variable geschrieben wird und die Humidity in eine "field2"-Variable.
Leider wird aber nicht wie erwartet die Datenausgabe in ThingSpeak erledigt. Die Field-Widgets bleiben leer.
Kann mir jemand helfen? Was mache ich falsch?
Hello, I'm a beginner and I'm currently working with the ELV module system with which you can set up a sensor data station using plug-in modules that measures temp and hum. The data then goes from the module to TTN, where it is then output in a decoded payload. Using webhook integration with ThingSpeak, I then want to output/evaluate the data in two field widgets for Temp and Hum.
The first part works and the payload is output. The data in it is reasonable.
Now I have created an integration with the "ThingSpeak" webhook in TTN and extended the decoder by two lines in which the temperature variable is written in a "field1" variable and the humidity in a "field2" variable.
Unfortunately, the data output in ThingSpeak is not done as expected. The field widgets remain empty.
Can someone help me? What am I doing wrong? Thanks
I am using the datastreamer addin in MS Excel for collecting sensor data. No I would like to write the data one by one to a thinkspeak channel. I need a VBA code example to learn more about this.
Thank you very much.
Hallo,
ich habe an meinem Raspi den DHT22 angeschlossen und die Werte werden mir auch korrekt ausgegeben,
jedoch wird mir bei Thingspeak keine Charts angezeigt, obwohl ich Read/Write API sowie Channel im Skript angegeben habe.
Nach folgender Referenz bin ich vorgegangen:
Hat noch jemand dieses Problem?
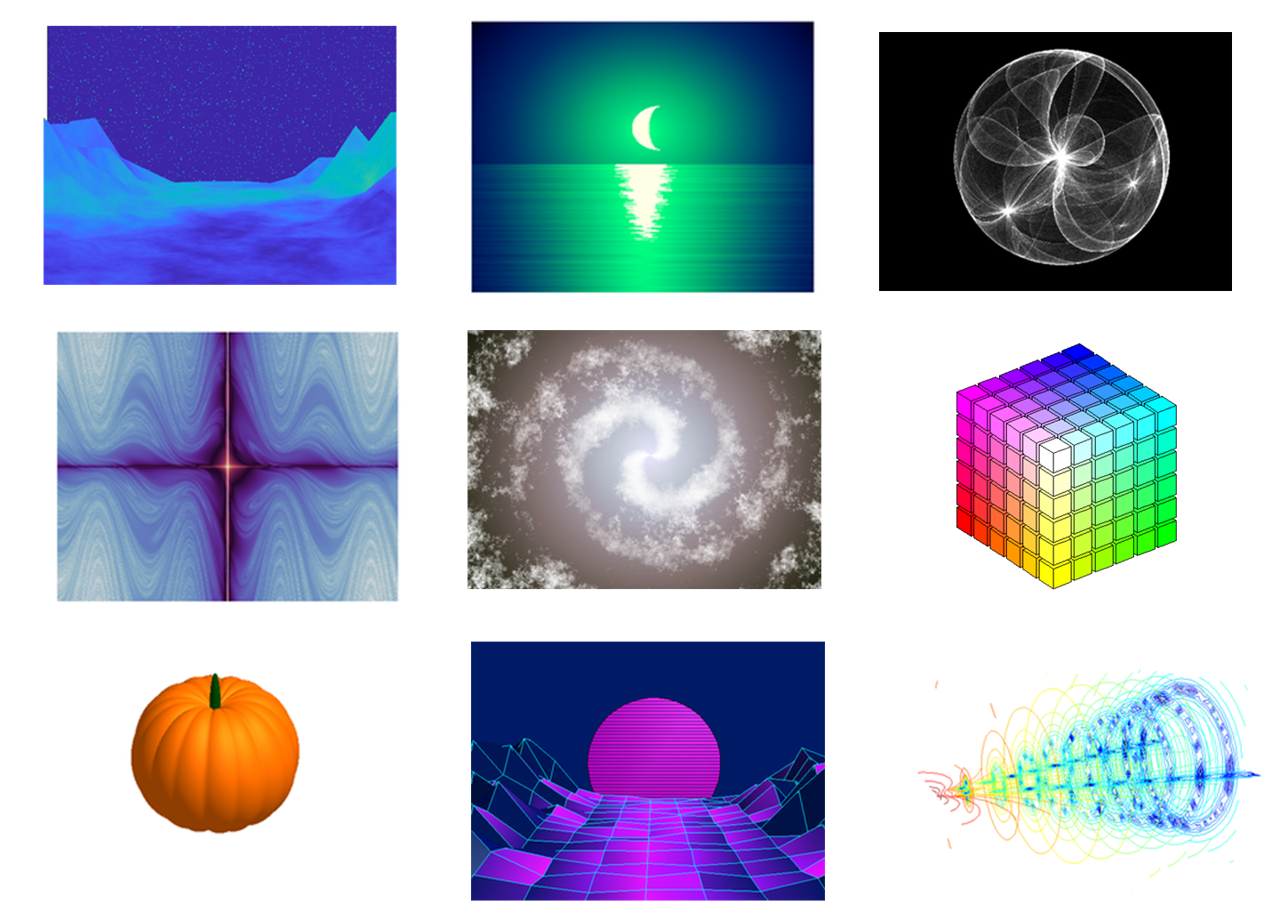
What amazing images can be created with no more than 280 characters of MATLAB code? Check out the GALLERY from the MATLAB Mini Hack 2022 contest.
Vote on your favorite MATLAB images before Oct. 30th! We will give out MathWorks T-shirt to 10 lucky voters.
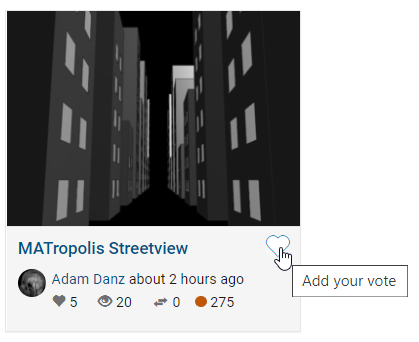
How can I vote?
You can vote for an entry by clicking on the heart icon on an entry card or the vote button on the entry detail page.
Hi every one. I am new to thingspeak. I want to share data between my siemens PLC and thingspeak channel without any use of PC. Cna anyone help me out with the ways of communication and harware needed for the application.
Note: I have created channel in thingspeak website. I need support for siemens PLC programming for data sharing.
Pls guide me.
Hi there!
There is a question, is it possible to send plot data from my channel to telegram bot as image file using ThingSpeak API or some other tools?
I have a Free subscription which I have upgraded (paid for) to Home with one unit. My subscription is still working on Free with 15 second writes. What do I have to do to be able to update at one second intervals. I have deleted three of the four Free channells.
Hi!
I'm currently doing my third-year studies in Electrical and Electronics Engineering at the South Eastern University of Sri Lanka, I tried to get MATLAB via my student mail id, but Unfortunately, I cannot get the installation software, Can anyone give me any ideas to register for this opportunity?
I receive and visualize data from my weather station. (This is my channel: https://thingspeak.com/channels/1700157).
I want to know and show the date of last time it rained.
How can i do it? The data are updated every 15 minutes.
How to send an audio signal to thingspeak to be accessed later via HTTP protocol? it's possible ? Do you have an example you can share?
New in R2022b: GridSizeChangedFcn
tiledlayout() creates a TiledChartLayout object that defines a gridded layout of axes within a figure. When using the 'flow' option, the grid size becomes dynamic and updates as axes are added or as the figure size changes. These features were introduced in R2019b and if you're still stuck on using subplot, you're missing out on several other great features of tiledlayout.
Starting in MATLAB R2022b you can define a callback function that responds to changes to the grid size in flow arrangements by setting the new gridSizeChangedFcn.
Use case
I often use a global legend to represent data across all axes within a figure. When the figure is tall and narrow, I want the legend to be horizontally oriented at the bottom of the figure but when the figure is short and wide, I prefer a vertically oriented legend on the right of the figure. By using the gridSizeChangedFcn, now I can update the legend location and orientation when the grid size changes.
Demo
gridSizeChangeFcn works like all other graphics callback functions. In this demo, I've named the gridSizeChangedFcn "updateLegendLayout", assigned by an anonymous function. The first input is the TiledChartLayout object and the second input is the event object that indicates the old and new grid sizes. The legend handle is also passed into the function. Since all of the tiles contain the same groups of data, the legend is based on data in the last tile.
As long as the legend is valid, the gridSizeChangedFcn updates the location and orientation of the legend so that when the grid is tall, the legend will be horizontal at the bottom of the figure and when the grid is wide, the legend will be vertical at the right of the figure.
Since the new grid size is available as a property in the TiledChartLayout object, I chose not to use the event argument. This way I can directly call the callback function at the end to update the legend without having to create an event.
Run this example from an m-file. Then change the width or height of the figure to demonstrate the legend adjustments.
% Prepare data
data1 = sort(randn(6))*10;
data2 = sort(randn(6))*10;
labels = ["A","B","C","D","E","F"];
groupLabels = categorical(["Control", "Test"]);
% Generate figure
fig = figure;
tcl = tiledlayout(fig, "flow", TileSpacing="compact", Padding="compact");
nTiles = height(data1);
h = gobjects(1,nTiles);
for i = 1:nTiles
ax = nexttile(tcl);
groupedData = [data1(i,:); data2(i,:)];
h = bar(ax,groupLabels, groupedData, "grouped");
title(ax,"condition " + i)
end
title(tcl,"GridSizeChangedFcn Demo")
ylabel(tcl,"Score")
legh = legend(h, labels);
title(legh,"Factors")
% Define and call the GridSizeChangeFcn
tcl.GridSizeChangedFcn = @(tclObj,event)updateLegendLayout(tclObj,event,legh);
updateLegendLayout(tcl,[],legh);
% Manually resize the vertical and horizontal dimensions of the figure
function updateLegendLayout(tclObj,~,legh)
% Evoked when the TiledChartLayout grid size changes in flow arrangements.
% tclObj - TiledChartLayout object
% event - (unused in this demo) contains old and new grid size
% legh - legend handle
if isgraphics(legh,'legend')
if tclObj.GridSize(1) > tclObj.GridSize(2)
legh.Layout.Tile = "south";
legh.Orientation = "horizontal";
else
legh.Layout.Tile = "east";
legh.Orientation = "vertical";
end
end
end
Give it a shot in MATLAB R2022b
- Replace the legend with a colorbar to update the location and orientation of the colorbar.
- Define a GridSizeChangedFcn within the loop so that it is called every time a tile is added.
- Create a figure with many tiles (~20) and dynamically set a color to each row of axes.
- Assign xlabels only to the bottom row of tiles and ylabels to only the left column of tiles.
Learn about other new features
This article is attached as a live script.
Dear Community, I using the free/community edition and I would like to know how long my data will remain accessible/stored in ThingSpeak.
I'm planning to store data for many years. Before making this a reality, I would like to be sure I have selected the correct plaform.
Thanks a lot ;)
Simulink is a block diagram environment used to design systems with multidomain models, simulate before moving to hardware, and deploy without writing code. In this livestream, Sam and Nishan will build up the basics of getting started using Simulink to build models.
Sign up here to get notification when it start streaming at 11:00 am (EDT) on Oct 13 view your timezone
Hopefully you are aware that MATLAB is built into ThingSpeak. Right now, MathWorks is hosting two contentsthat can help you learn MATLAB and then improve your IoT project.
I just set a calendar reminder to do a Cody problem each day. I can't win a prize but I can still get a virtual badge if I get a streak going.
hello :
I'm success using http send/receive between 16 bits MCU and Thingspeak.com via wifi , lan (ESP32(wifi) and LAN module )
but recently I have a new device it's BC95-B8 NBIOT device from quectel which it can only use UDP mode.
I want to connect / send /receive data with Thingspeak.com . but can't find any knowledge explain how to
Please advise
Thanks
I am working on a LoRaWAN project. My setup consists of 100 or more end-devices talking to a network server through a single gateway (private). My problem now is this.
I want the end-devices to belong to one of four groups with each group having a fixed range of spreading factors that can be used. Eg group 1 can only use SF 12, group 2 can only use SF 7, and so on. When an end device sends a join request, the network server should know which group the end device belongs to so it can assign the correct transmission parameter.
How can I achieve this? How can I encode the group that each end device belongs to into the join request for the network server, using maybe the AppEui or DevEui or AppKey or something? Any ideas?
Hello, I run a weather station that consists of several sensors. Sensor1 supplies external weather data, Sensor2 internal room data and Sensor3 particulate matter values.
Can I display the variables of all sensors in a "Weather Station" channel and display them in charts?
If so, how do I do that with ThingSpeak?
Many Thanks
Hi Fellow Users,
I am Muthuserpi From A begginer of Optics studio Please anyone help me how to add two diffeaction reflective grating and How to tilt and decenter in matlab simulation
Thanks And Regards
S.Muthuserpi
Just in case, I have my license of MATLAB. I just have this question and I didn't find any information. I wouldn't like to create another account, for this reason I prefer to ask here.
Uniform spacing and the problem of round-off error
The vector [3 4 5 6 7 8 9] is uniformly spaced with a step size of 1. So is [3 2 1 0 -1 -2] but with a step size of -1.
The vector [1 2 4 8] is not uniformly spaced.
A vector v with uniform spacing has the same finite interval or step size between consecutive elements of the vector. But sometimes round-off error poses a problem in calculating uniformity.
Take, for example, the vector produced by
format shortg
v = linspace(1,9,7)
v = 1x7
1 2.3333 3.6667 5 6.3333 7.6667 9
Linspace produces linearly spaced vectors but the intervals between elements of v, computed by diff(v), are not identical.
dv = diff(v)
dv = 1x6
1.3333 1.3333 1.3333 1.3333 1.3333 1.3333
dv == dv(1)
ans = 1×6 logical array
1 0 0 1 0 1
diff(dv)
ans = 1x5
4.4409e-16 0 -4.4409e-16 8.8818e-16 -8.8818e-16
Some extra steps are therefore necessary to set a tolerance that ignores error introduced by floating point arithmetic.
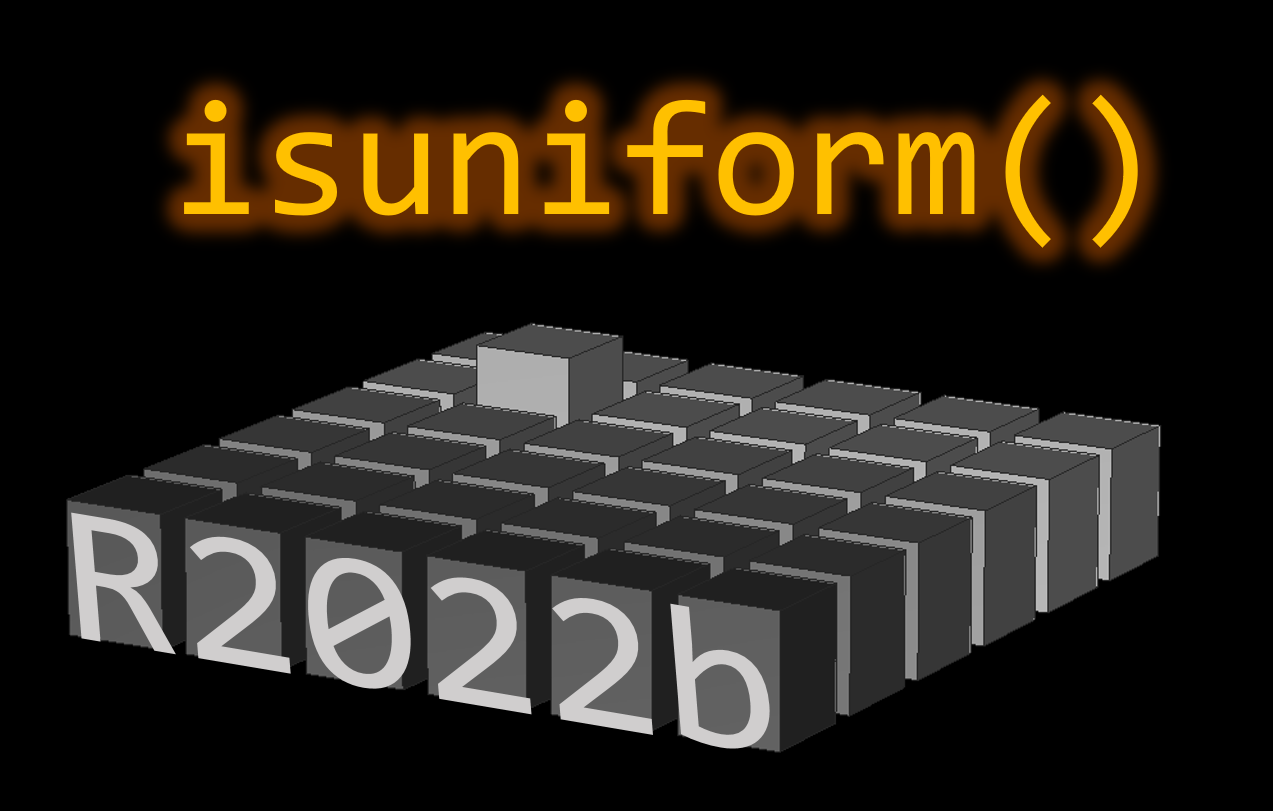
New in R2022b: isuniform
Determining uniformity of a vector became a whole lot easier in MATLAB R2022b with the new isuniform function.
isuniform returns a logical scalar indicating whether vector v is uniformly spaced within a round-off tolerance and returns the step size (or NaN if v is not uniform).
Let's look at the results for our vector v,
[tf,step] = isuniform(v)
tf = logical
1
step =
1.3333
How about non-uniformly spaced vector?
[tf,step] = isuniform(logspace(1,5,4))
tf = logical
0
step =
NaN
Give it a shot in MATLAB R2022b
- What happens when all elements of v are equal?
- Can you produce a vector with uniform spacing without using colons or linspace?
- What additional steps would be needed to use isuniform with circular data?
References
- isuniform - documentation
- Floating point numbers - documentation
- Floating point numbers - Cleve's Corner (blog)
This article is attached as a live script.