Results for
Christmas season is underway at my house:

(Sorry - the ornament is not available at the MathWorks Merch Shop -- I made it with a 3-D printer.)
I am using the ELECFREAKS IOT:bit Expansion Board with micro:bit to record data, it worked normally but in this week I tested again, and discover no data is uploaded to the channel ie.no entries in channel. The code in makecode are the same as before and the wifi is work, I cannot find the reason that cause this failure.
I am using the free option with 4 channels available. I do not have any channels listed, but when I want to create a new channel it gives me an error massage to say that I have used up my 4 channels and need to purchase units to create additional channels.
Hello
I have 3 devices (IOT board using SIM7600 module) sending one value to Thingsspeak. Have been working just fine a couple of years. However 14/11-24 I receive http error code 406 for all 3 devices.
The http get is working just fine when testing directly in the browser (https://api.thingspeak.com/update?api_key=xxxxx&field1=33), the server return the entrie number.
However, when running the same address via SIM7600 I receive - +HTTPACTION: 0,406,0
Any tips for the 406 error code?
Hello, I am wondering why I have over 12000 messages (writes)per day to a channel which I only update all 8 fields every 20 minutes. Or are these statistic timely delayed? Since testing I might have more writes, but now with my ready weather station only every 20 minutes my data will be updated. Wetterbox Channel ID: 2391212 Access: Public Can you explain this to me? Thank you for your help. Regards, Julian
It would be nice to have a function to shade between two curves. This is a common question asked on Answers and there are some File Exchange entries on it but it's such a common thing to want to do I think there should be a built in function for it. I'm thinking of something like
plotsWithShading(x1, y1, 'r-', x2, y2, 'b-', 'ShadingColor', [.7, .5, .3], 'Opacity', 0.5);
So we can specify the coordinates of the two curves, and the shading color to be used, and its opacity, and it would shade the region between the two curves where the x ranges overlap. Other options should also be accepted, like line with, line style, markers or not, etc. Perhaps all those options could be put into a structure as fields, like
plotsWithShading(x1, y1, options1, x2, y2, options2, 'ShadingColor', [.7, .5, .3], 'Opacity', 0.5);
the shading options could also (optionally) be a structure. I know it can be done with a series of other functions like patch or fill, but it's kind of tricky and not obvious as we can see from the number of questions about how to do it.
Does anyone else think this would be a convenient function to add?
In the past two years, large language models have brought us significant changes, leading to the emergence of programming tools such as GitHub Copilot, Tabnine, Kite, CodeGPT, Replit, Cursor, and many others. Most of these tools support code writing by providing auto-completion, prompts, and suggestions, and they can be easily integrated with various IDEs.
As far as I know, aside from the MATLAB-VSCode/MatGPT plugin, MATLAB lacks such AI assistant plugins for its native MATLAB-Desktop, although it can leverage other third-party plugins for intelligent programming assistance. There is hope for a native tool of this kind to be built-in.
I am considering to upgrade to HOME license. Does the HOME license provides more widgets (including a text message widget), in addition to the 4 basic widgets in the FREE version?
I know we have all been in that all-too-common situation of needing to inefficiently identify prime numbers using only a regular expression... and now Matt Parker from Standup Maths helpfully released a YouTube video entitled "How on Earth does ^.?$|^(..+?)\1+$ produce primes?" in which he explains a simple regular expression (aka Halloween incantation) which matches composite numbers:
Here is my first attempt using MATLAB and Matt Parker's example values:
fnh = @(n) isempty(regexp(repelem('*',n),'^.?$|^(..+?)\1+$','emptymatch'));
fnh(13)
fnh(15)
fnh(101)
fnh(1000)
Feel free to try/modify the incantation yourself. Happy Halloween!
Hi,
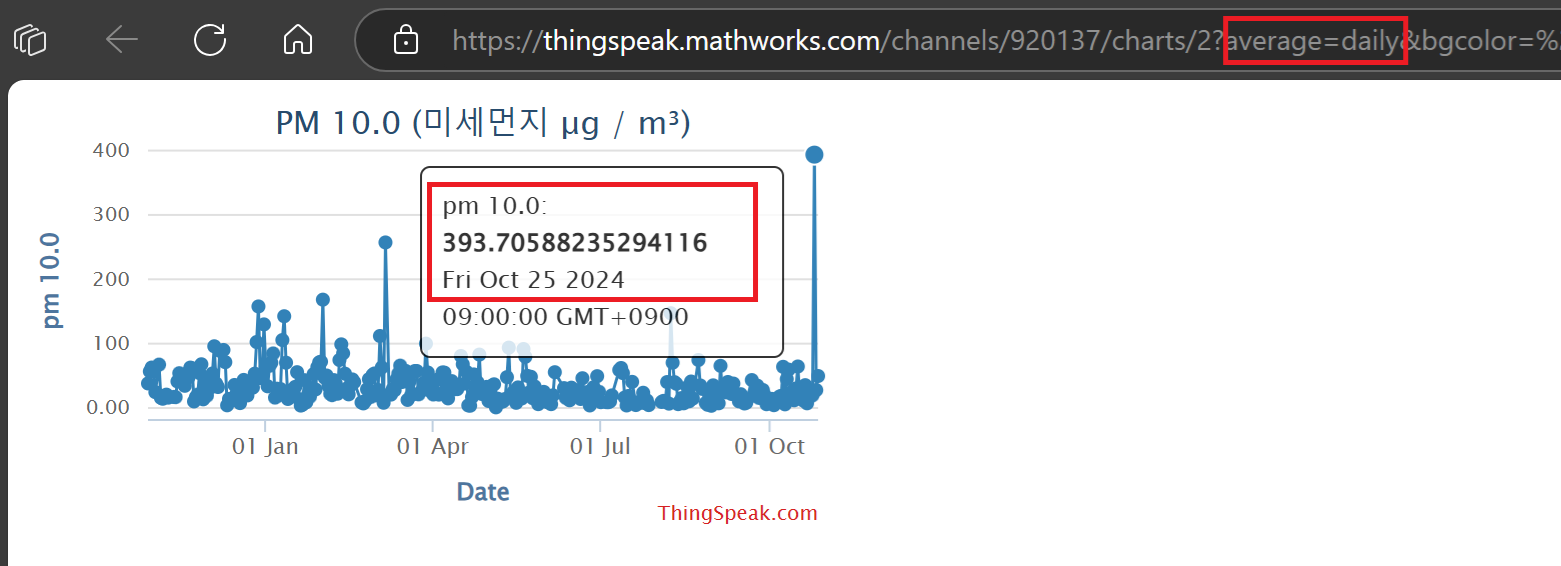
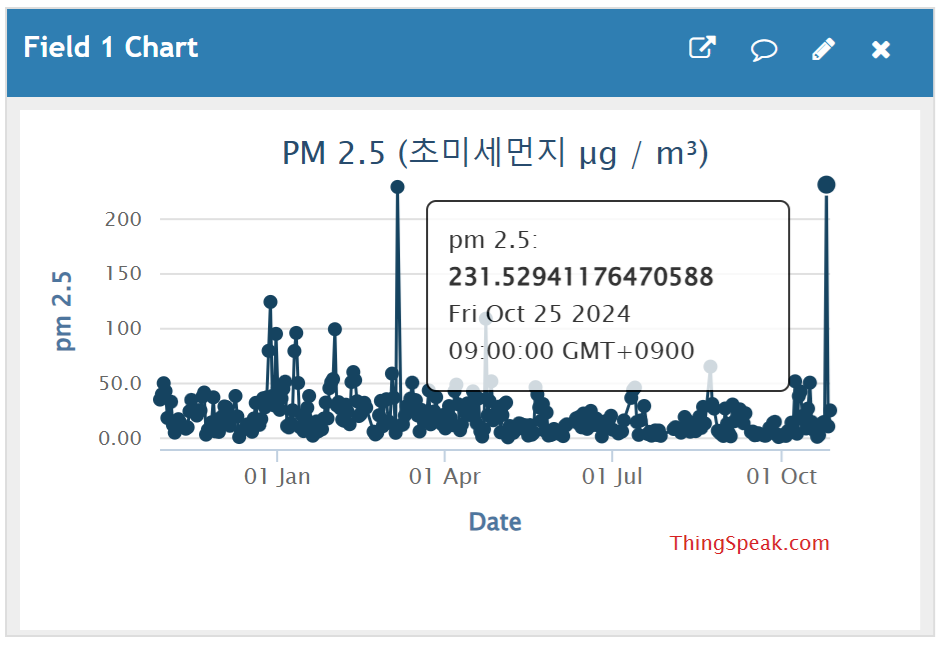
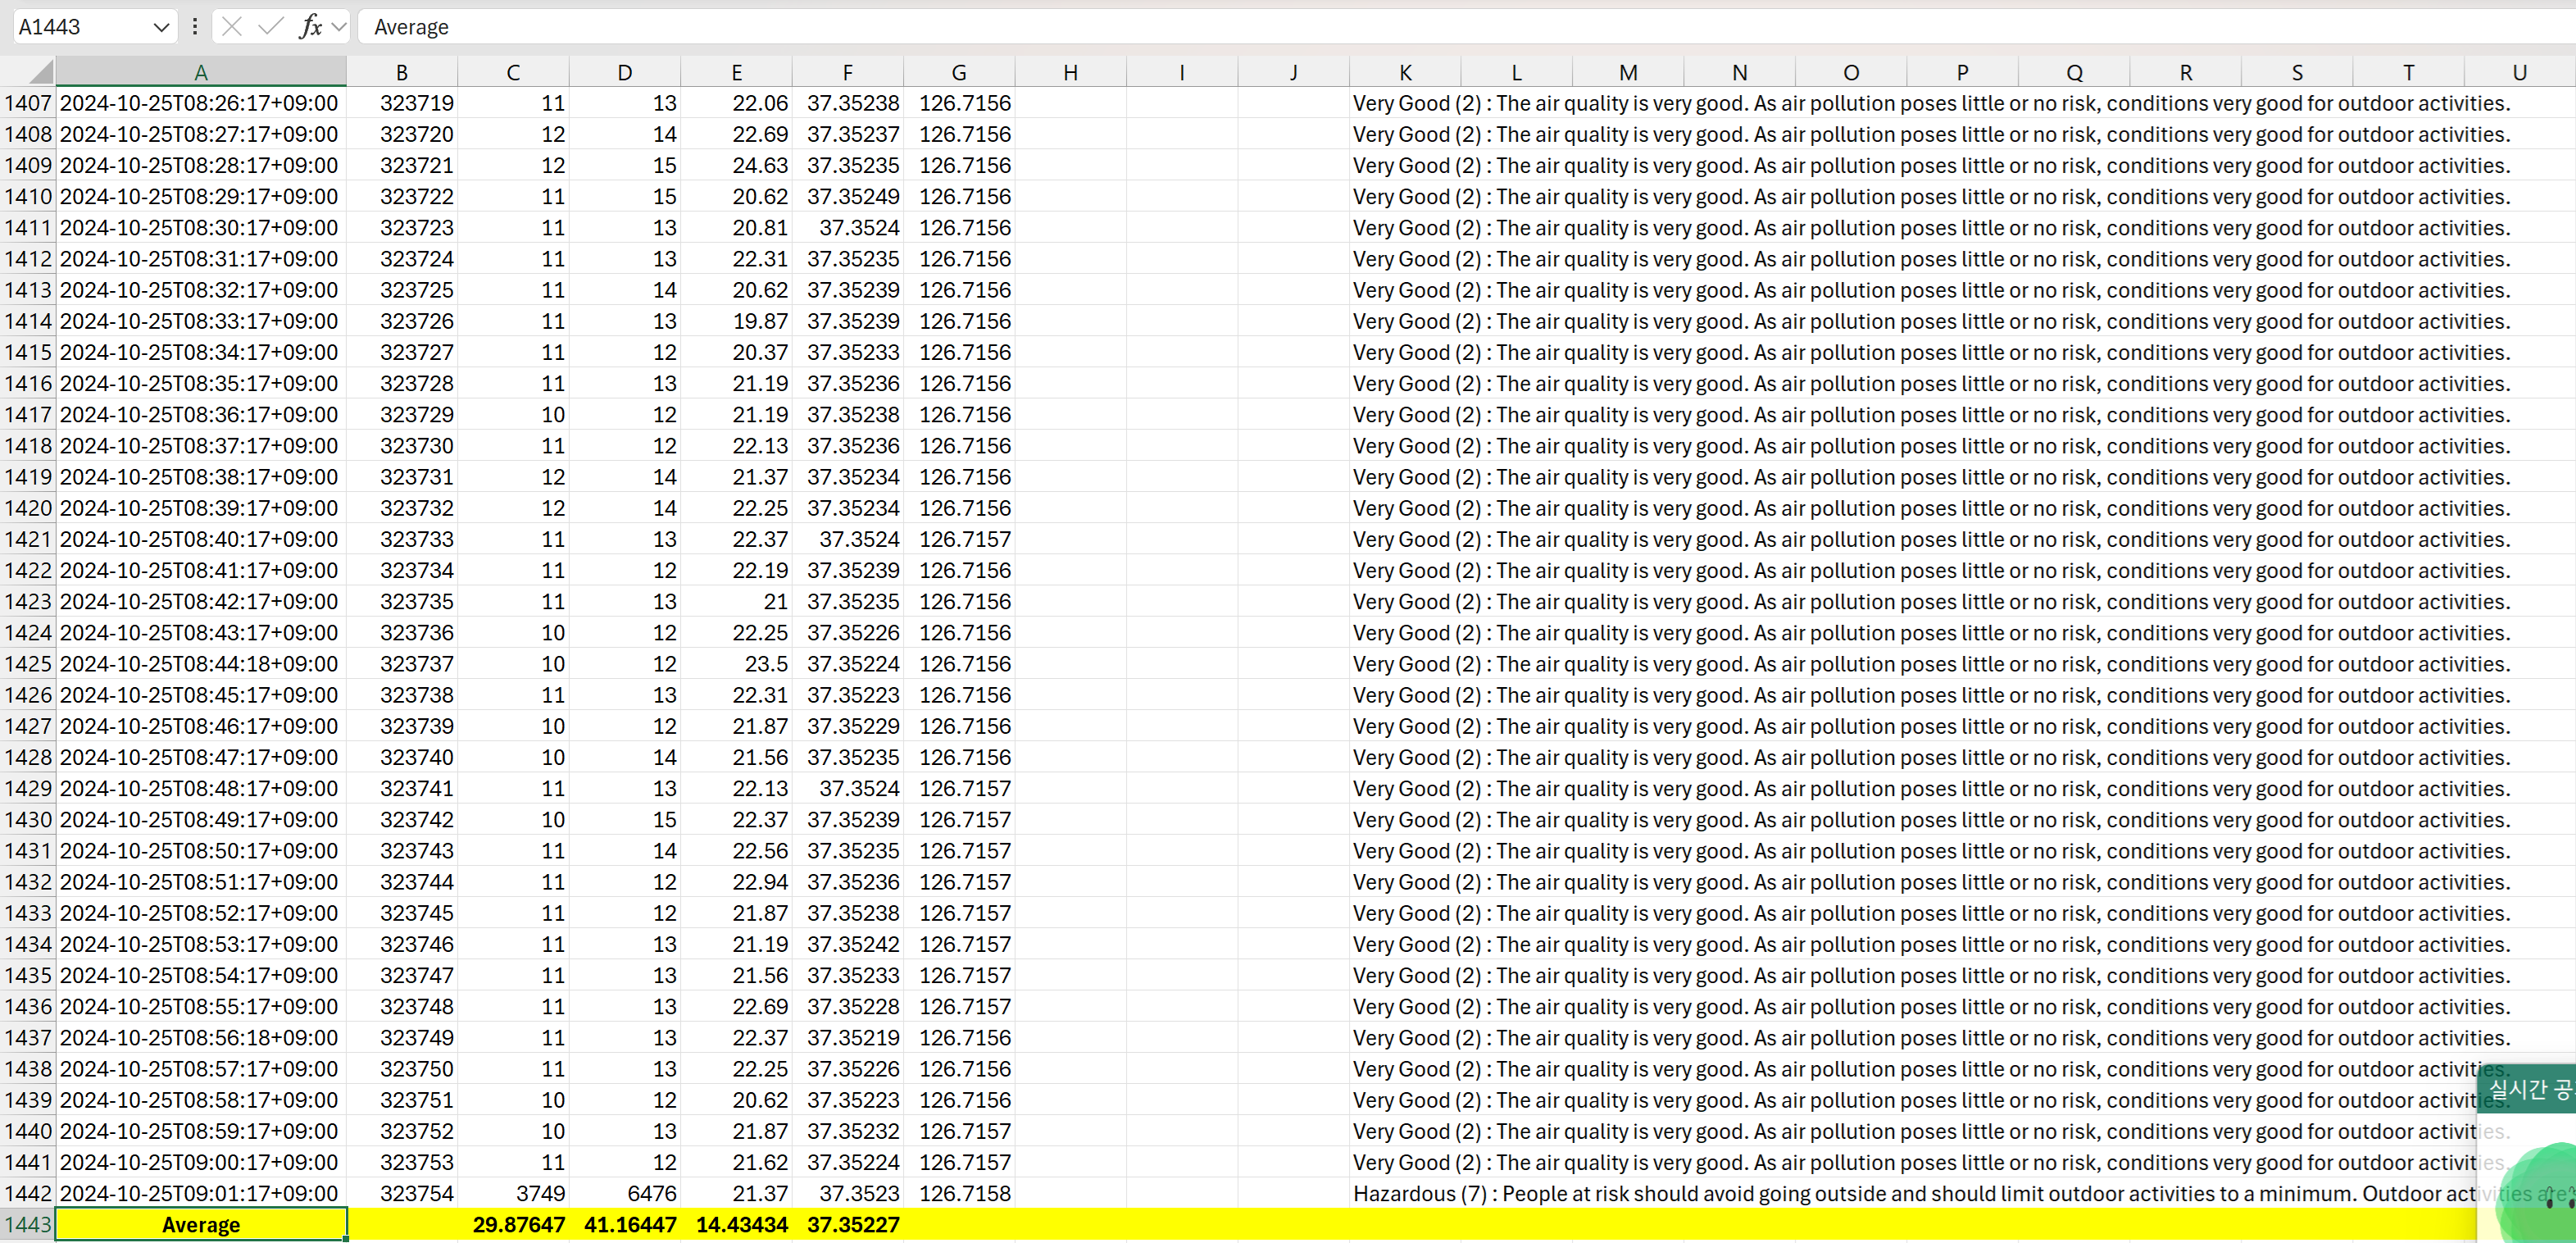
I don't know why really. Why is there seems a difference between daily average that calculated with .csv file that has exported directly from the channel.
and calculation with the ThingSpeak Daily Average API, there is a lot of difference at the moment.
Why does this happens, and how should I fix this issue?
Attached image file is daily average that has been retrived through the API,
And attached excel file is raw data from the channel.
Thank you.
My Licensed avvount has expired. When I go to my expired license page, I select "Revert To Free Account", I get the following message:
Only administrators of this license are allowed to renew units on this ThingSpeak license. If you want to continue to collect data in your ThingSpeak channels, contact your license administrator.
Aren't I the license administrator? or do I need to contact someone at Thingspeak/MathWorks?
If I go to a paint store, I can get foldout color charts/swatches for every brand of paint. I can make a selection and it will tell me the exact proportions of each of base color to add to a can of white paint. There doesn't seem to be any equivalent in MATLAB. The common word "swatch" doesn't even exist in the documentation. (?) One thinks pcolor() would be the way to go about this, but pcolor documentation is the most abstruse in all of the documentation. Thanks 1e+06 !
Hi, My data send to thingspeak is not received/updated for the last 6 hours on the charts and dials. All worked well till about 6 hour ago. I am using Node-red and the API Url: https://thingspeak.com
Any help please?
Greetings Gert
To solve issues around the browsers blocking 3p cookies and having different behavior across different browsers, the ThingSpeak website is now served from https://thingspeak.mathworks.com. There are no changes required from devices or users. Just log in and use the service as you always did.
I left the code unchanged, modifying only secrets.h.
I am using an ESP32-WROOM -32U
Connection to network succeeds, but ThingSpeak.writeFields fails every time, with HTTP error code 400.
The sketch I am really trying to use is loosely based on this example, accesses Time and Weather info with no problems, but ThingSpeak.writeFields fails with HTTP error code 301.
This is my first attempt to use ThingSpeak.
Is this example sketch still valid, or must I look elsewhere? Suggestions please.
As pointed out in Doxygen comments in code generated with Simulink Embedded Coder - MATLAB Answers - MATLAB Central (mathworks.com), it would be nice that Embedded Coder has an option to generate Doxygen-style comments for signals of buses, i.e.:
/** @brief <Signal desciption here> **/
This would allow static analysis tools to parse the comments. Please add that feature!
Hi everyone,
I'm working on a school project where I need to send sensor data from my Arduino to a Power BI REST API using ThingsHTTP. I've been trying to get this to work, but I'm running into errors like this:
{"error":{"code":"InvalidRequest","message":"Error parsing request for dataset sobe_wowvirtualserver|a7b68fb5-533b-471f-a5da-3bdd6746ee16: Conversion error on column '<pi>pH</pi>': <pi>Input string was not in a correct format.</pi>"}}
I'm a beginner with this, and I'm not sure what I'm doing wrong. What steps should I take to resolve this issue? Also, does anyone know the correct format for an HTTP request body when sending dynamic sensor data?
This is the body format I'm trying to send to Power BI:
[
{
"pH": 98.6,
"TDS": 98.6,
"turbidity": 98.6,
"temperature": 98.6
}
]
Any advice on how to construct the HTTP body with values that change over time would be greatly appreciated! Thanks in advance!"
hope this message finds you well. I am currently working on a project involving the design and numerical simulation of metalenses using Zemax and MATLAB. The design phase involves saving phase data from the Zemax simulation, which is later used in a numerical script to generate the metalens in MATLAB.
I have a MATLAB file that contains the phase data saved from Zemax, but I am unsure of the specific method or format used to extract and save the data from Zemax. The phase data I currently have in MATLAB is as follows:
- Phase matrix: 571 x 571 (double)
- X data: 571 x 1 (double)
- Y data: 571 x 1 (double)
Could you please provide guidance on:
- How this phase data was likely saved from Zemax into MATLAB?
- What steps or scripts were used to extract this information from the design, particularly the 571 x 571 phase matrix and the corresponding X and Y data?
- Any best practices or tools available in Zemax for exporting such data?
This information will help me reproduce the workflow and proceed with my analysis.
Thank you for your support. I look forward to your guidance.
Best regards,
Zaka
I went to perform an IoT for an automated plantation but the same error always occurs to me when I upload it to the mcu node, which is: Connection to ThingSpeak failed.