Results for
how to generate CA signed certificate for mqtt
I asked my question in the general forum and a few minutes later it was deleted. Perhaps this is a better place?
Rather than using my German regional forum (as I do not speak German), I want to ask questions in an international English-speaking forum. Presumably there should be an international English forum for everyone around the world, as English is the first or second language of everyone who has gone to school. Where is it?
When I embed Matlab windows into C#, I use C# to call the mouse functions such as drawline() and getpts() which are encapsulated in Matlab's dll, and then the program crashes, how can I solve this problem?
ps : The functions that I call in C# can be executed in Matlab.
ps : If I don't embed the window into C#, but just let C# call the Matlab function, it can execute the mouse control normally in the window, but once embedded into the C# window, it will crash when execute the mouse command.
I have a channel updating every 10 minutes. The last 8000 entries therefore go back to late December (around 55 days). I want to extend the range of data downloaded by setting a timescale between results, so say if I request a timescale of 20 minutes should I not be able to get data from twice as long ago? e.g.
https://api.thingspeak.com/channels/xxxxxx/fields/1.json?api_key=XXXXXXXXXXX×cale=20&start=2022-12-30%2022:00:00
No matter what timescale or averaging I use, the last 8000 entries are the only ones processed for the downloaded data, so I just get fewer results. Unless I use a timescale of 1440; then I can download results from the very first entry in 2022. A timescale of 720 or lower however will only go back 55 days.
So I see the desired result when I use a timescale of 1440, but no other timescale will work. Is this a bug?
2 x 2 행렬의 행렬식은
- 행렬의 두 row 벡터로 정의되는 평행사변형의 면적입니다.
- 물론 두 column 벡터로 정의되는 평행사변형의 면적이기도 합니다.
- 좀 더 정확히는 signed area입니다. 면적이 음수가 될 수도 있다는 뜻이죠.
- 행렬의 두 행(또는 두 열)을 맞바꾸면 행렬식의 부호도 바뀌고 면적의 부호도 바뀌어야합니다.
일반적으로 n x n 행렬의 행렬식은
- 각 row 벡터(또는 각 column 벡터)로 정의되는 N차원 공간의 평행면체(?)의 signed area입니다.
- 제대로 이해하려면 대수학의 개념을 많이 가지고 와야 하는데 자세한 설명은 생략합니다.(=저도 모른다는 뜻)
- 더 자세히 알고 싶으시면 수학하는 만화의 '넓이 이야기' 편을 추천합니다.
- 수학적인 정의를 알고 싶으시면 위키피디아를 보시면 됩니다.
- 이렇게 생겼습니다. 좀 무섭습니다.
아래 코드는...
- 2 x 2 행렬에 대해서 이것을 수식 없이 그림만으로 증명하는 과정입니다.
- gif 생성에는 ScreenToGif를 사용했습니다. (gif 만들기엔 이게 킹왕짱인듯)
Determinant of 2 x 2 matrix is...
- An area of a parallelogram defined by two row vectors.
- Of course, same one defined by two column vectors.
- Precisely, a signed area, which means area can be negative.
- If two rows (or columns) are swapped, both the sign of determinant and area change.
More generally, determinant of n x n matrix is...
- Signed area of parallelepiped defined by rows (or columns) of the matrix in n-dim space.
- For a full understanding, a lot of concepts from abstract algebra should be brought, which I will not write here. (Cuz I don't know them.)
- For a mathematical definition of determinant, visit wikipedia.

- A little scary, isn't it?
The code below is...
- A process to prove the equality of the determinant of 2 x 2 matrix and the area of parallelogram.
- ScreenToGif is used to generate gif animation (which is, to me, the easiest way to make gif).
% 두 점 (a, b), (c, d)의 좌표
a = 4;
b = 1;
c = 1;
d = 3;
% patch 색 pre-define
lightgreen = [144, 238, 144]/255;
lightblue = [169, 190, 228]/255;
lightorange = [247, 195, 160]/255;
% animation params.
anim_Nsteps = 30;
% create window
figure('WindowStyle','docked')
ax = axes;
ax.XAxisLocation = 'origin';
ax.YAxisLocation = 'origin';
ax.XTick = [];
ax.YTick = [];
hold on
ax.XLim = [-.4, a+c+1];
ax.YLim = [-.4, b+d+1];
% create ad-bc patch
area = patch([0, a, a+c, c], [0, b, b+d, d], lightgreen);
p_ab = plot(a, b, 'ko', 'MarkerFaceColor', 'k');
p_cd = plot(c, d, 'ko', 'MarkerFaceColor', 'k');
p_ab.UserData = text(a+0.1, b, '(a, b)', 'FontSize',16);
p_cd.UserData = text(c+0.1, d-0.2, '(c, d)', 'FontSize',16);
area.UserData = text((a+c)/2-0.5, (b+d)/2, 'ad-bc', 'FontSize', 18);
pause
%% Is this really ad-bc?
area.UserData.String = 'ad-bc...?';
pause
%% fade out ad-bc
fadeinout(area, 0)
area.UserData.Visible = 'off';
pause
%% fade in ad block
rect_ad = patch([0, a, a, 0], [0, 0, d, d], lightblue, 'EdgeAlpha', 0, 'FaceAlpha', 0);
uistack(rect_ad, 'bottom');
fadeinout(rect_ad, 1, t_pause=0.003)
draw_gridline(rect_ad, ["23", "34"])
rect_ad.UserData = text(mean(rect_ad.XData), mean(rect_ad.YData), 'ad', 'FontSize', 20, 'HorizontalAlignment', 'center');
pause
%% fade-in bc block
rect_bc = patch([0, c, c, 0], [0, 0, b, b], lightorange, 'EdgeAlpha', 0, 'FaceAlpha', 0);
fadeinout(rect_bc, 1, t_pause=0.0035)
draw_gridline(rect_bc, ["23", "34"])
rect_bc.UserData = text(b/2, c/2, 'bc', 'FontSize', 20, 'HorizontalAlignment', 'center');
pause
%% slide ad block
patch_slide(rect_ad, ...
[0, 0, 0, 0], [0, b, b, 0], t_pause=0.004)
draw_gridline(rect_ad, ["12", "34"])
pause
%% slide ad block
patch_slide(rect_ad, ...
[0, 0, d/(d/c-b/a), d/(d/c-b/a)],...
[0, 0, b/a*d/(d/c-b/a), b/a*d/(d/c-b/a)], t_pause=0.004)
draw_gridline(rect_ad, ["14", "23"])
pause
%% slide bc block
uistack(p_cd, 'top')
patch_slide(rect_bc, ...
[0, 0, 0, 0], [d, d, d, d], t_pause=0.004)
draw_gridline(rect_bc, "34")
pause
%% slide bc block
patch_slide(rect_bc, ...
[0, 0, a, a], [0, 0, 0, 0], t_pause=0.004)
draw_gridline(rect_bc, "23")
pause
%% slide bc block
patch_slide(rect_bc, ...
[d/(d/c-b/a), 0, 0, d/(d/c-b/a)], ...
[b/a*d/(d/c-b/a), 0, 0, b/a*d/(d/c-b/a)], t_pause=0.004)
pause
%% finalize: fade out ad, bc, and fade in ad-bc
rect_ad.UserData.Visible = 'off';
rect_bc.UserData.Visible = 'off';
fadeinout([rect_ad, rect_bc, area], [0, 0, 1])
area.UserData.String = 'ad-bc';
area.UserData.Visible = 'on';
%% functions
function fadeinout(objs, inout, options)
arguments
objs
inout % 1이면 fade-in, 0이면 fade-out
options.anim_Nsteps = 30
options.t_pause = 0.003
end
for alpha = linspace(0, 1, options.anim_Nsteps)
for i = 1:length(objs)
switch objs(i).Type
case 'patch'
objs(i).FaceAlpha = (inout(i)==1)*alpha + (inout(i)==0)*(1-alpha);
objs(i).EdgeAlpha = (inout(i)==1)*alpha + (inout(i)==0)*(1-alpha);
case 'constantline'
objs(i).Alpha = (inout(i)==1)*alpha + (inout(i)==0)*(1-alpha);
end
pause(options.t_pause)
end
end
end
function patch_slide(obj, x_dist, y_dist, options)
arguments
obj
x_dist
y_dist
options.anim_Nsteps = 30
options.t_pause = 0.003
end
dx = x_dist/options.anim_Nsteps;
dy = y_dist/options.anim_Nsteps;
for i=1:options.anim_Nsteps
obj.XData = obj.XData + dx(:);
obj.YData = obj.YData + dy(:);
obj.UserData.Position(1) = mean(obj.XData);
obj.UserData.Position(2) = mean(obj.YData);
pause(options.t_pause)
end
end
function draw_gridline(patch, where)
ax = patch.Parent;
for i=1:length(where)
v1 = str2double(where{i}(1));
v2 = str2double(where{i}(2));
x1 = patch.XData(v1);
x2 = patch.XData(v2);
y1 = patch.YData(v1);
y2 = patch.YData(v2);
if x1==x2
xline(x1, 'k--')
else
fplot(@(x) (y2-y1)/(x2-x1)*(x-x1)+y1, [ax.XLim(1), ax.XLim(2)], 'k--')
end
end
end
New to ThingsSpeak. I have a Photon 2 and vreated a webhook with simple code to send random numbers reprsented as 'temp' to a channel in ThingSpeak. All good with the code and my device shows the webhook is sending data and the events corespond to the same number of entries received in my channel. However, I do not see any visual graph of the data. What am i missing?
Hi Everyone. I am facing a problem while connecting the FMU to the buses. I have one FMU which expects 9 inputs and I did clarify the same while using bus creator. But in the end i am getting this error which i am trying to solve for couple of hours but didn't get any solution. So if any knows about the same please help me. I would give details as well if you need any other information. 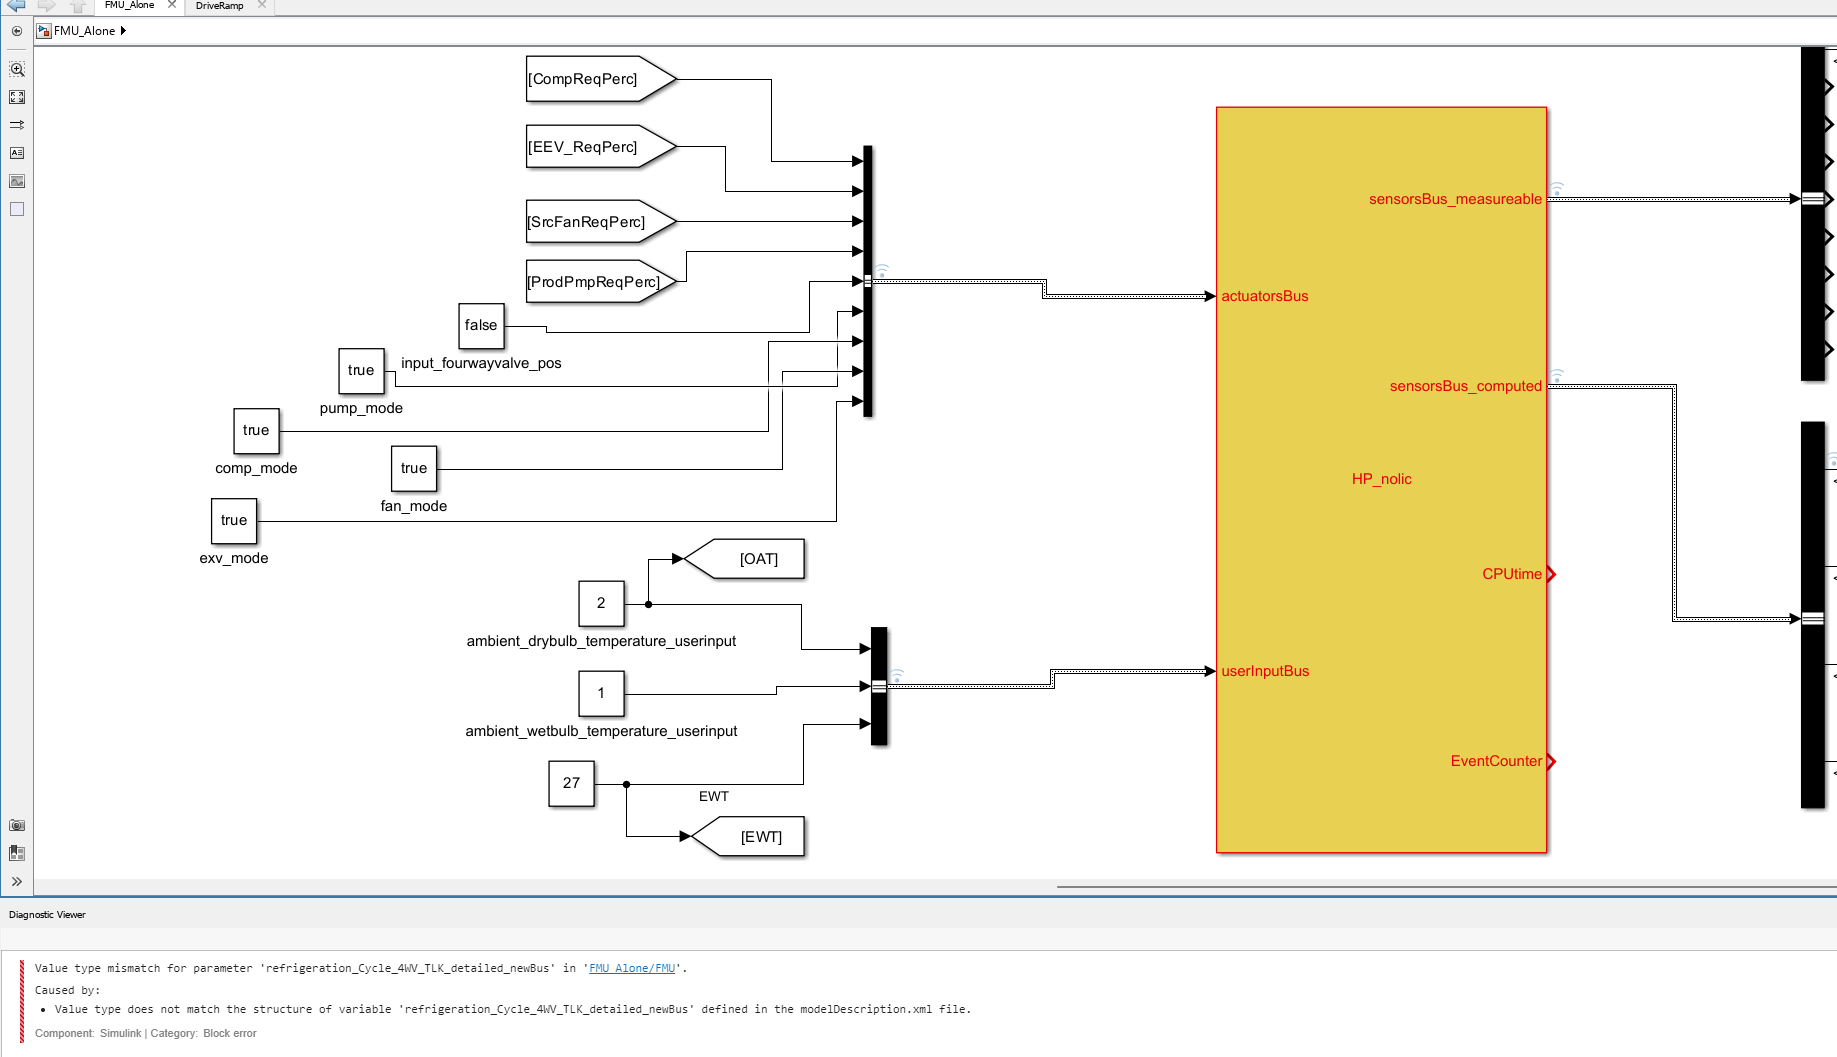
Hello Im tring to connect my master node to thingspeak but it gives error like:
Data received from slave - Temperature: 25.90, Humidity: 46.00, Soil Moisture: 0, pH: 4.26
Failed to send data to ThingSpeak, status code: -301
Data received from slave - Temperature: 25.90, Humidity: 46.00, Soil Moisture: 0, pH: 4.26
Failed to send data to ThingSpeak, status code: -301
What should I do?

And what do you do for Valentine's Day?
I need to copy Channel field data from a specific data range (e.g. January 2024) from field 6 of channel A(see sample attached) to field 1 of channel B.
I have tried to adopt the Template "Get data from private channel" in the Matlab analysis area of Thingspeak. The last data can be copied according the sample, but I cannot manage to copy the complete datarange. My channel field contains half empty data in field 6, because I have posted data asynchrously from 2 devices to 1 channel up to now.
Any advice for proper Matlab code sample or the like is welcome!
I found read API key but there is no option for the read channel id
which technical support should I contact/ask for the published Simscape example?
Is anyone having issues downloading the entire data from a channel? I usually include this line to the url but it no longer works: /feed.csv?days=1000000. Any suggestions on a way forward?
I was looking into the possibility of making a spin-to-win prize wheel in MATLAB. I was looking around, and if someone has made one before they haven't shared. A labeled colored spinning wheel, that would slow down and stop (or I would take just stopping) at a random spot each time. I would love any tips or links to helpful resources!
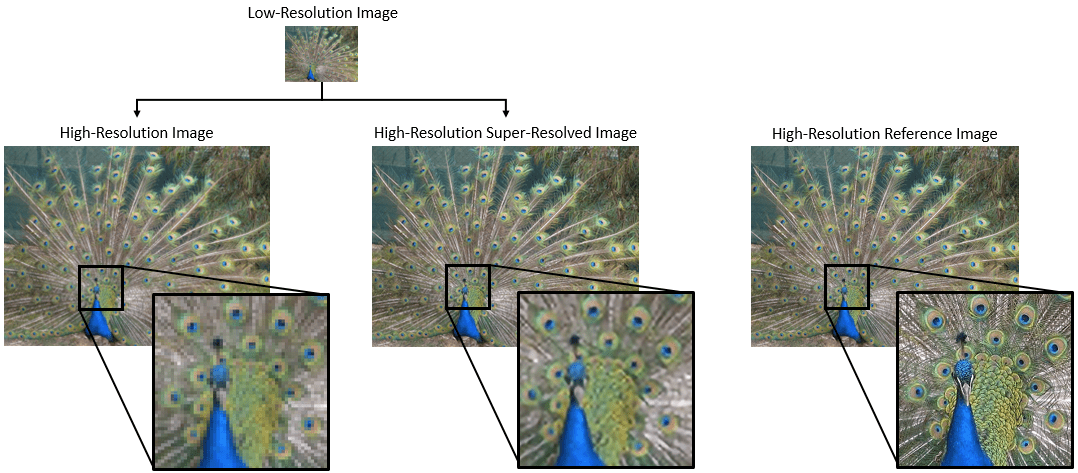
Many of the examples in the MATLAB documentation are extremely high quality articles, often worthy of attention in their own right. Time to start celebrating them! Today's is how to increase Image Resolution using deep learning
https://uk.mathworks.com/help/deeplearning/ug/single-image-super-resolution-using-deep-learning.html
Struct is an easy way to combine different types of variants. But now MATLAB supports classes well, and I think class is always a better alternative than struct. I can't find a single scenario that struct is necessary. There are many shortcomings using structs in a project, e.g. uncontrollable field names, unexamined values, etc. What's your opinion?
I am confused, is the matlab answer better or Julia’s?
Hello and a warm welcome to all! We're thrilled to have you visit our community. MATLAB Central is a place for learning, sharing, and connecting with others who share your passion for MATLAB and Simulink. To ensure you have the best experience, here are some tips to get you started:
- Read the Community Guidelines: Understanding our community standards is crucial. Please take a moment to familiarize yourself with them. Keep in mind that posts not adhering to these guidelines may be flagged by moderators or other community members.
- Ask Technical Questions at MATLAB Answers: If you have questions related to MathWorks products, head over to MATLAB Answers (new question form - Ask the community). It's the go-to spot for technical inquiries, with responses often provided within an hour, depending on the complexity of the question and volunteer availability. To increase your chances of a speedy reply, check out our tips on how to craft a good question (link to post on asking good questions).
- Choosing the Right Channel: We offer a variety of discussion channels tailored to different contexts. Select the one that best fits your post. If you're unsure, the General channel is always a safe bet. If you feel there's a need for a new channel, we encourage you to suggest it in the Ideas channel.
- Reporting Issues: If you encounter posts that violate our guidelines, please use the 🚩Flag/Report feature (found in the 3-dot menu) to bring them to our attention.
- Quality Control: We strive to maintain a high standard of discussion. Accounts that post spam or too much nonsense may be subject to moderation, which can include temporary suspensions or permanent bans.
- Share Your Ideas: Your feedback is invaluable. If you have suggestions on how we can improve the community or MathWorks products, the Ideas channel is the perfect place to voice your thoughts.
Enjoy yourself and have fun! We're committed to fostering a supportive and educational environment. Dive into discussions, share your expertise, and grow your knowledge. We're excited to see what you'll contribute to the community!
Now it's just a dial and pointer. There used to be a numeric value underneath.
I mentioned this in another thread about the column function not working, but thought maybe it needs it's own thread to be noticed.
This broke about the same time as the line/column problem and the not being able to move windows around anymore.
As of an hour ago my Visualisation stopped working, suddenly returning an empty matrix for 'old' (2019) data retrieved. It has been working fine all day and historically. New data being uploaded today is being retrieved fine. My code hasn't changed.
Downloading and checking, all data prior to 29-Nov-2023 has gone.
Has something changed server side?