ans = 
Results for
Time to time I need to filll an existing array with NaNs using logical indexing. A trick I discover is using arithmetics rather than filling. It is quite faster in some circumtances
A=rand(10000);
b=A>0.5;
tic; A(b) = NaN; toc
tic; A = A + 0./~b; toc;
If you know trick for other value filling feel free to post.
Hi,
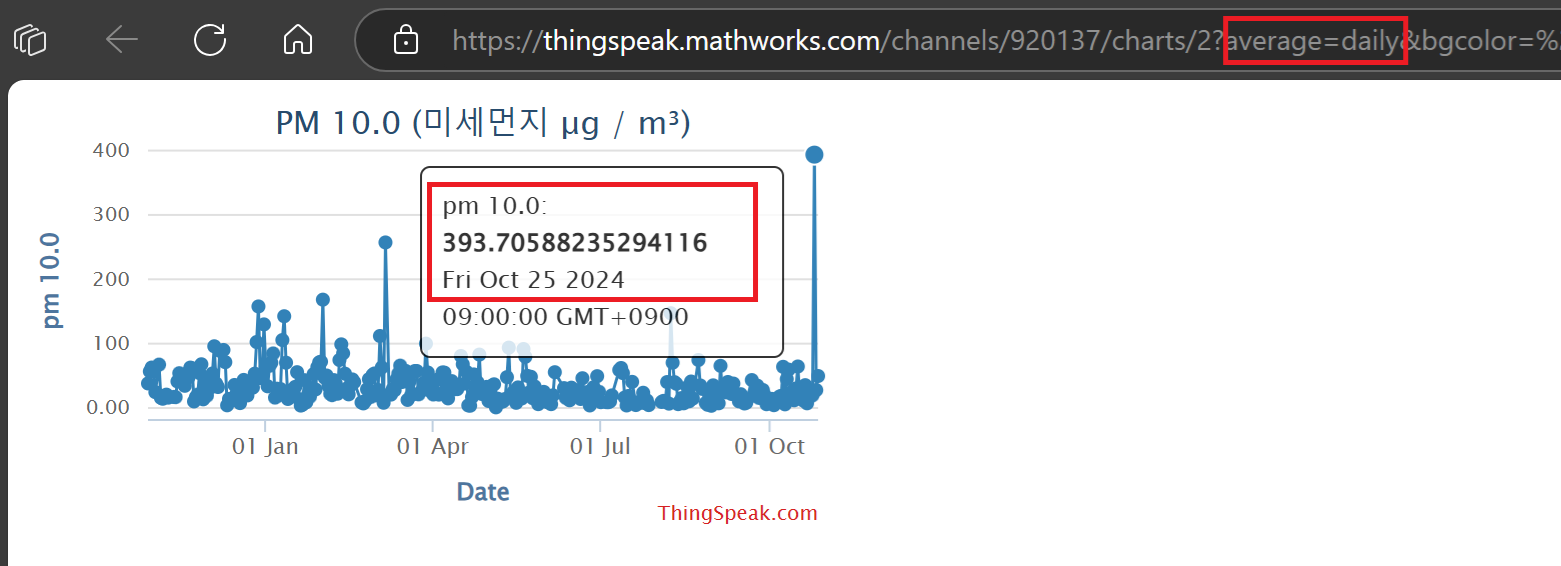
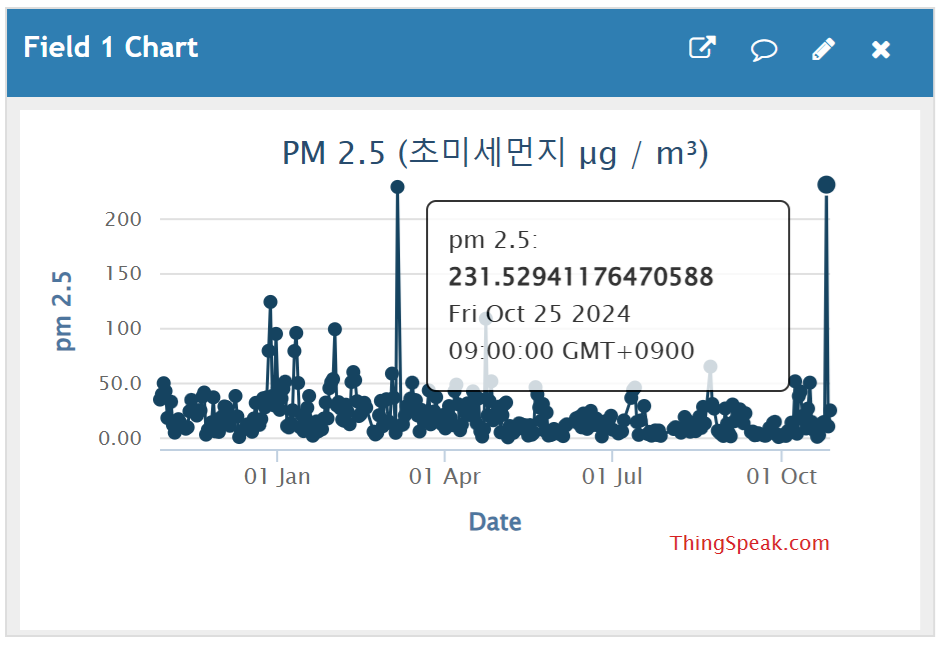
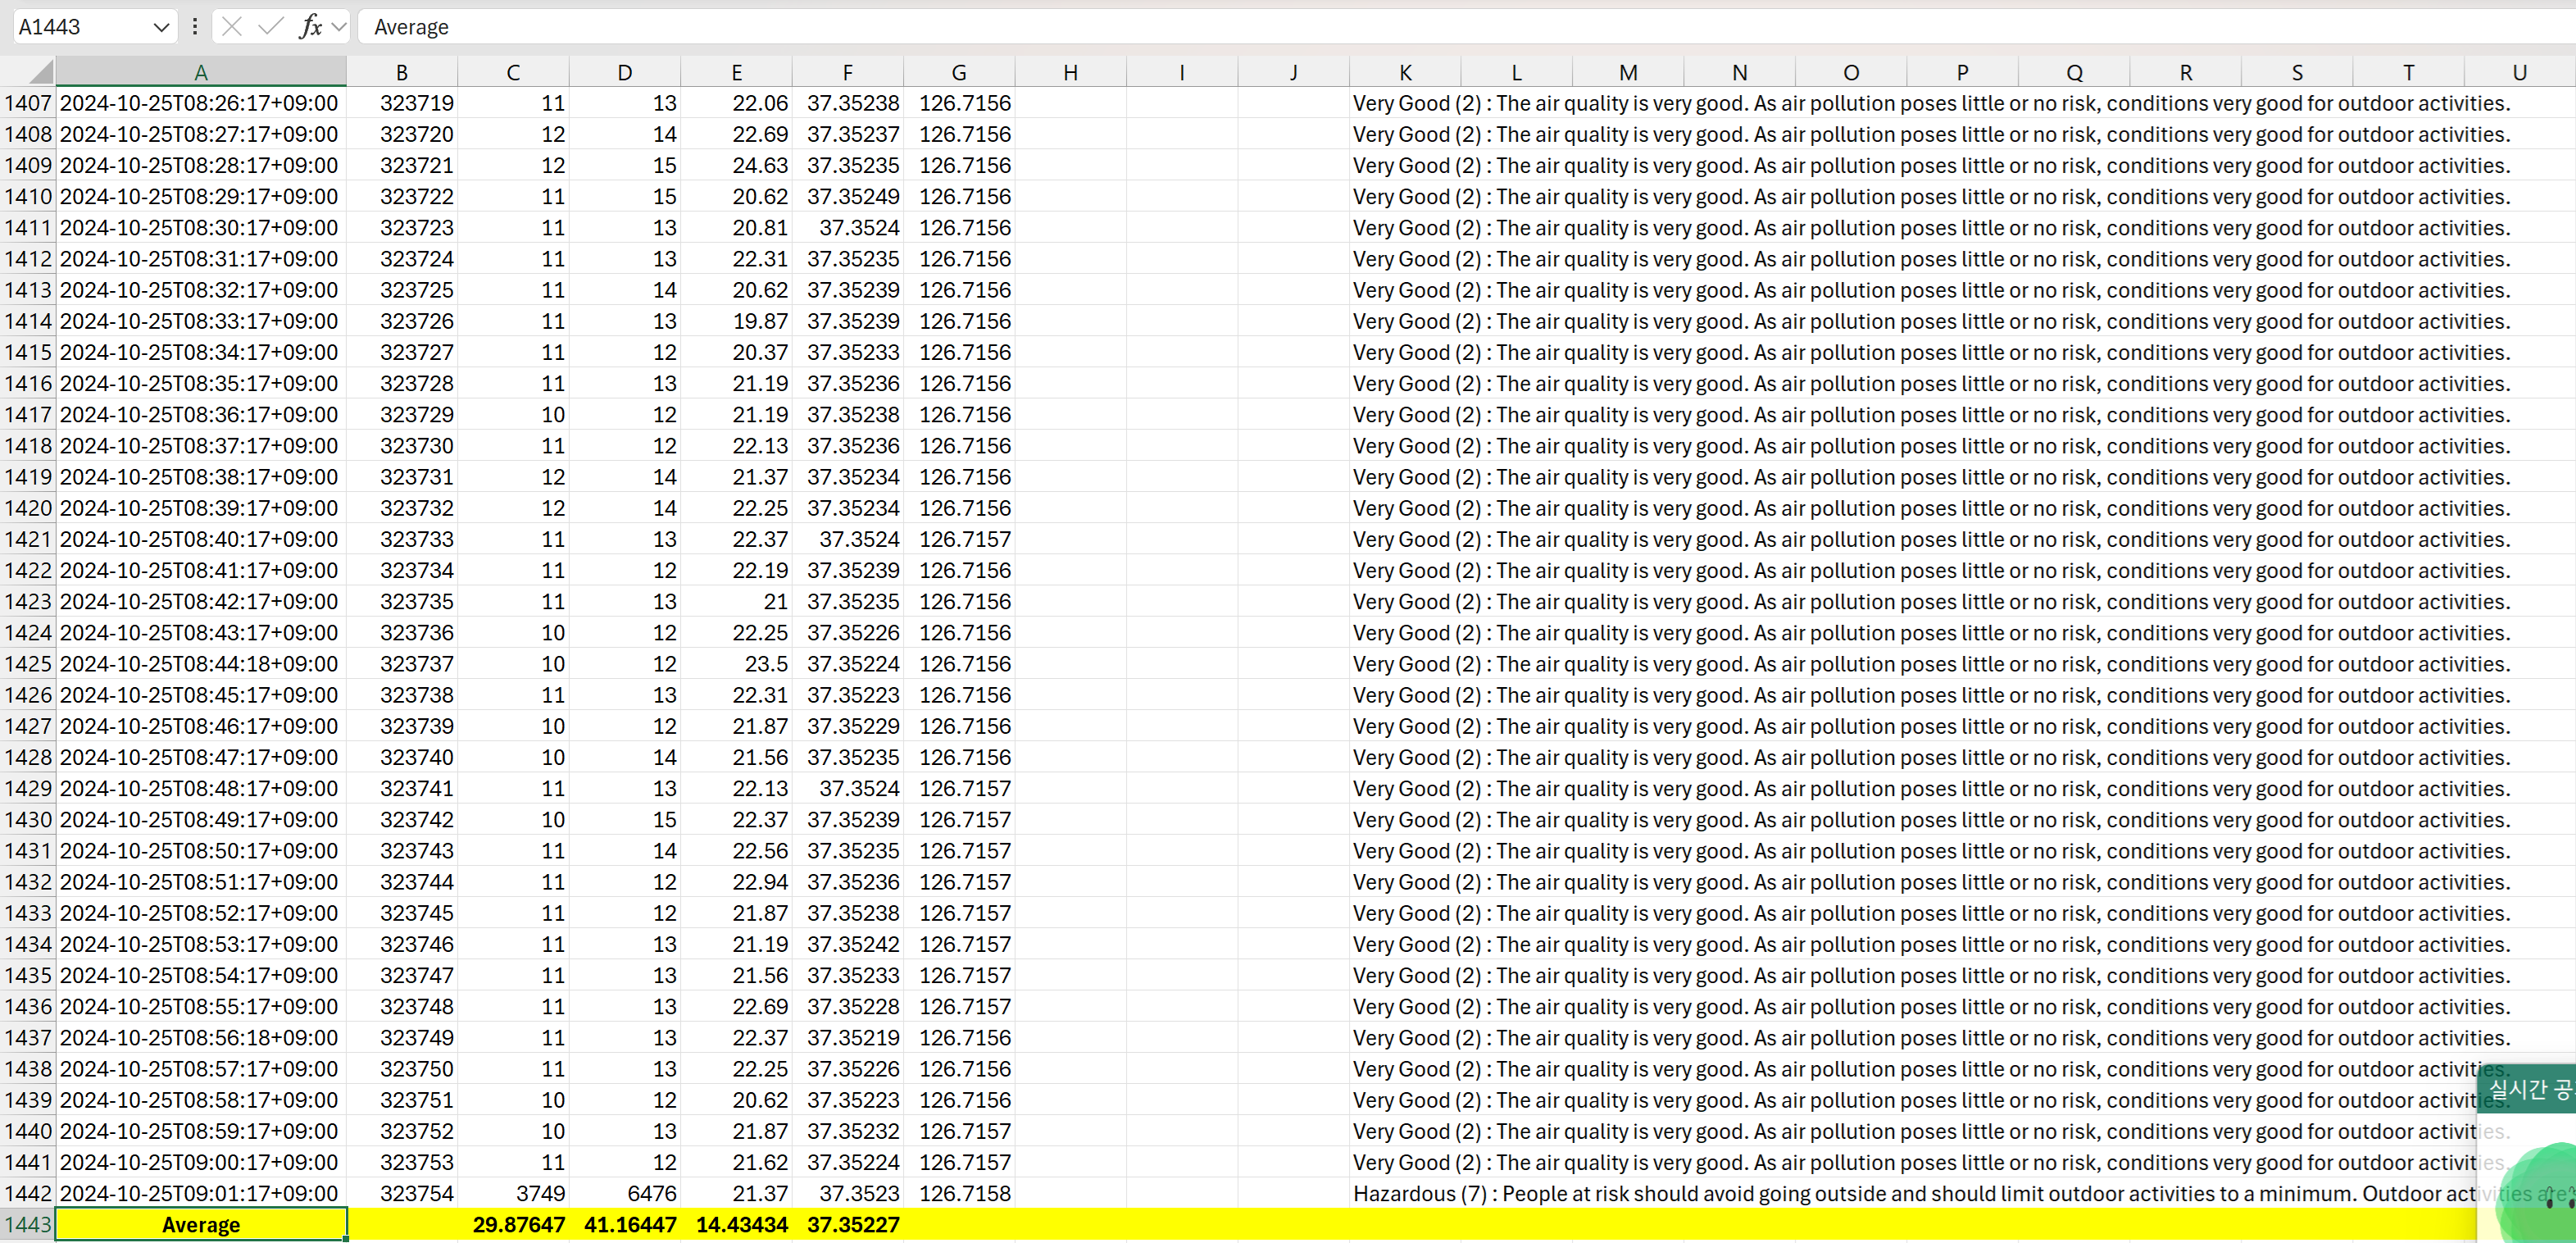
I don't know why really. Why is there seems a difference between daily average that calculated with .csv file that has exported directly from the channel.
and calculation with the ThingSpeak Daily Average API, there is a lot of difference at the moment.
Why does this happens, and how should I fix this issue?
Attached image file is daily average that has been retrived through the API,
And attached excel file is raw data from the channel.
Thank you.
My Licensed avvount has expired. When I go to my expired license page, I select "Revert To Free Account", I get the following message:
Only administrators of this license are allowed to renew units on this ThingSpeak license. If you want to continue to collect data in your ThingSpeak channels, contact your license administrator.
Aren't I the license administrator? or do I need to contact someone at Thingspeak/MathWorks?
function drawframe(f)
% Create a figure
figure;
hold on;
axis equal;
axis off;
% Draw the roads
rectangle('Position', [0, 0, 2, 30], 'FaceColor', [0.5 0.5 0.5]); % Left road
rectangle('Position', [2, 0, 2, 30], 'FaceColor', [0.5 0.5 0.5]); % Right road
% Draw the traffic light
trafficLightPole = rectangle('Position', [-1, 20, 1, 0.2], 'FaceColor', 'black'); % Pole
redLight = rectangle('Position', [0, 20, 0.5, 1], 'FaceColor', 'red'); % Red light
yellowLight = rectangle('Position', [0.5, 20, 0.5, 1], 'FaceColor', 'black'); % Yellow light
greenLight = rectangle('Position', [1, 20, 0.5, 1], 'FaceColor', 'black'); % Green light
carBody = rectangle('Position', [2.5, 2, 1, 4], 'Curvature', 0.2, 'FaceColor', 'red'); % Body
leftWheel = rectangle('Position', [2.5, 3.0, 0.2, 0.2], 'Curvature', [1, 1], 'FaceColor', 'black'); % Left wheel
rightWheel = rectangle('Position', [3.3, 3.0, 0.2, 0.2], 'Curvature', [1, 1], 'FaceColor', 'black'); % Right wheel
leftFrontWheel = rectangle('Position', [2.5, 5.0, 0.2, 0.2], 'Curvature', [1, 1], 'FaceColor', 'black'); % Left wheel
rightFrontWheel = rectangle('Position', [3.3, 5.0, 0.2, 0.2], 'Curvature', [1, 1], 'FaceColor', 'black'); % Right wheel
% Set limits
xlim([-1, 8]);
ylim([-1, 35]);
% Animation parameters
carSpeed = 0.5; % Speed of the car
carPosition = 2; % Initial car position
stopPosition = 15; % Position to stop at the traffic light
isStopped = false; % Car is not stopped initially
%Animation loop
for t = 1:100
% Update traffic light: Red for 40 frames, yellow for 10 frames Green for 40 frames
if t <= 40
% Red light on, yellow and green off
set(redLight, 'FaceColor', 'red');
set(yellowLight, 'FaceColor', 'black');
set(greenLight, 'FaceColor', 'black');
elseif t > 40 && t <= 50
% Change to green light
set(redLight, 'FaceColor', 'black');
set(yellowLight, 'FaceColor', 'yellow');
set(greenLight, 'FaceColor', 'black');
else
% Back to red light
set(redLight, 'FaceColor', 'black');
set(yellowLight, 'FaceColor', 'black');
set(greenLight, 'FaceColor', 'green');
isStopped = false; % Allow car to move
end
%Move the car
if ~isStopped
carPosition = carPosition + carSpeed; % Move forward
if carPosition < stopPosition
%do nothing
else
isStopped = true;
end
else
% Gradually stop the car when red
if carPosition > stopPosition
carPosition = carPosition + carSpeed*(1-t/50); % Move backward until it reaches the stop position
end
end
if carPosition >= 25
carPosition = 25;
end
% Update car position
% set(carBody, 'Position', [carPosition, 2, 1, 0.5]);
set(carBody, 'Position', [2.5, carPosition, 1, 4]);
%set(carWindow, 'Position', [carPosition + 0.2, 2.4, 0.6, 0.2]);
%set(leftWheel, 'Position', [carPosition, 1.5, 0.2, 0.2]);
set(leftWheel, 'Position', [2.5, carPosition+1, 0.2, 0.2]);
% set(rightWheel, 'Position', [carPosition + 0.8, 1.5, 0.2, 0.2]);
set(rightWheel, 'Position', [3.3, carPosition+1, 0.2, 0.2]);
set(leftFrontWheel, 'Position', [2.5, carPosition+3, 0.2, 0.2]);
set(rightFrontWheel, 'Position', [3.3, carPosition+3, 0.2, 0.2]);
% Pause to control animation speed
pause(0.01);
end
hold off;
Hi, My data send to thingspeak is not received/updated for the last 6 hours on the charts and dials. All worked well till about 6 hour ago. I am using Node-red and the API Url: https://thingspeak.com
Any help please?
Greetings Gert
To solve issues around the browsers blocking 3p cookies and having different behavior across different browsers, the ThingSpeak website is now served from https://thingspeak.mathworks.com. There are no changes required from devices or users. Just log in and use the service as you always did.
I left the code unchanged, modifying only secrets.h.
I am using an ESP32-WROOM -32U
Connection to network succeeds, but ThingSpeak.writeFields fails every time, with HTTP error code 400.
The sketch I am really trying to use is loosely based on this example, accesses Time and Weather info with no problems, but ThingSpeak.writeFields fails with HTTP error code 301.
This is my first attempt to use ThingSpeak.
Is this example sketch still valid, or must I look elsewhere? Suggestions please.
Hi everyone,
I'm working on a school project where I need to send sensor data from my Arduino to a Power BI REST API using ThingsHTTP. I've been trying to get this to work, but I'm running into errors like this:
{"error":{"code":"InvalidRequest","message":"Error parsing request for dataset sobe_wowvirtualserver|a7b68fb5-533b-471f-a5da-3bdd6746ee16: Conversion error on column '<pi>pH</pi>': <pi>Input string was not in a correct format.</pi>"}}
I'm a beginner with this, and I'm not sure what I'm doing wrong. What steps should I take to resolve this issue? Also, does anyone know the correct format for an HTTP request body when sending dynamic sensor data?
This is the body format I'm trying to send to Power BI:
[
{
"pH": 98.6,
"TDS": 98.6,
"turbidity": 98.6,
"temperature": 98.6
}
]
Any advice on how to construct the HTTP body with values that change over time would be greatly appreciated! Thanks in advance!"
hope this message finds you well. I am currently working on a project involving the design and numerical simulation of metalenses using Zemax and MATLAB. The design phase involves saving phase data from the Zemax simulation, which is later used in a numerical script to generate the metalens in MATLAB.
I have a MATLAB file that contains the phase data saved from Zemax, but I am unsure of the specific method or format used to extract and save the data from Zemax. The phase data I currently have in MATLAB is as follows:
- Phase matrix: 571 x 571 (double)
- X data: 571 x 1 (double)
- Y data: 571 x 1 (double)
Could you please provide guidance on:
- How this phase data was likely saved from Zemax into MATLAB?
- What steps or scripts were used to extract this information from the design, particularly the 571 x 571 phase matrix and the corresponding X and Y data?
- Any best practices or tools available in Zemax for exporting such data?
This information will help me reproduce the workflow and proceed with my analysis.
Thank you for your support. I look forward to your guidance.
Best regards,
Zaka
In the spirit of warming up for this year's minihack contest, I'm uploading a walkthrough for how to design an airship using pure Matlab script. This is commented and uncondensed; half of the challenge for the minihacks is how minimize characters. But, maybe it will give people some ideas.
The actual airship design is from one of my favorite original NES games that I played when I was a kid - Little Nemo: The Dream Master. The design comes from the intro of the game when Nemo sees the Slumberland airship leave for Slumberland:
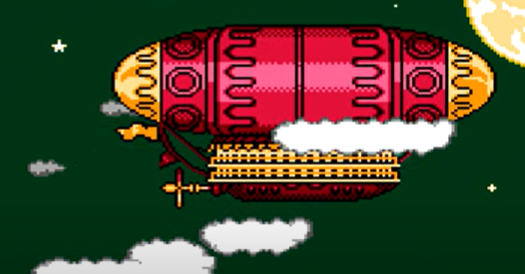
(Snip from a frame of the opening scene in Capcom's game Little Nemo: The Dream Master, showing the Slumberland airship).
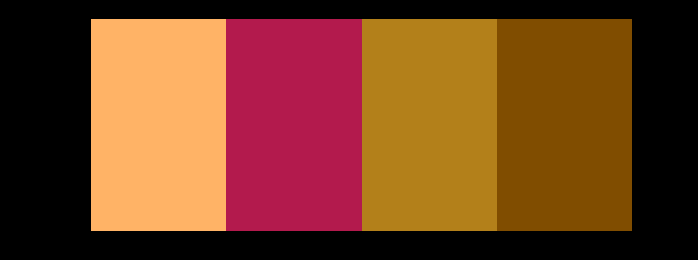
I spent hours playing this game with my two sisters, when we were little. It's fun and tough, but the graphics sparked the imagination. On to the code walkthrough, beginning with the color palette: these four colors are the only colors used for the airship:
c1=cat(3,1,.7,.4); % Cream color
c2=cat(3,.7,.1,.3); % Magenta
c3=cat(3,0.7,.5,.1); % Gold
c4=cat(3,.5,.3,0); % bronze
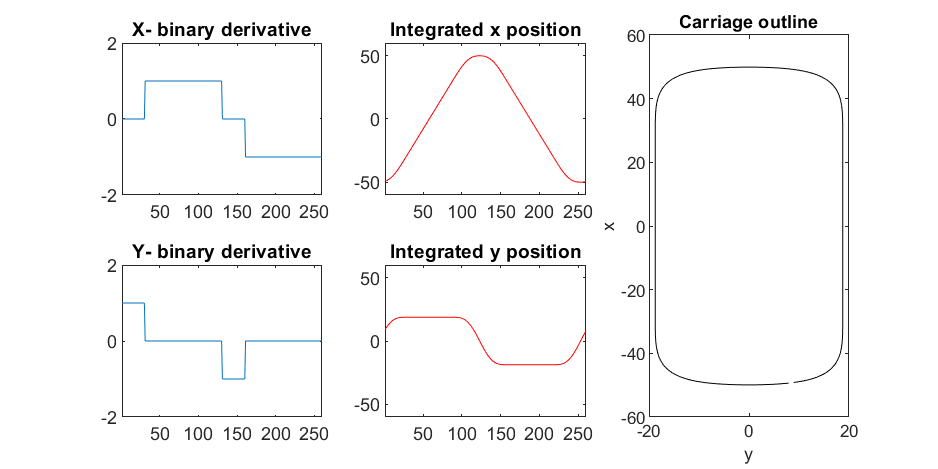
We start with the airship carriage body. We want something rectangular but smoothed on the corners. To do this we are going to start with the separate derivatives of the x and y components, which can be expressed using separate blocks of only three levels: [1, 0, -1]. You could integrate to create a rectangle, but if we smooth the derivatives prior to integrating we will get rounded edges. This is done in the following code:
% Binary components for x & y vectors
z=zeros(1,30);
o=ones(1,100);
% X and y vectors
x=[z,o,z,-o];
y=[1+z,1-o,z-1,1-o];
% Smoother function (fourier / circular)
s=@(x)ifft(fft(x).*conj(fft(hann(45)'/22,260)));
% Integrator function with replication and smoothing to form mesh matrices
u=@(x)repmat(cumsum(s(x)),[30,1]);
% Construct x and y components of carriage with offsets
x3=u(x)-49.35;
y3=u(y)+6.35;
y3 = y3*1.25; % Make it a little fatter
% Add a z-component to make the full set of matrices for creating a 3D
% surface:
z3=linspace(0,1,30)'.*ones(1,260)*30;
z3(14,:)=z3(15,:); % These two lines are for adding platforms
z3(2,:)=z3(3,:); % to the carriage, later.
Plotting x, y, and the top row of the smoothed, integrated, and replicated matrices x3 and y3 gives the following:
We now have the x and y components for a 3D mesh of the carriage, let's make it more interesting by adding a color scheme including doors, and texture for the trim around the doors. Let's also add platforms beneath the doors for passengers to walk on.
Starting with the color values, let's make doors by convolving points in a color-matrix by a door shaped function.
m=0*z3; % Image matrix that will be overlayed on carriage surface
m(7,10:12:end)=1; % Door locations (lower deck)
m(21,10:12:end)=1; % Door locations (upper deck)
drs = ones(9, 5); % Door shape
m=1-conv2(m,ones(9,5),'same'); % Applying
To add the trim, we will convolve matrix "m" (the color matrix) with a square function, and look for values that lie between the extrema. We will use this to create a displacement function that bumps out the -x, and -y values of the carriage surface in intermediary polar coordinate format.
rm=conv2(m,ones(5)/25,'same'); % Smoothing the door function
rm(~m)=0; % Preserving only the region around the doors
rds=0*m; % Radial displacement function
rds(rm<1&rm>0)=1; % Preserving region around doors
rds(m==0)=0;
rds(13:14,:)=6; % Adding walkways
rds(1:2,:)=6;
% Apply radial displacement function
[th,rd]=cart2pol(x3,y3);
[x3T,y3T]=pol2cart(th,(rd+rds)*.89);
If we plot the color function (m) and radial displacement function (rds) we get the following:
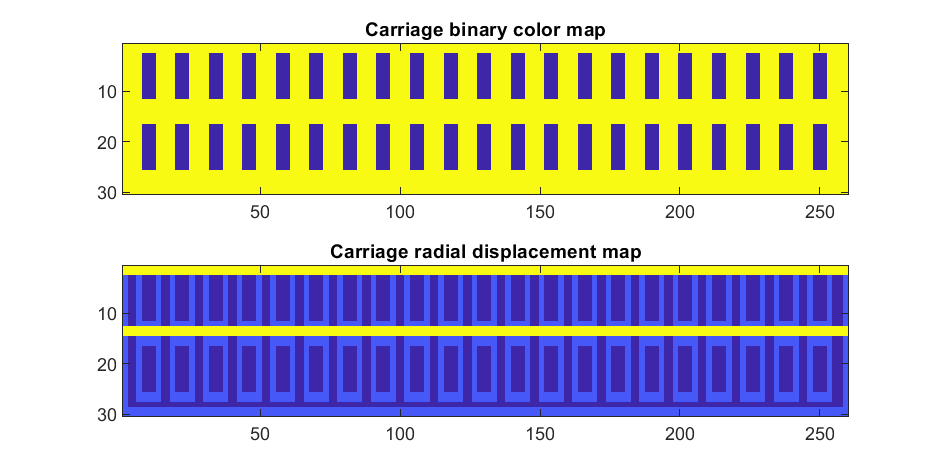
In the upper plot you can see the doors, and in the bottom map you can see the walk way and door trim.
Next, we are going to add some flags draped from the bottom and top of the carriage. We are going to recycle the values in "z3" to do this, by multiplying that matrix with the absolute value of a sine-wave, squished a bit with the soft-clip erf() function.
We add a keel to the airship carriage using a canonical sphere turned on its side, again using the soft-clip erf() function to make it roughly rectangular in x and y, and multiplying with a vector that is half nan's to make the top half transparent.
At this point, since we are beginning the plotting of the ship, we also need to create our hgtransform objects. These allow us to move all of the components of the airship in unison, and also link objects with pivot points to the airship, such as the propeller.
% Now we need some flags extending around the top and bottom of the
% carriage. We can do this my multiplying the height function (z3) with the
% absolute value of a sine-wave, rounded with a compression function
% (erf() in this case);
g=-z3.*erf(abs(sin(linspace(0,40*pi,260))))/4; % Flags
% Also going to add a slight taper to the carriage... gives it a nice look
tp=linspace(1.05,1,30)';
% Finally, plotting. Plot the carriage with the color-map for the doors in
% the cream color, than the flags in magenta. Attach them both to transform
% objects for movement.
% Set up transform objects. 2 moving parts:
% 1) The airship itself and all sub-components
% 2) The propellor, which attaches to the airship and spins on its axis.
hold on;
P=hgtransform('Parent',gca); % Ship
S=hgtransform('Parent',P); % Prop
surf(x3T.*tp,y3T,z3,c1.*m,'Parent',P);
surf(x3,y3,g,c2.*rd./rd, 'Parent', P);
surf(x3,y3,g+31,c2.*rd./rd, 'Parent', P);
axis equal
% Now add the keel of the airship. Will use a canonical sphere and the
% erf() compression function to square off.
[x,y,z]=sphere(99);
mk=round(linspace(-1,1).^2+.3); % This function makes the top half of the sphere nan's for transparency.
surf(50*erf(1.4*z),15*erf(1.4*y),13*x.*mk./mk-1,.5*c2.*z./z, 'Parent', P);
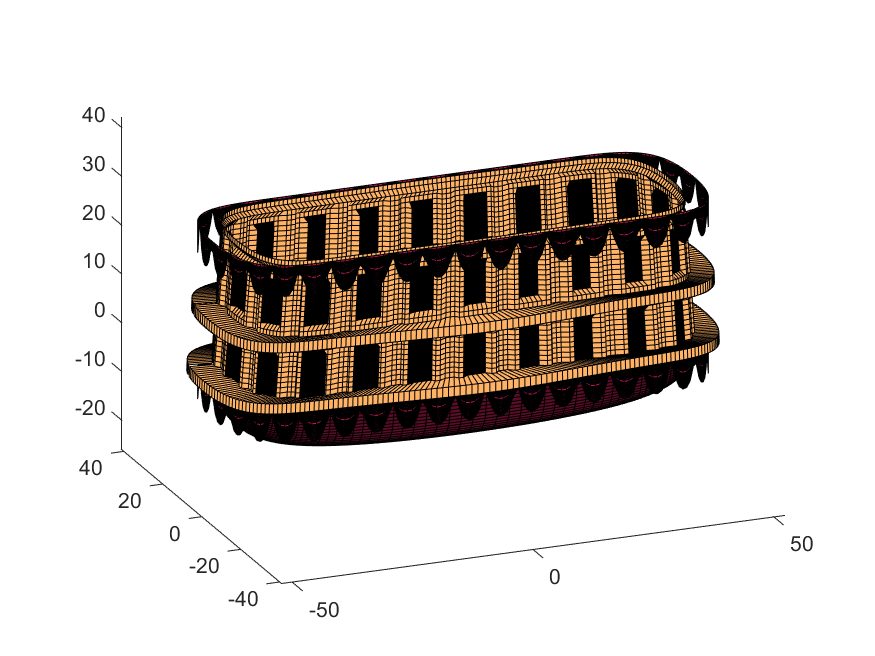
% The carriage is done. Now we can make the blimp above it.
We haven't adjusted the shading of the image yet, but you can see the design features that have been created:
Next, we start working on the blimp. This is going to use a few more vertices & faces. We are going to use a tapered cylinder for this part, and will start by making the overlaid image, which will have 2 colors plus radial rings, circles, and squiggles for ornamentation.
M=525; % Blimp (matrix dimensions)
N=700;
% Assign the blimp the cream and magenta colors
t=122; % Transition point
b=ones(M,N,3); % Blimp color map template
bc=b.*c1; % Blimp color map
bc(:,t+1:end-t,:)=b(:,t+1:end-t,:).*c2;
% Add axial rings around blimp
l=[.17,.3,.31,.49];
l=round([l,1-fliplr(l)]*N); % Mirroring
lnw=ones(1,N); % Mask
lnw(l)=0;
lnw=rescale(conv(lnw,hann(7)','same'));
bc=bc.*lnw;
% Now add squiggles. We're going to do this by making an even function in
% the x-dimension (N, 725) added with a sinusoidal oscillation in the
% y-dimension (M, 500), then thresholding.
r=sin(linspace(0, 2*pi, M)*10)'+(linspace(-1, 1, N).^6-.18)*15;
q=abs(r)>.15;
r=sin(linspace(0, 2*pi, M)*12)'+(abs(linspace(-1, 1, N))-.25)*15;
q=q.*(abs(r)>.15);
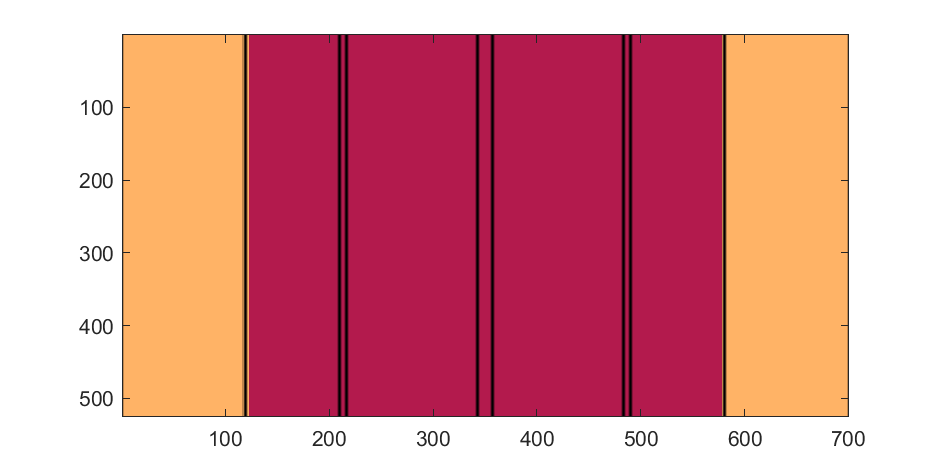
% Now add the circles on the blimp. These will be spaced evenly in the
% polar angle dimension around the axis. We will have 9. To make the
% circles, we will create a cone function with a peak at the center of the
% circle, and use thresholding to create a ring of appropriate radius.
hs=[1,.75,.5,.25,0,-.25,-.5,-.75,-1]; % Axial spacing of rings
% Cone generation and ring loop
xy= @(h,s)meshgrid(linspace(-1, 1, N)+s*.53,(linspace(-1, 1, M)+h)*1.15);
w=@(x,y)sqrt(x.^2+y.^2);
for n=1:9
h=hs(n);
[xx,yy]=xy(h,-1);
r1=w(xx,yy);
[xx,yy]=xy(h,1);
r2=w(xx,yy);
b=@(x,y)abs(y-x)>.005;
q=q.*b(.1,r1).*b(.075,r1).*b(.1,r2).*b(.075,r2);
end
The figures below show the color scheme and mask used to apply the squiggles and circles generated in the code above:
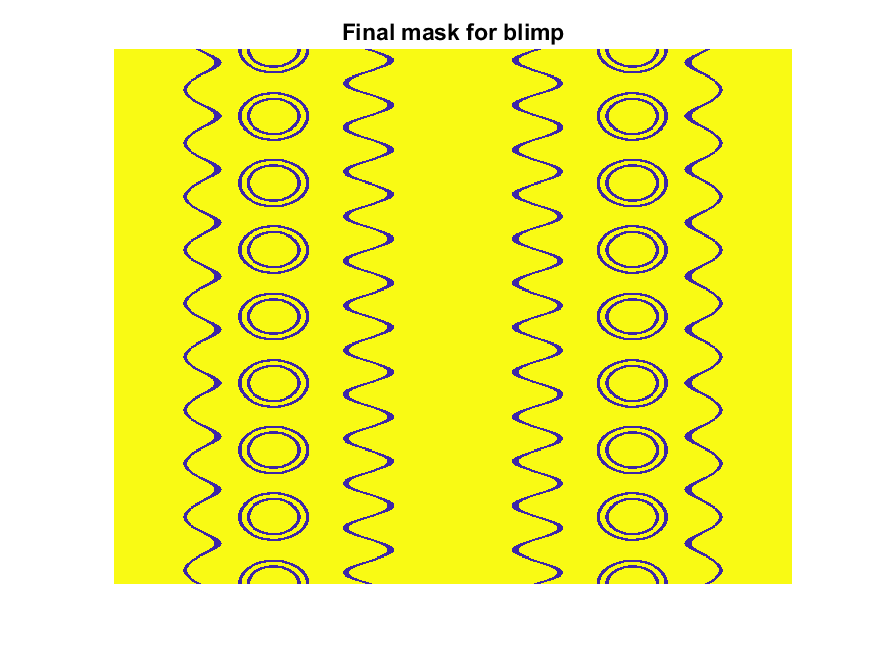
Finally, for the colormap we are going to smooth the binary mask to avoid hard transitions, and use it to to add a "puffy" texture to the blimp shape. This will be done by diffusing the mask iteratively in a loop with a non-linear min() operator.
% 2D convolution function
ff=@(x)circshift(ifft2(fft2(x).*conj(fft2(hann(7)*hann(7)'/9,M,N))),[3,3]);
q=ff(q); % Smooth our mask function
hh=rgb2hsv(q.*bc); % Convert to hsv: we are going to use the value
% component for radial displacement offsets of the
% 3D blimp structure.
rd=hh(:,:,3); % Value component
for n=1:10
rd=min(rd,ff(rd)); % Diffusing the value component for a puffy look
end
rd=(rd+35)/36; % Make displacements effects small
% Now make 3D blimp manifold using "cylinder" canonical shape
[x,y,z]=cylinder(erf(sin(linspace(0,pi,N)).^.5)/4,M-1); % First argument is the blimp taper
[t,r]=cart2pol(x, y);
[x2,y2]=pol2cart(t, r.*rd'); % Applying radial displacment from mask
s=200;
% Plotting the blimp
surf(z'*s-s/2, y2'*s, x2'*s+s/3.9+15, q.*bc,'Parent',P);
Notice that the parent of the blimp surface plot is the same as the carriage (e.g. hgtransform object "P"). Plotting at this point using flat shading and adding some lighting gives the image below:
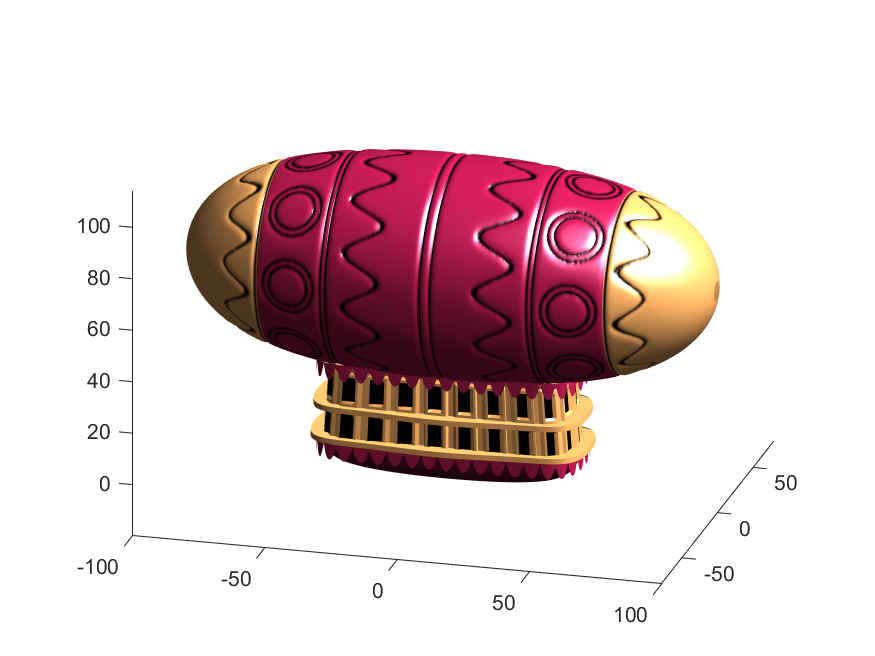
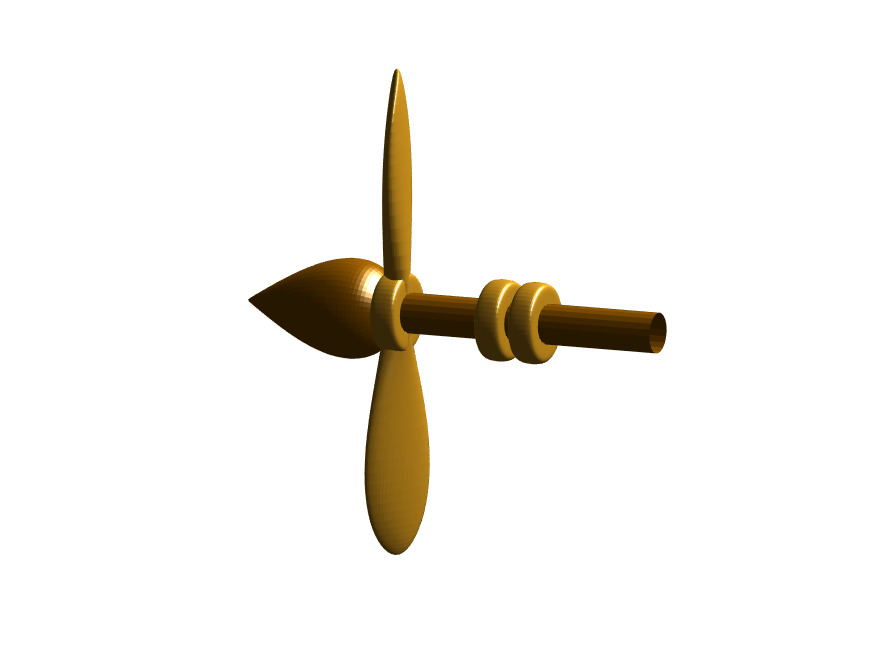
Next, we need to add a propeller so it can move. This will include the creation of a shaft using the cylinder() function. The rest of the pieces (the propeller blades, collars and shaft tip) all use the same canonical sphere with distortions applied using various math functions. Note that when the propeller is made it is linked to hgtransform object "S" rather than "P." This will allow the propeller to rotate, but still be joined to the airship.
% Next, the propeller. First, we start with the shaft. This is a simple
% cylinder. We add an offset variable and a scale variable to move our
% propeller components around, as well.
shx = -70; % This is our x-shifter for components
scl = 3; % Component size scaler
[x,y,z]=cylinder(1, 20); % Canonical cylinder for prop shaft.
p(1)=surf(-scl*(z-1)*7+shx,scl*x/2,scl*y/2,0*x+c4,'Parent',P); % Prop shaft
% Now the propeller. This is going to be made from a distorted sphere.
% The important thing here is that it is linked to the "S" hgtransform
% object, which will allow it to rotate.
[x,y,z]=sphere(50);
a=(-1:.04:1)';
x2=(x.*cos(a)-y/3.*sin(a)).*(abs(sin(a*2))*2+.1);
y2=(x.*sin(a)+y/3.*cos(a));
p(2)=surf(-scl*y2+shx,scl*x2,scl*z*6,0*x+c3,'Parent',S);
% Now for the prop-collars. You can see these on the shaft in the NES
% animation. These will just be made by using the canonical sphere and the
% erf() activation function to square it in the x-dimension.
g=erf(z*3)/3;
r=@(g)surf(-scl*g+shx,scl*x,scl*y,0*x+c3,'Parent',P);
r(g);
r(g-2.8);
r(g-3.7);
% Finally, the prop shaft tip. This will just be the sphere with a
% taper-function applied radially.
t=1.7*cos(0:.026:1.3)'.^2;
p(3)=surf(-(z*2+2)*scl + shx,x.*t*scl,y.*t*scl, 0*x+c4,'Parent',P);
Now for some final details including the ropes to the blimp, a flag hung on one of the ropes, and railings around the walkways so that passengers don't plummet to their doom. This will make use of the ad-hoc "ropeG" function, which takes a 3D vector of points and makes a conforming cylinder around it, so that you get lighting functions etc. that don't work on simple lines. This function is added to the script at the end to do this:
% Rope function for making a 3D curve have thickness, like a rope.
% Inputs:
% - xyz (3D curve vector, M points in 3 x M format)
% - N (Number of radial points in cylinder function around the curve
% - W (Width of the rope)
%
% Outputs:
% - xf, yf, zf (Matrices that can be used with surf())
function [xf, yf, zf] = RopeG(xyz, N, W)
% Canonical cylinder with N points in circumference
[xt,yt,zt] = cylinder(1, N);
% Extract just the first ring and make (W) wide
xyzt = [xt(1, :); yt(1, :); zt(1, :)]*W;
% Get local orientation vector between adjacent points in rope
dxyz = xyz(:, 2:end) - xyz(:, 1:end-1);
dxyz(:, end+1) = dxyz(:, end);
vcs = dxyz./vecnorm(dxyz);
% We need to orient circle so that its plane normal is parallel to
% xyzt. This is a kludgey way to do that.
vcs2 = [ones(2, size(vcs, 2)); -(vcs(1, :) + vcs(2, :))./(vcs(3, :)+0.01)];
vcs2 = vcs2./vecnorm(vcs2);
vcs3 = cross(vcs, vcs2);
p = @(x)permute(x, [1, 3, 2]);
rmats = [p(vcs3), p(vcs2), p(vcs)];
% Create surface
xyzF = pagemtimes(rmats, xyzt) + permute(xyz, [1, 3, 2]);
% Outputs for surf format
xf = squeeze(xyzF(1, :, :));
yf = squeeze(xyzF(2, :, :));
zf = squeeze(xyzF(3, :, :));
end
Using this function we can define the ropes and balconies. Note that the balconies simply recycle one of the rows of the original carriage surface, defining the outer rim of the walkway, but bumping up in the z-dimension.
cb=-sqrt(1-linspace(1, 0, 100).^2)';
c1v=[linspace(-67, -51)', 0*ones(100,1),cb*30+35];
c2v=[c1v(:,1),c1v(:,2),(linspace(1,0).^1.5-1)'*15+33];
c3v=c2v.*[-1,1,1];
[xr,yr,zr]=RopeG(c1v', 10, .5);
surf(xr,yr,zr,0*xr+c2,'Parent',P);
[xr,yr,zr]=RopeG(c2v', 10, .5);
surf(xr,yr,zr,0*zr+c2,'Parent',P);
[xr,yr,zr]=RopeG(c3v', 10, .5);
surf(xr,yr,zr,0*zr+c2,'Parent',P);
% Finally, balconies would add a nice touch to the carriage keep people
% from falling to their death at 10,000 feet.
[rx,ry,rz]=RopeG([x3T(14, :); y3T(14,:); 0*x3T(14,:)+18]*1.01, 10, 1);
surf(rx,ry,rz,0*rz+cat(3,0.7,.5,.1),'Parent',P);
surf(rx,ry,rz-13,0*rz+cat(3,0.7,.5,.1),'Parent',P);
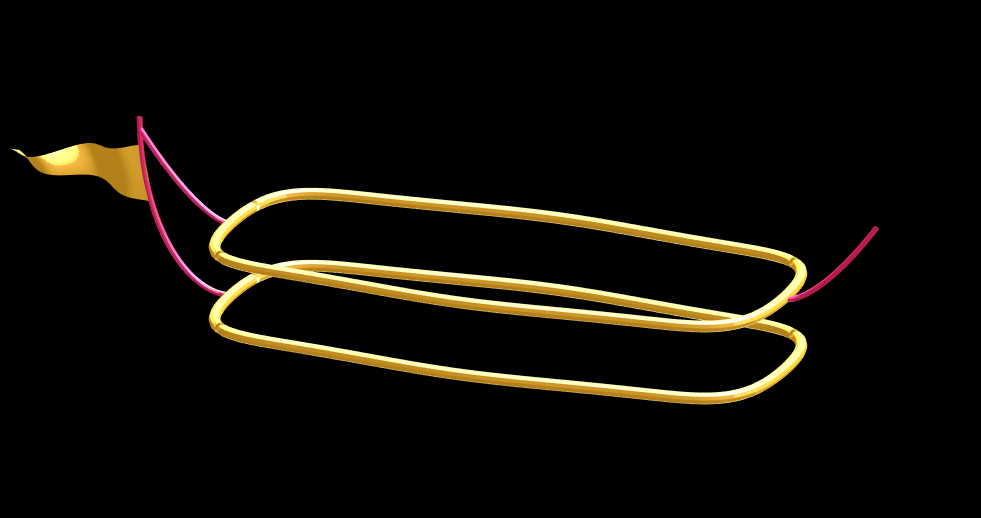
And, very last, we are going to add a flag attached to the outer cable. Let's make it flap in the wind. To make it we will recycle the z3 matrix again, but taper it based on its x-value. Then we will sinusoidally oscillate the flag in the y dimension as a function of x, constraining the y-position to be zero where it meets the cable. Lastly, we will displace it quadratically in the x-dimension as a function of z so that it lines up nicely with the rope. The phase of the sine-function is modified in the animation loop to give it a flapping motion.
h=linspace(0,1);
sc=10;
[fx,fz]=meshgrid(h,h-.5);
F=surf(sc*2.5*fx-90-2*(fz+.5).^2,sc*.3*erf(3*(1-h)).*sin(10*fx+n/5),sc*fz.*h+25,0*fx+c3,'Parent',P);
Plotting just the cables and flag shows:
Putting all the pieces together reveals the full airship:
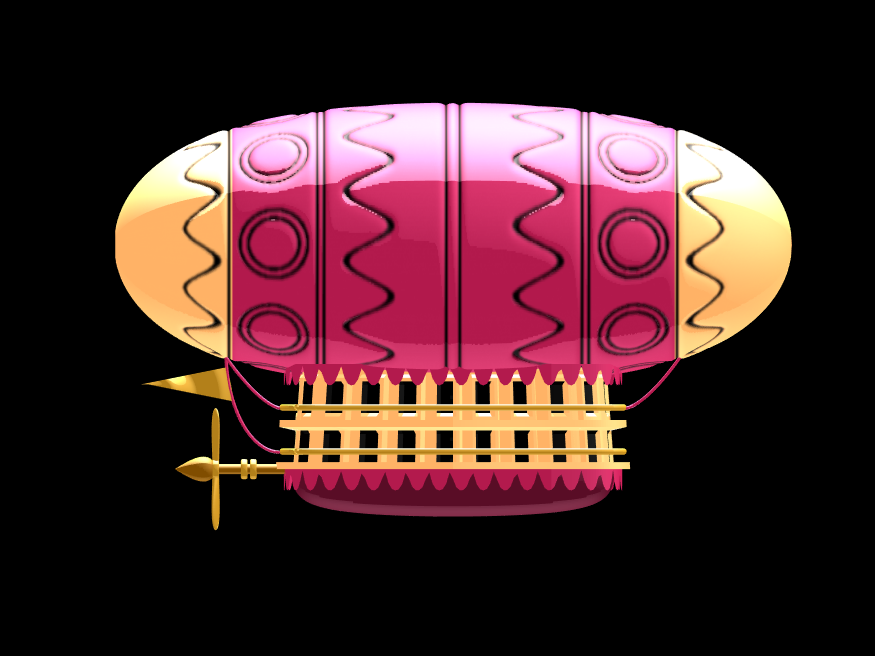
A note about lighting: lighting and material properties really change the feel of the image you create. The above picture is rendered in a cartoony style by setting the specular exponent to a very low value (1), and adding lots of diffuse and ambient reflectivity as well. A light below the airship was also added, albeit with lower strength. Settings used for this plot were:
shading flat
view([0, 0]);
L=light;
L.Color = [1,1,1]/4;
light('position', [0, 0.5, 1], 'color', [1,1,1]);
light('position', [0, 1, -1], 'color', [1, 1, 1]/5);
material([1, 1, .7, 1])
set(gcf, 'color', 'k');
axis equal off
What about all the rest of the stuff (clouds, moon, atmospheric haze etc.) These were all (mostly) recycled bits from previous minihack entries. The clouds were made using power-law noise as explained in Adam Danz' blog post. The moon was borrowed from moonrun, but with an increased number of points. Atmospheric haze was recycled from Matlon5. The rest is just camera angles, hgtransform matrix updates, and updating alpha-maps or vertex coordinates.
Finally, the use of hann() adds the signal processing toolbox as a dependency. To avoid this use the following anonymous function:
hann = @(x)-cospi(linspace(0,2,x)')/2+.5;
I went to perform an IoT for an automated plantation but the same error always occurs to me when I upload it to the mcu node, which is: Connection to ThingSpeak failed.
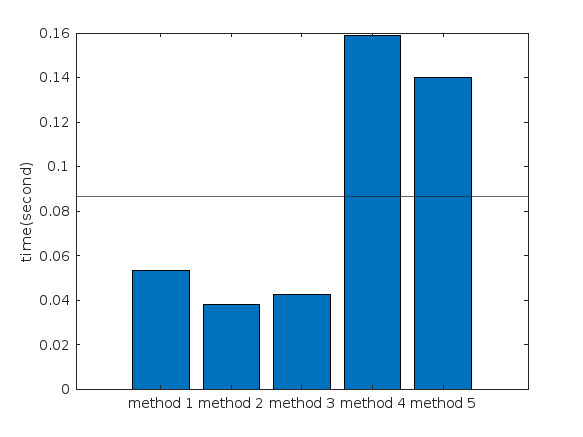
Create a struct arrays where each struct has field names "a," "b," and "c," which store different types of data. What efficient methods do you have to assign values from individual variables "a," "b," and "c" to each struct element? Here are five methods I've provided, listed in order of decreasing efficiency. What do you think?
Create an array of 10,000 structures, each containing each of the elements corresponding to the a,b,c variables.
num = 10000;
a = (1:num)';
b = string(a);
c = rand(3,3,num);
Here are the methods;
%% method1
t1 =tic;
s = struct("a",[], ...
"b",[], ...
"c",[]);
s1 = repmat(s,num,1);
for i = 1:num
s1(i).a = a(i);
s1(i).b = b(i);
s1(i).c = c(:,:,i);
end
t1 = toc(t1);
%% method2
t2 =tic;
for i = num:-1:1
s2(i).a = a(i);
s2(i).b = b(i);
s2(i).c = c(:,:,i);
end
t2 = toc(t2);
%% method3
t3 =tic;
for i = 1:num
s3(i).a = a(i);
s3(i).b = b(i);
s3(i).c = c(:,:,i);
end
t3 = toc(t3);
%% method4
t4 =tic;
ct = permute(c,[3,2,1]);
t = table(a,b,ct);
s4 = table2struct(t);
t4 = toc(t4);
%% method5
t5 =tic;
s5 = struct("a",num2cell(a),...
"b",num2cell(b),...
"c",squeeze(mat2cell(c,3,3,ones(num,1))));
t5 = toc(t5);
%% plot
bar([t1,t2,t3,t4,t5])
xtickformat('method %g')
ylabel("time(second)")
yline(mean([t1,t2,t3,t4,t5]))
I was browsing the MathWorks website and decided to check the Cody leaderboard. To my surprise, William has now solved 5,000 problems. At the moment, there are 5,227 problems on Cody, so William has solved over 95%. The next competitor is over 500 problems behind. His score is also clearly the highest, approaching 60,000.
D.R. Kaprekar was a self taught recreational mathematician, perhaps known mostly for some numbers that bear his name.
Today, I'll focus on Kaprekar's constant (as opposed to Kaprekar numbers.)
The idea is a simple one, embodied in these 5 steps.
1. Take any 4 digit integer, reduce to its decimal digits.
2. Sort the digits in decreasing order.
3. Flip the sequence of those digits, then recompose the two sets of sorted digits into 4 digit numbers. If there were any 0 digits, they will become leading zeros on the smaller number. In this case, a leading zero is acceptable to consider a number as a 4 digit integer.
4. Subtract the two numbers, smaller from the larger. The result will always have no more than 4 decimal digits. If it is less than 1000, then presume there are leading zero digits.
5. If necessary, repeat the above operation, until the result converges to a stable result, or until you see a cycle.
Since this process is deterministic, and must always result in a new 4 digit integer, it must either terminate at either an absorbing state, or in a cycle.
For example, consider the number 6174.
7641 - 1467
We get 6174 directly back. That seems rather surprising to me. But even more interesting is you will find all 4 digit numbers (excluding the pure rep-digit nmbers) will always terminate at 6174, after at most a few steps. For example, if we start with 1234
4321 - 1234
8730 - 0378
8532 - 2358
and we see that after 3 iterations of this process, we end at 6174. Similarly, if we start with 9998, it too maps to 6174 after 5 iterations.
9998 ==> 999 ==> 8991 ==> 8082 ==> 8532 ==> 6174
Why should that happen? That is, why should 6174 always drop out in the end? Clearly, since this is a deterministic proces which always produces another 4 digit integer (Assuming we treat integers with a leading zero as 4 digit integers), we must either end in some cycle, or we must end at some absorbing state. But for all (non-pure rep-digit) starting points to end at the same place, it seems just a bit surprising.
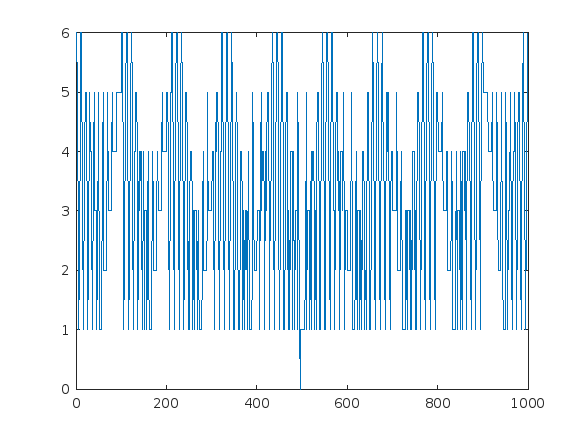
I always like to start a problem by working on a simpler problem, and see if it gives me some intuition about the process. I'll do the same thing here, but with a pair of two digit numbers. There are 100 possible two digit numbers, since we must treat all one digit numbers as having a "tens" digit of 0.
N = (0:99)';
Next, form the Kaprekar mapping for 2 digit numbers. This is easier than you may think, since we can do it in a very few lines of code on all possible inputs.
Ndig = dec2base(N,10,2) - '0';
Nmap = sort(Ndig,2,'descend')*[10;1] - sort(Ndig,2,'ascend')*[10;1];
I'll turn it into a graph, so we can visualize what happens. It also gives me an excuse to employ a very pretty set of tools in MATLAB.
G2 = graph(N+1,Nmap+1,[],cellstr(dec2base(N,10,2)));
plot(G2)
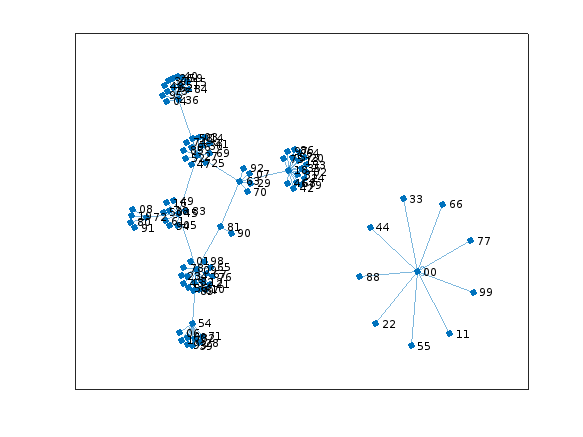
Do you see what happens? All of the rep-digit numbers, like 11, 44, 55, etc., all map directly to 0, and they stay there, since 0 also maps into 0. We can see that in the star on the lower right.
G2cycles = cyclebasis(G2)
G2cycles{1}
All other numbers eventually end up in the cycle:
G2cycles{2}
That is
81 ==> 63 ==> 27 ==> 45 ==> 09 ==> and back to 81
looping forever.
Another way of trying to visualize what happens with 2 digit numbers is to use symbolics. Thus, if we assume any 2 digit number can be written as 10*T+U, where I'll assume T>=U, since we always sort the digits first
syms T U
(10*T + U) - (10*U+T)
So after one iteration for 2 digit numbers, the result maps ALWAYS to a new 2 digit number that is divisible by 9. And there are only 10 such 2 digit numbers that are divisible by 9. So the 2-digit case must resolve itself rather quickly.
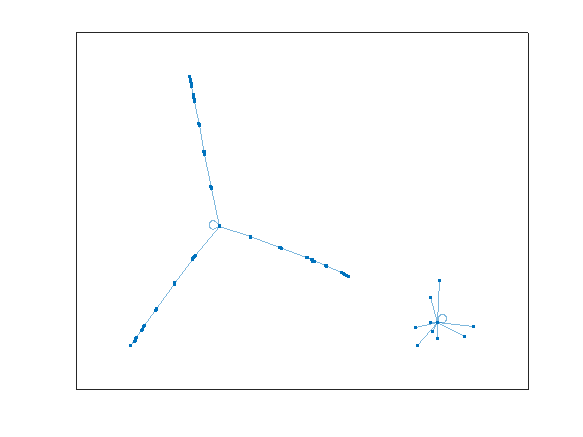
What happens when we move to 3 digit numbers? Note that for any 3 digit number abc (without loss of generality, assume a >= b >= c) it almost looks like it reduces to the 2 digit probem, aince we have abc - cba. The middle digit will always cancel itself in the subtraction operation. Does that mean we should expect a cycle at the end, as happens with 2 digit numbers? A simple modification to our previous code will tell us the answer.
N = (0:999)';
Ndig = dec2base(N,10,3) - '0';
Nmap = sort(Ndig,2,'descend')*[100;10;1] - sort(Ndig,2,'ascend')*[100;10;1];
G3 = graph(N+1,Nmap+1,[],cellstr(dec2base(N,10,2)));
plot(G3)
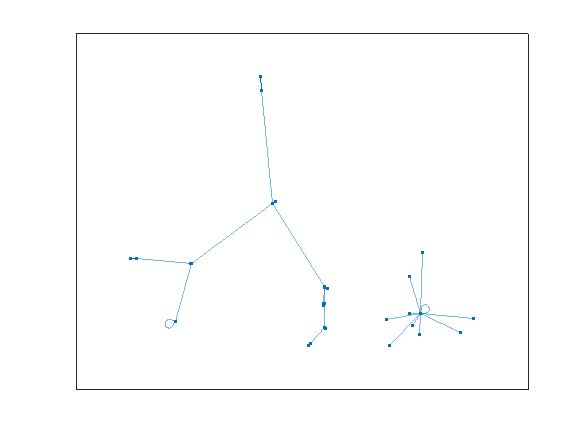
This one is more difficult to visualize, since there are 1000 nodes in the graph. However, we can clearly see two disjoint groups.
We can use cyclebasis to tell us the complete story again.
G3cycles = cyclebasis(G3)
G3cycles{:}
And we see that all 3 digit numbers must either terminate at 000, or 495. For example, if we start with 181, we would see:
811 - 118
963 - 369
954 - 459
It will terminate there, forever trapped at 495. And cyclebasis tells us there are no other cycles besides the boring one at 000.
What is the maximum length of any such path to get to 495?
D3 = distances(G3,496) % Remember, MATLAB uses an index origin of 1
D3(isinf(D3)) = -inf; % some nodes can never reach 495, so they have an infinite distance
plot(D3)
The maximum number of steps to get to 495 is 6 steps.
find(D3 == 6) - 1
So the 3 digit number 100 required 6 iterations to eventually reach 495.
shortestpath(G3,101,496) - 1
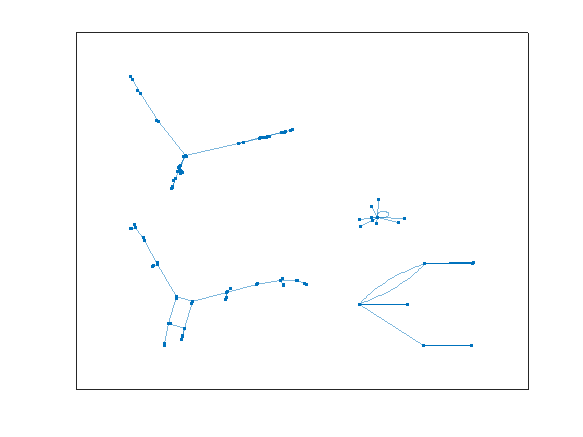
I think I've rather exhausted the 3 digit case. It is time now to move to the 4 digit problem, but we've already done all the hard work. The same scheme will apply to compute a graph. And the graph theory tools do all the hard work for us.
N = (0:9999)';
Ndig = dec2base(N,10,4) - '0';
Nmap = sort(Ndig,2,'descend')*[1000;100;10;1] - sort(Ndig,2,'ascend')*[1000;100;10;1];
G4 = graph(N+1,Nmap+1,[],cellstr(dec2base(N,10,2)));
plot(G4)
cyclebasis(G4)
ans{:}
And here we see the behavior, with one stable final point, 6174 as the only non-zero ending state. There are no circular cycles as we had for the 2-digit case.
How many iterations were necessary at most before termination?
D4 = distances(G4,6175);
D4(isinf(D4)) = -inf;
plot(D4)
The plot tells the story here. The maximum number of iterations before termination is 7 for the 4 digit case.
find(D4 == 7,1,'last') - 1
shortestpath(G4,9986,6175) - 1
Can you go further? Are there 5 or 6 digit Kaprekar constants? Sadly, I have read that for more than 4 digits, things break down a bit, there is no 5 digit (or higher) Kaprekar constant.
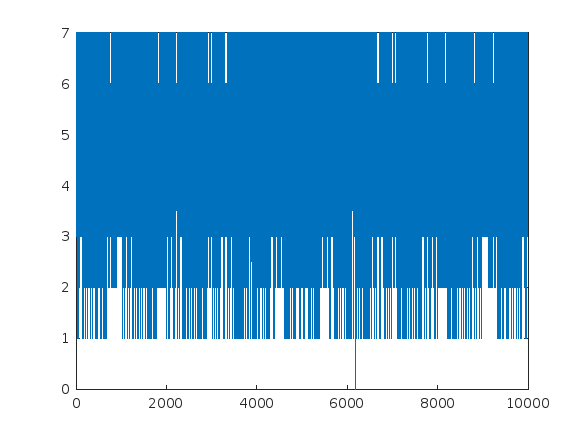
We can verify that fact, at least for 5 digit numbers.
N = (0:99999)';
Ndig = dec2base(N,10,5) - '0';
Nmap = sort(Ndig,2,'descend')*[10000;1000;100;10;1] - sort(Ndig,2,'ascend')*[10000;1000;100;10;1];
G5 = graph(N+1,Nmap+1,[],cellstr(dec2base(N,10,2)));
plot(G5)
cyclebasis(G5)
ans{:}
The result here are 4 disjoint cycles. Of course the rep-digit cycle must always be on its own, but the other three cycles are also fully disjoint, and are of respective length 2, 4, and 4.
I've been working on some matrix problems recently(Problem 55225)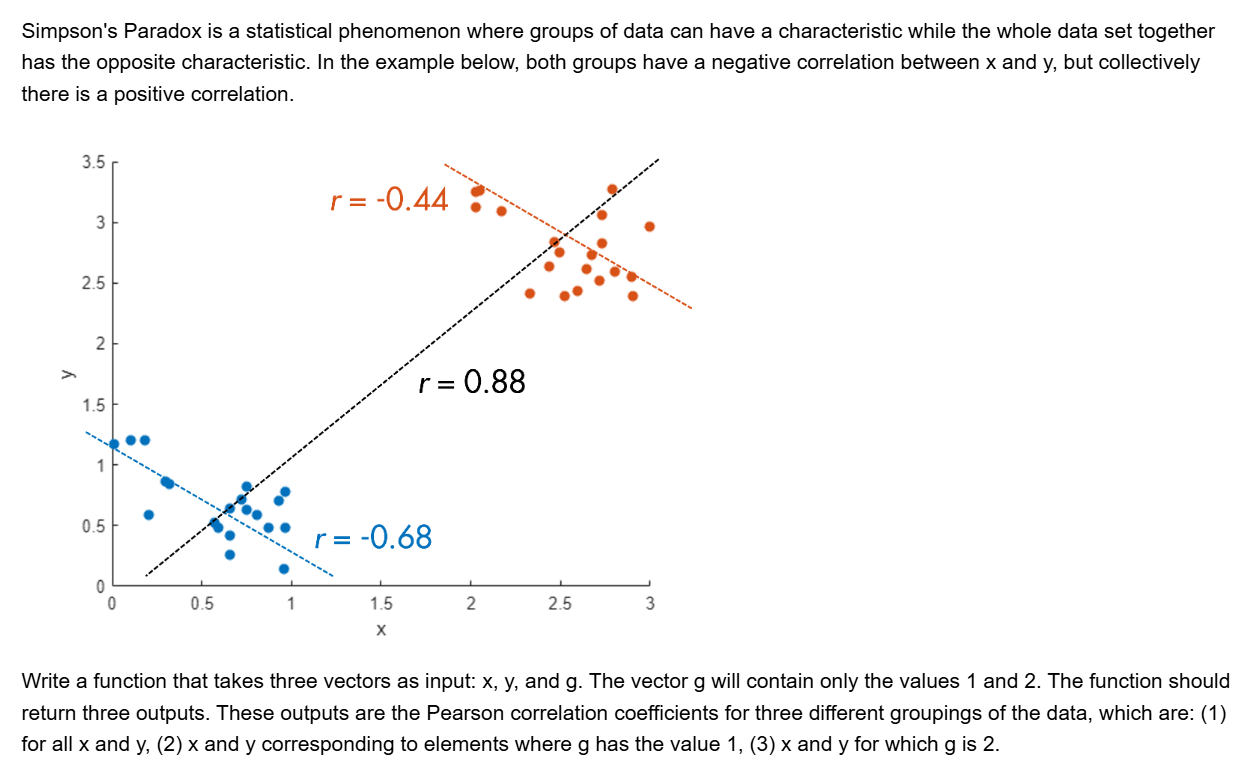
and this is my code
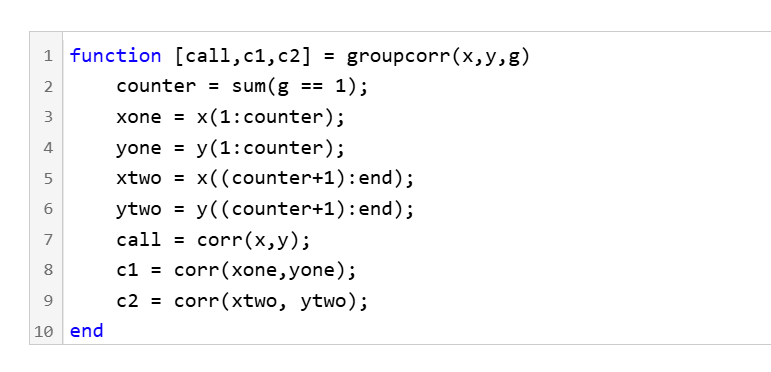
It turns out that "Undefined function 'corr' for input arguments of type 'double'." However, should't the input argument of "corr" be column vectors with single/double values? What's even going on there?
It's been over six years since I've written any serious MATLAB code, so I thought it would be fun to see how easily ChatGPT could help me out. While others have probably already used ChatGPT to generate MATLAB code, I didn't find any evidence of it when I searched through the ThingSpeak forum. That inspired me to post an example to get people thinking about it.
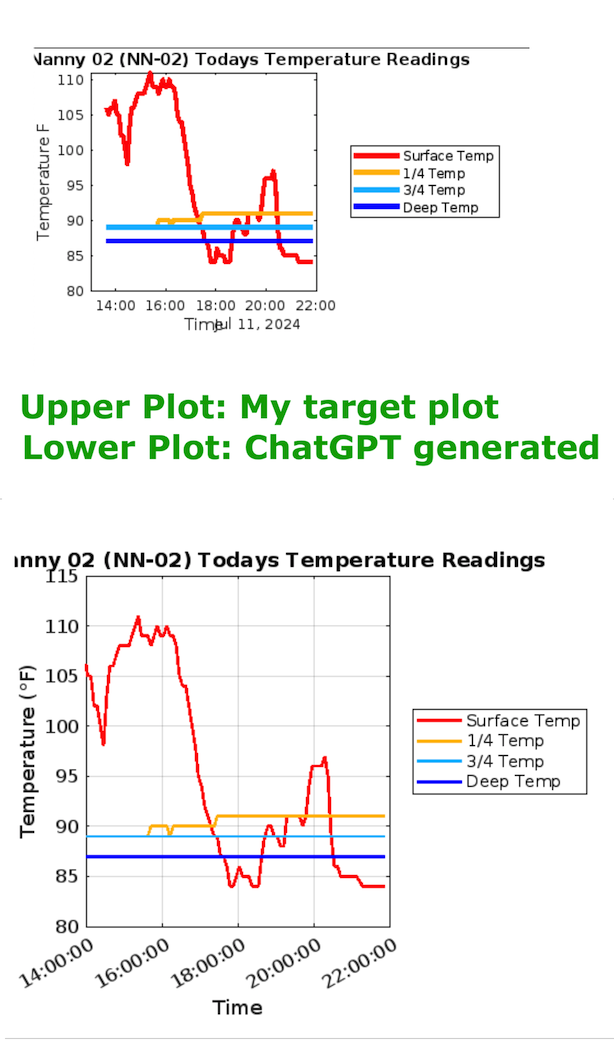
This example reads four temperature fields from the same channel and plots them on a single graph.
My ChatGPT prompt:
The prompt is pretty straightforward and essentially walks through all the elements of the chart that I wanted. It's also important to consider any filtering or "data cleansing" that should be done. Since this was my first time doing this, I decided to use an existing plot I was already familiar with as my "target state".
The prompt: "I would like you to generate some MATLAB code to create what is called a MATLAB Visualization. Its purpose will be to generate a chart of 4 fields found in a ThingSpeak channel. The ThingSpeak channel name is "Nest Nanny 2 (NN-02)" and its channel id (needed for the code) is xxxxxxx. The read api key is XXXXXXXXXXXXXXXX. The chart title should be "Nest Nanny 02 (NN-02) Todays Temperature Readings" It should plot data from 4 fields (field 3 - 6) who's names are "Surface Temp", "1/4 Temp", "3/4 Temp", and "Deep Temp". I would like the plot lines for these 4 fields to be different colors (red, orange, cyan, and blue) but on the same chart. I would like Temperature in Fahrenheit to be on the Y axis and Time on the x axis. I would like it to display the last 100 data points. I'd like to use this colororder. colororder(["#FF0000","#FFBB00","#00BBFF", "#0000FF"]) I would like the legend to be to the right of the chart, not contained within the chart. No temperature data should have a value of 50 or less and we can assume it's a sensor issue when this is observed. If a data value is 50 or less, use the value of it's nearest (in the time series) non-zero, non-negative value for that field. The data is stored in the channel as Fahrenheit and does not need to be converted from Celsius. "
Because I did this exercise using an existing plot and had a clear objective in mind, it was relatively quick to iterate four or five times with ChatGPT to refine my prompt. In just a few minutes, the generated plot almost perfectly matched my existing plot. (I xxxx'ed out the channel ID and API key before posting.) For someone who now only occasionally uses MATLAB, this approach saves time and will hopefully allow me to tap into elements of MATLAB that are now beyond my skill level and memory. ;)
ChatGPT generated MATLAB code:
% MATLAB code to create a ThingSpeak Visualization for temperature readings
% Define channel ID and Read API Key
channelID = xxxxxxx;
readAPIKey = 'XXXXXXXXXXXXXXXX';
% Number of data points to retrieve
numPoints = 100;
% Read data from the ThingSpeak channel for fields 3 to 6
[data, time] = thingSpeakRead(channelID, ...
'Fields', [3 4 5 6], ...
'NumPoints', numPoints, ...
'ReadKey', readAPIKey);
% Replace any value 50 or less with the nearest non-zero, non-negative value
for i = 1:size(data, 2)
% Identify indices where the data is 50 or less
badIndices = find(data(:,i) <= 50);
% Identify indices where the data is valid (greater than 50)
validIndices = find(data(:,i) > 50);
% Interpolate to replace bad values
if ~isempty(validIndices)
data(badIndices, i) = interp1(validIndices, data(validIndices, i), badIndices, 'linear', 'extrap');
end
end
% Plot the data
figure;
colororder(["#FF0000","#FFBB00","#00BBFF", "#0000FF"]); % Set the color order
plot(time, data(:,1), 'LineWidth', 2); hold on;
plot(time, data(:,2), 'LineWidth', 2);
plot(time, data(:,3), 'LineWidth', 2);
plot(time, data(:,4), 'LineWidth', 2);
hold off;
% Add labels and title
xlabel('Time');
ylabel('Temperature (°F)');
title('Nest Nanny 02 (NN-02) Todays Temperature Readings');
% Add legend and move it to the right of the chart
legend({'Surface Temp', '1/4 Temp', '3/4 Temp', 'Deep Temp'}, ...
'Location', 'eastoutside');
% Format the time on the x-axis
datetick('x', 'HH:MM:SS', 'keepticks');
grid on;
% Adjust the figure for better readability
set(gca, 'FontSize', 12);
Plot Comparison:
I am creating an ESP32 device which will upload data to thingspeak channel and I want the data to be displayed on my website after login. I have succesfully completed the first part of uploading the data to thingspeak. Any suggestions with second part will be very much appreciated.
Hi,
I tried several times to clear my channel data.
I would expect, when I click on Channel settings-clear channel all data from the channel is gone.
For me the data stay in. Delete channel works fine.
Is there a trick?
many thanks for your help
HEP
I'm almost embarressed enough to not ask this. :) I assumed sorting the "Updated" column in the "My Channels" view would sort my channels based on when data was last written to (last updated to) the channel
However, I have channels that have received date in August and yet the date/time stamp in the Uodated column displays a June date and therefore they sort in the wrong order. Does "update" mean something other than a data update, such as a settings update? If so, if there a way to sort the channels by the more recent data update?
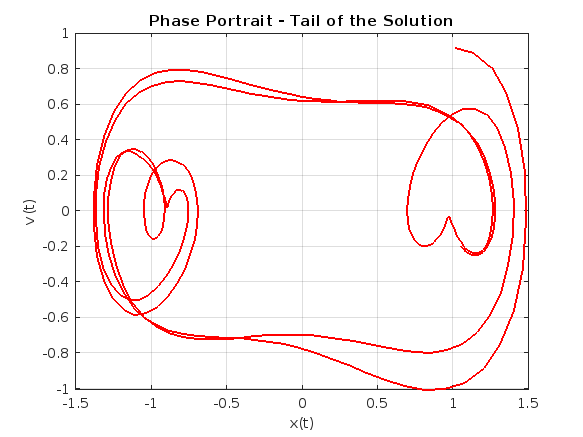
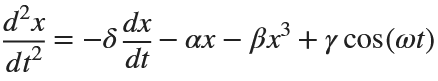
Following on from my previous post The Non-Chaotic Duffing Equation, now we will study the chaotic behaviour of the Duffing Equation
P.s:Any comments/advice on improving the code is welcome.
The Original Duffing Equation is the following:
Let 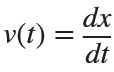 . This implies that
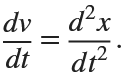
Then we rewrite it as a System of First-Order Equations
Using the substitution  for
for  , the second-order equation can be transformed into the following system of first-order equations:
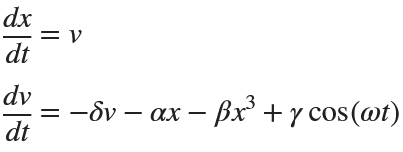
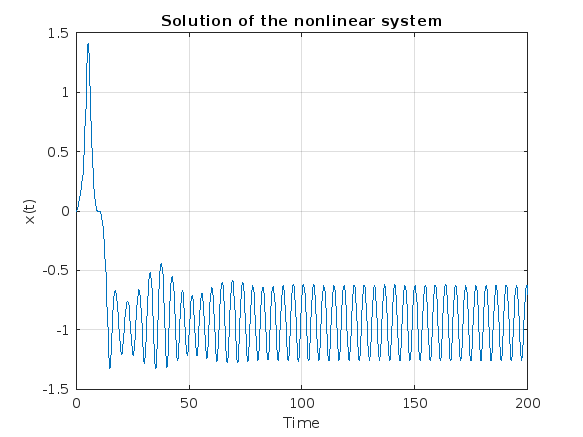
Exploring the Effect of γ.
% Define parameters
gamma = 0.1;
alpha = -1;
beta = 1;
delta = 0.1;
omega = 1.4;
% Define the system of equations
odeSystem = @(t, y) [y(2);
-delta*y(2) - alpha*y(1) - beta*y(1)^3 + gamma*cos(omega*t)];
% Initial conditions
y0 = [0; 0]; % x(0) = 0, v(0) = 0
% Time span
tspan = [0 200];
% Solve the system
[t, y] = ode45(odeSystem, tspan, y0);
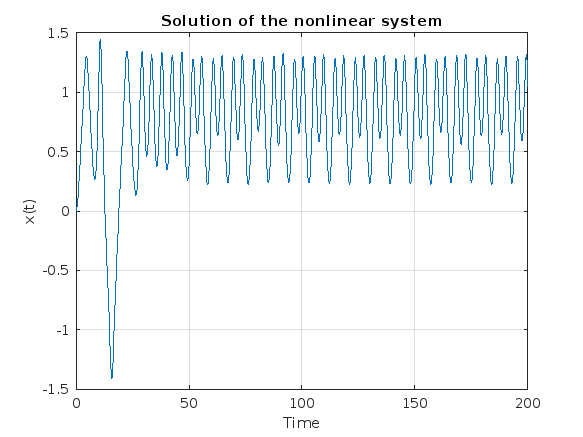
% Plot the results
figure;
plot(t, y(:, 1));
xlabel('Time');
ylabel('x(t)');
title('Solution of the nonlinear system');
grid on;
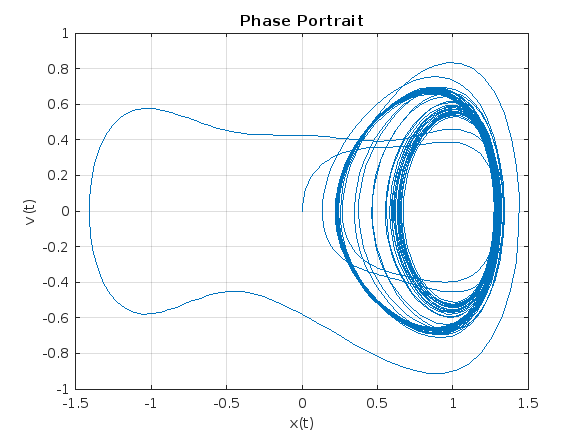
% Plot the phase portrait
figure;
plot(y(:, 1), y(:, 2));
xlabel('x(t)');
ylabel('v(t)');
title('Phase Portrait');
grid on;
% Define the tail (e.g., last 10% of the time interval)
tail_start = floor(0.9 * length(t)); % Starting index for the tail
tail_end = length(t); % Ending index for the tail
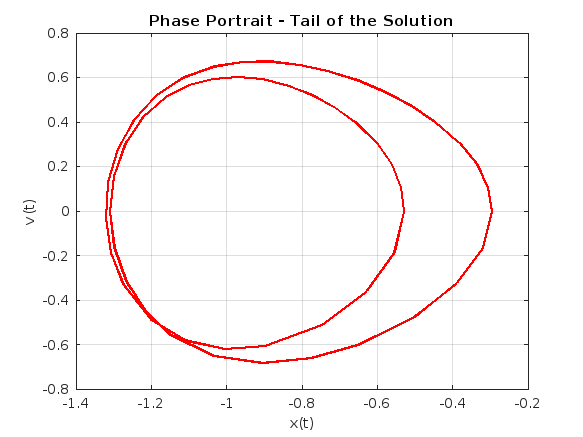
% Plot the tail of the solution
figure;
plot(y(tail_start:tail_end, 1), y(tail_start:tail_end, 2), 'r', 'LineWidth', 1.5);
xlabel('x(t)');
ylabel('v(t)');
title('Phase Portrait - Tail of the Solution');
grid on;
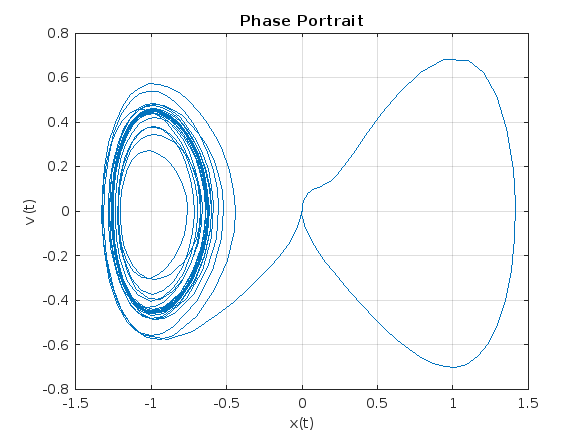
% Define parameters
gamma = 0.318;
alpha = -1;
beta = 1;
delta = 0.1;
omega = 1.4;
% Define the system of equations
odeSystem = @(t, y) [y(2);
-delta*y(2) - alpha*y(1) - beta*y(1)^3 + gamma*cos(omega*t)];
% Initial conditions
y0 = [0; 0]; % x(0) = 0, v(0) = 0
% Time span
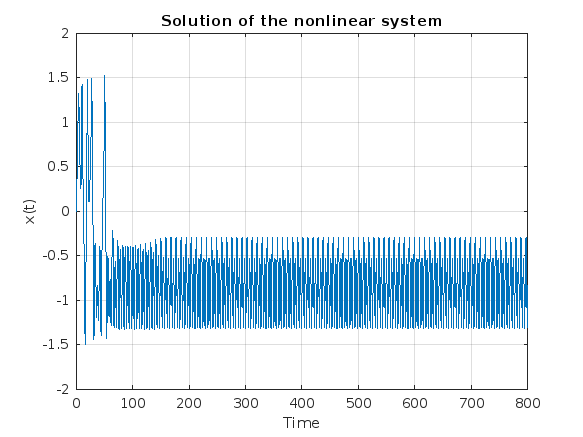
tspan = [0 800];
% Solve the system
[t, y] = ode45(odeSystem, tspan, y0);
% Plot the results
figure;
plot(t, y(:, 1));
xlabel('Time');
ylabel('x(t)');
title('Solution of the nonlinear system');
grid on;
% Plot the phase portrait
figure;
plot(y(:, 1), y(:, 2));
xlabel('x(t)');
ylabel('v(t)');
title('Phase Portrait');
grid on;
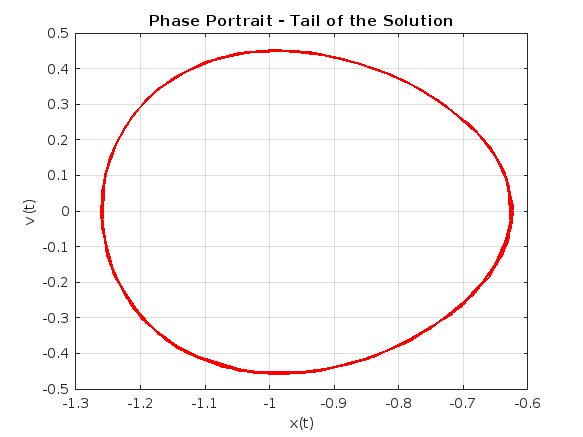
% Define the tail (e.g., last 10% of the time interval)
tail_start = floor(0.9 * length(t)); % Starting index for the tail
tail_end = length(t); % Ending index for the tail
% Plot the tail of the solution
figure;
plot(y(tail_start:tail_end, 1), y(tail_start:tail_end, 2), 'r', 'LineWidth', 1.5);
xlabel('x(t)');
ylabel('v(t)');
title('Phase Portrait - Tail of the Solution');
grid on;
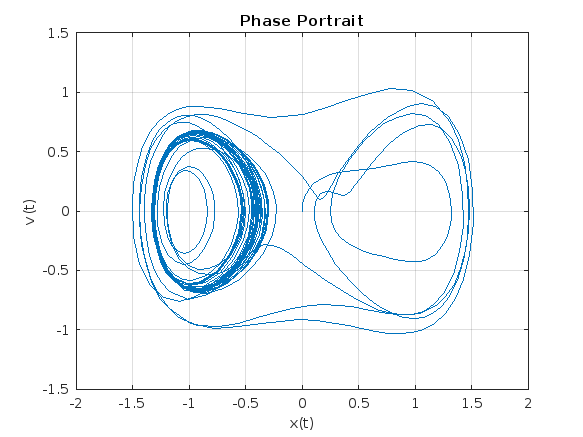
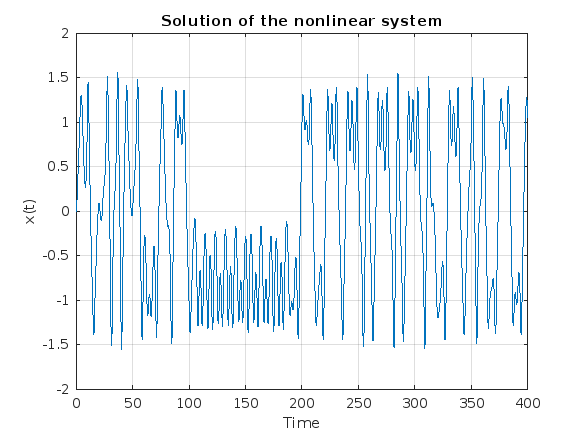
% Define parameters
gamma = 0.338;
alpha = -1;
beta = 1;
delta = 0.1;
omega = 1.4;
% Define the system of equations
odeSystem = @(t, y) [y(2);
-delta*y(2) - alpha*y(1) - beta*y(1)^3 + gamma*cos(omega*t)];
% Initial conditions
y0 = [0; 0]; % x(0) = 0, v(0) = 0
% Time span with more points for better resolution
tspan = linspace(0, 200,2000); % Increase the number of points
% Solve the system
[t, y] = ode45(odeSystem, tspan, y0);
% Plot the results
figure;
plot(t, y(:, 1));
xlabel('Time');
ylabel('x(t)');
title('Solution of the nonlinear system');
grid on;
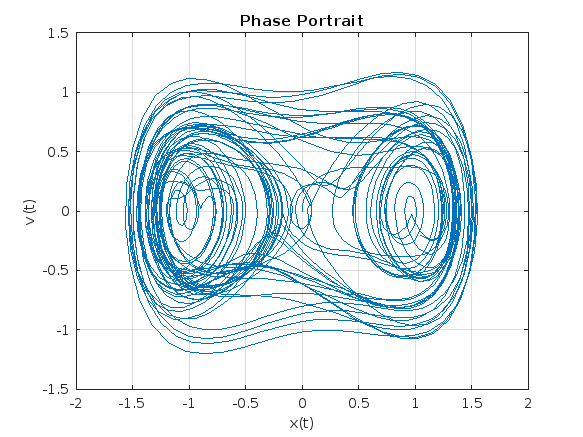
% Plot the phase portrait
figure;
plot(y(:, 1), y(:, 2));
xlabel('x(t)');
ylabel('v(t)');
title('Phase Portrait');
grid on;
% Define the tail (e.g., last 10% of the time interval)
tail_start = floor(0.9 * length(t)); % Starting index for the tail
tail_end = length(t); % Ending index for the tail
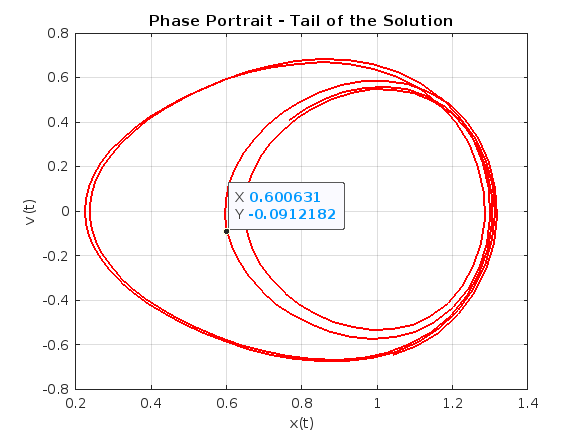
% Plot the tail of the solution
figure;
plot(y(tail_start:tail_end, 1), y(tail_start:tail_end, 2), 'r', 'LineWidth', 1.5);
xlabel('x(t)');
ylabel('v(t)');
title('Phase Portrait - Tail of the Solution');
grid on;
ax = gca;
chart = ax.Children(1);
datatip(chart,0.5581,-0.1126);
% Define parameters
gamma = 0.35;
alpha = -1;
beta = 1;
delta = 0.1;
omega = 1.4;
% Define the system of equations
odeSystem = @(t, y) [y(2);
-delta*y(2) - alpha*y(1) - beta*y(1)^3 + gamma*cos(omega*t)];
% Initial conditions
y0 = [0; 0]; % x(0) = 0, v(0) = 0
% Time span with more points for better resolution
tspan = linspace(0, 400,3000); % Increase the number of points
% Solve the system
[t, y] = ode45(odeSystem, tspan, y0);
% Plot the results
figure;
plot(t, y(:, 1));
xlabel('Time');
ylabel('x(t)');
title('Solution of the nonlinear system');
grid on;
% Plot the phase portrait
figure;
plot(y(:, 1), y(:, 2));
xlabel('x(t)');
ylabel('v(t)');
title('Phase Portrait');
grid on;
% Define the tail (e.g., last 10% of the time interval)
tail_start = floor(0.9 * length(t)); % Starting index for the tail
tail_end = length(t); % Ending index for the tail
% Plot the tail of the solution
figure;
plot(y(tail_start:tail_end, 1), y(tail_start:tail_end, 2), 'r', 'LineWidth', 1.5);
xlabel('x(t)');
ylabel('v(t)');
title('Phase Portrait - Tail of the Solution');
grid on;