Results for
I found this list on Book Authority about the top MATLAB books: https://bookauthority.org/books/best-matlab-books
My favorite book is Accelerating MATLAB Performance - 1001 tips to speed up MATLAB programs. I always pick something up from the book that helps me out.
A key aspect to masting MATLAB Graphics is getting a hang of the MATLAB Graphics Object Hierarchy which is essentially the structure of MATLAB figures that is used in the rendering pipeline. The base object is the Graphics Root (see groot) which contains the Figure. The Figure contains Axes or other containers such as a Tiled Chart Layout (see tiledlayout). Then these Axes can contain graphics primatives (the objects that contain data and get rendered) such as Lines or Patches.
Every graphics object has two important properties, the "Parent" and "Children" properties which can be used to access other objects in the tree. This can be very useful when trying to customize a pre-built chart (such as adding grid lines to both axes in an eye diagram chart) or when trying to access the axes of a non-current figure via a primative (so "gca" doesn't help out).
One last Tip and Trick with this is that you can declare graphics primatives without putting them on or creating an Axes by setting the first input argument to "gobjects(0)" which is an empty array of placeholder graphics objects. Then, when you have an Axes to plot the primitive on and are ready to render it, you can set the "Parent" of the object to your new Axes.
For Example:
l = line(gobjects(0), 1:10, 1:10);
...
...
...
l.Parent = gca;
Practicing navigating and exploring this tree will help propel your understanding of plotting in MATLAB.
One of my colleauges, Michio, recently posted an implementation of Pong Wars in MATLAB
- Here's the code on GitHub.https://lnkd.in/gZG-AsFX
- If you want to open with MATLAB Online, click here https://lnkd.in/gahrTMW5
- He saw this first here: https://lnkd.in/gu_Z-Pks
Making me wonder about variations. What might the resulting patterns look with differing numbers of balls? Different physics etc?
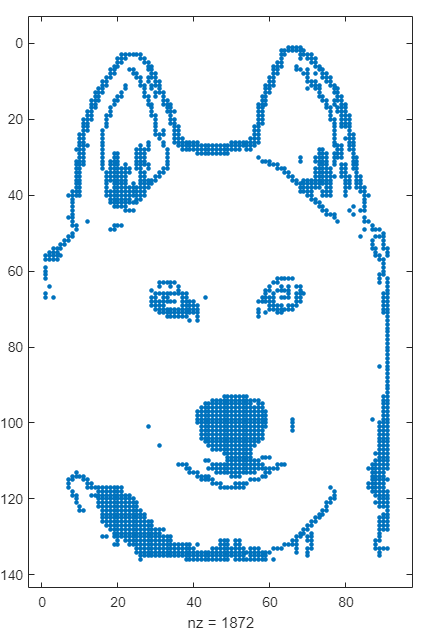
spy
I based my model construction on this PBPK model: PBPK by Armin Sepp. While this is a very convenient script for building a PBPK two-pore model, it's very incovenient for my application to have the species Units defined in molarity. Is there a convenient way to organically switch this model from molarity to grams (or any weight unit)?
Over at Reddit, a MATLAB user asked about when to use a script vs. a live script. How would you answer this?
Starting with MATLAB can be daunting, but the right resources make all the difference. In my experience, the combination of MATLAB Onramp and Cody offers an engaging start.
MATLAB Onramp introduces you to MATLAB's basic features and workflows. Then practice your coding skill on Cody. Challenge yourself to solve 1 basic problem every day for a month! This consistent practice can significantly enhance your proficiency.
What other resources have helped you on your MATLAB journey? Share your recommendations and let's create a comprehensive learning path for beginners!
I would tell myself to understand vectorization. MATLAB is designed for operating on whole arrays and matrices at once. This is often more efficient than using loops.
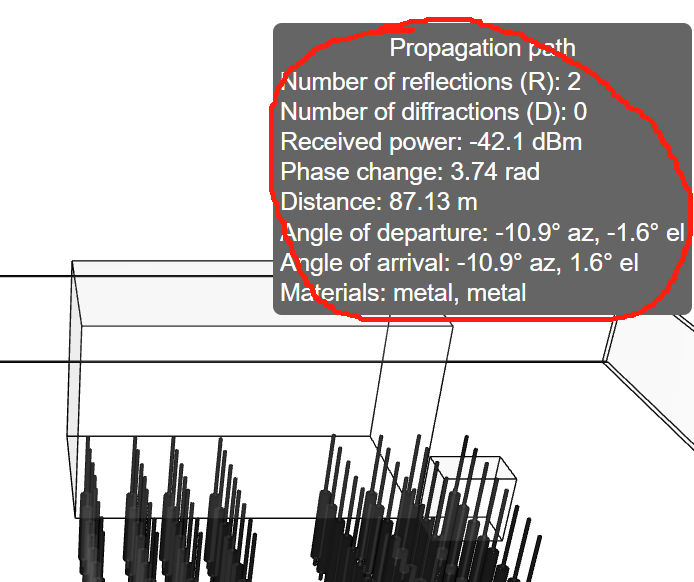
how can I do to get those informations?
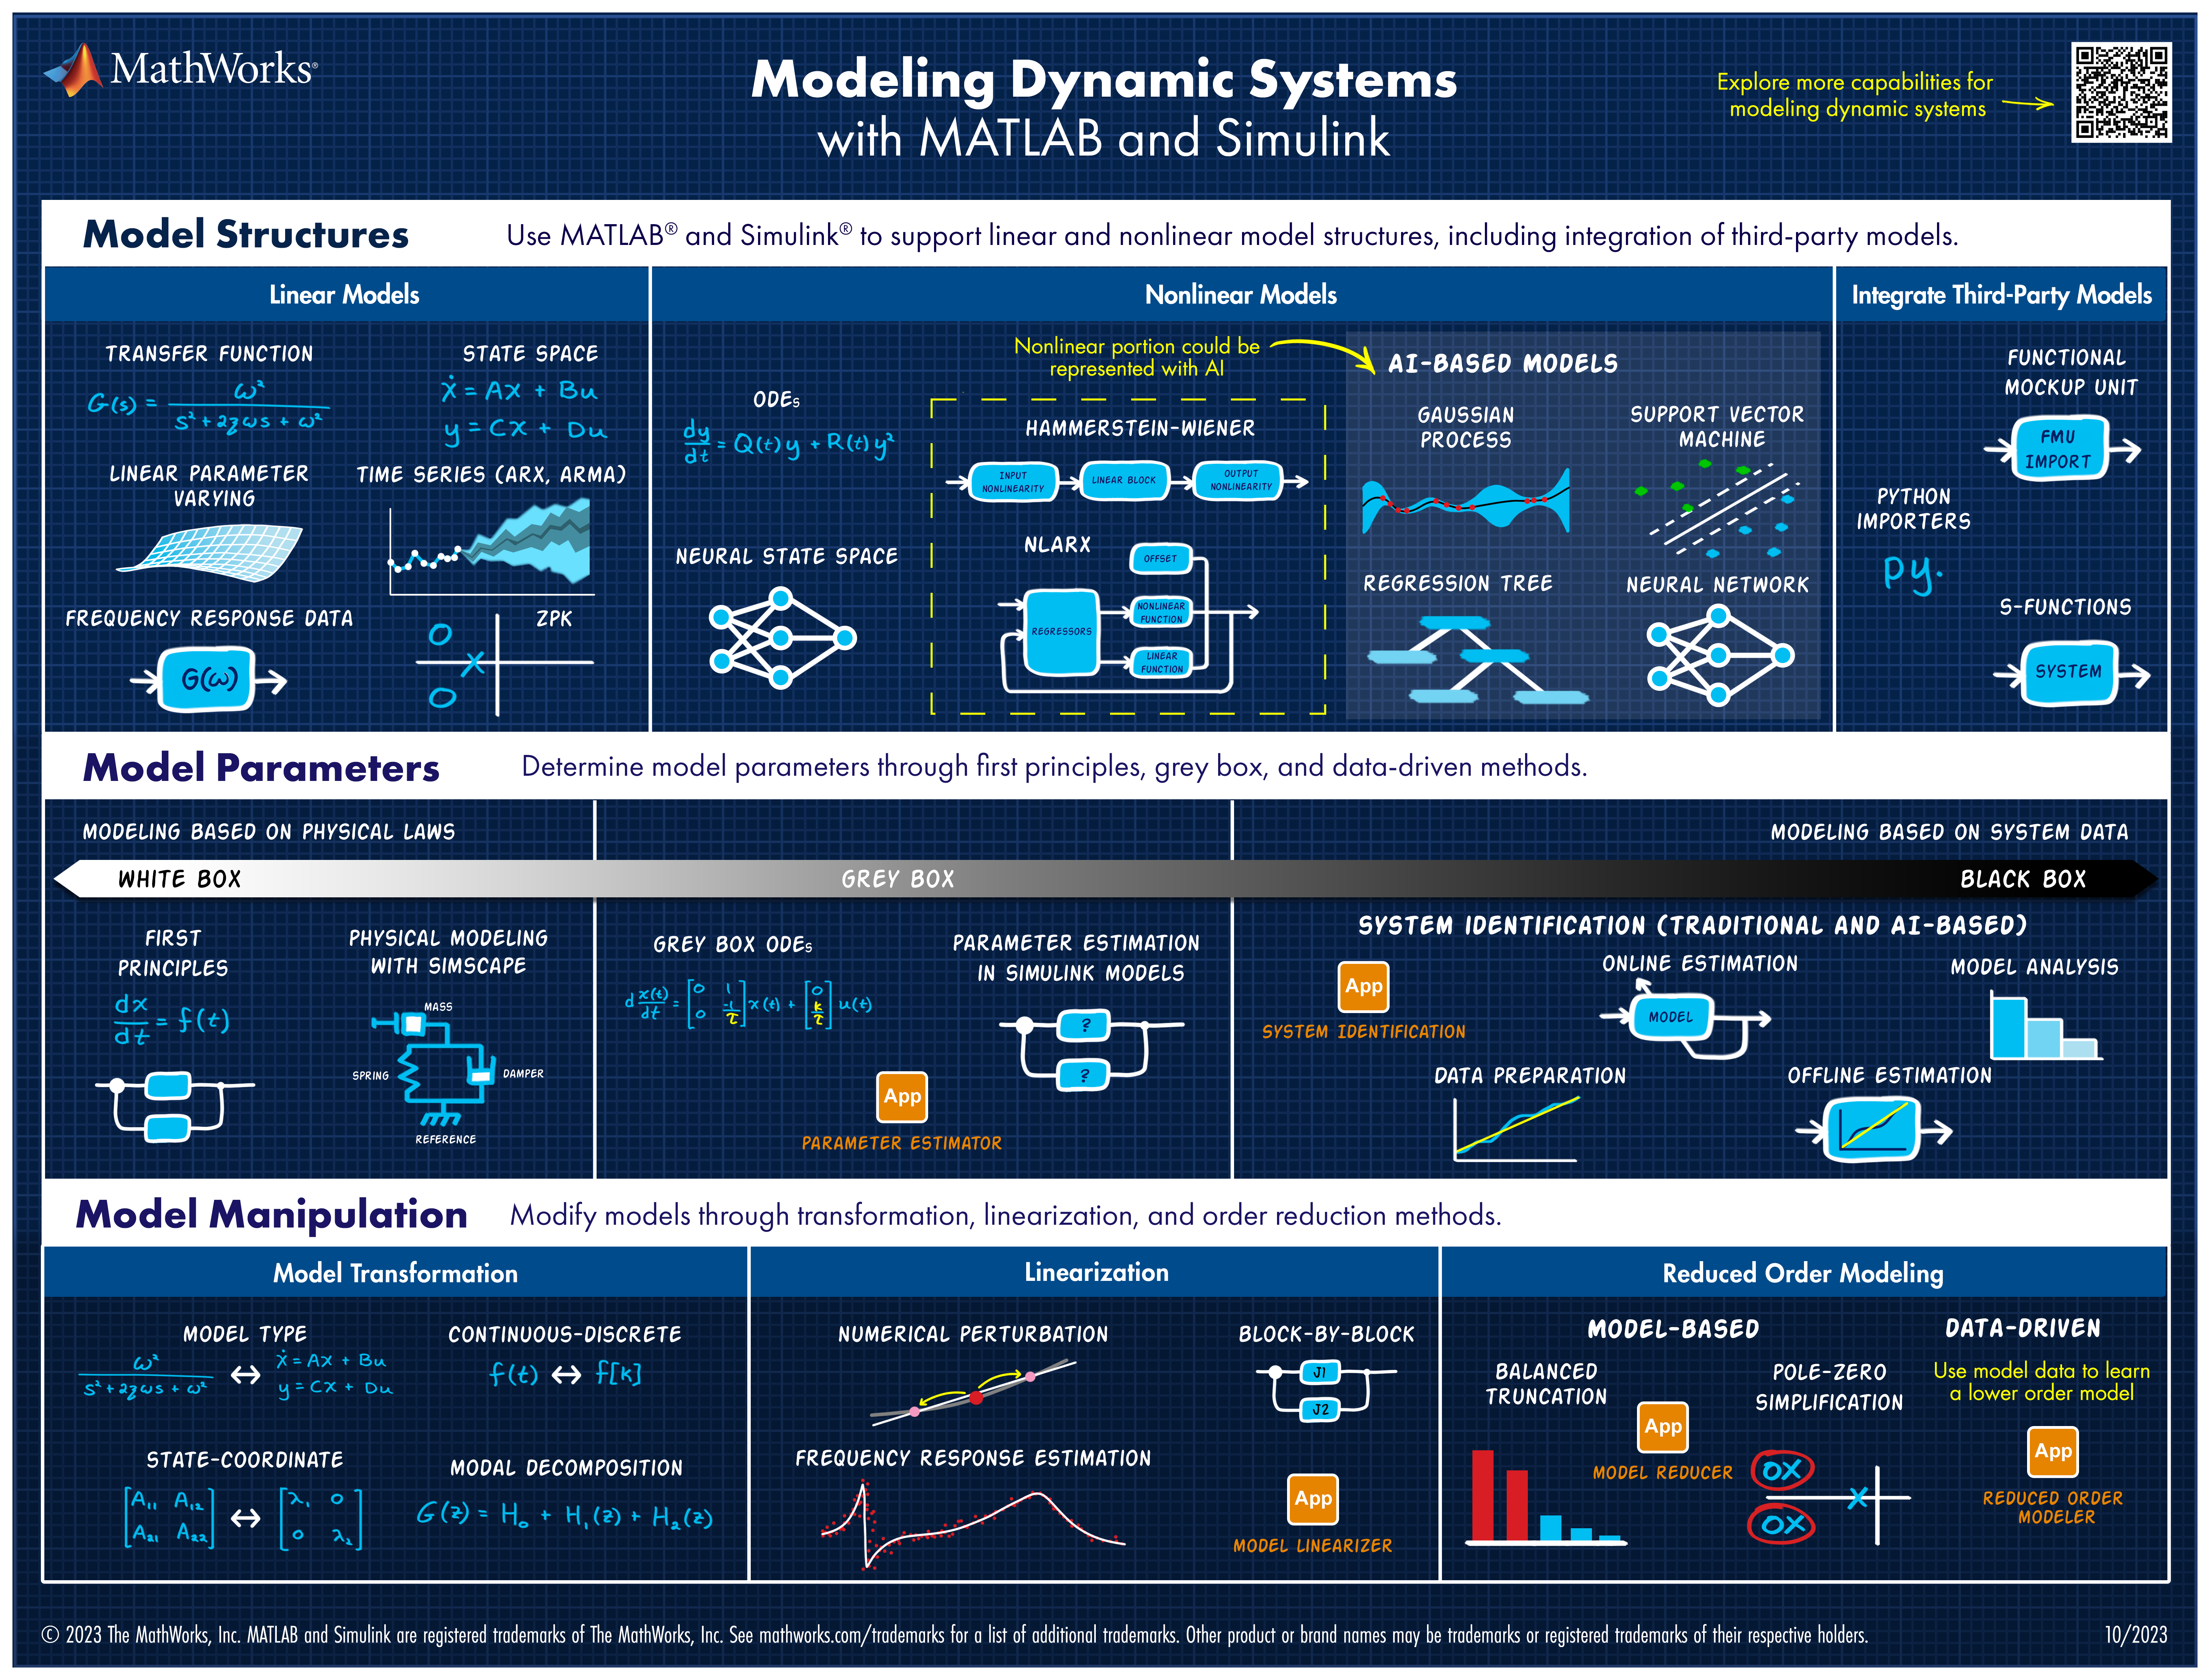
Explore all the capabilities for Modeling Dynamic Systems while keeping them handy with this Cheat Sheet - Download Now.
Hi! I'm new to pk modeling and Matlab. Can someone guide me through how to conduct population pk modeling based on pk parameters from non-human primate studies? Much thanks!!!!
The title is resonably non-descript, but I can explain it easily:
Say I have an initial Emax model:
v = emax1*[G]^n1/(ec501^n1+[G]^n1)
And I want to place v inside of a second Emax model:
y = emax2*v^n2/(ex502^n2+v^n2)
Currently, I have the full function of v inside y, twice, it's very long and whilst I only need to get it correct once, for readability in the future I'd rather have it in form #2. I've played around with non-constant parameters but I need the steady state to be v, not the rate rule, and I haven't worked out how to make a parameter shift to a form like v, as an observation might.
Are there any recommended solutions or do I simply need to keep with having v fully expressed in y?
Thank you,
Dan
Hi All,
I'm currently attempting to implement a Hodgkin-Huxley-type model of membrane potential, ideally I would like a species that represents the membrane potential as its own distinct entity, so as the reference elsewhere. I've currently established a molarity-based work around but it would be great if I could set the units for the species as millivolt, but that throws an error.
Is there an established way to do this? I imagine I'm not the first person to be trying to model a voltage-gated ion channel!
Thank you for your help.
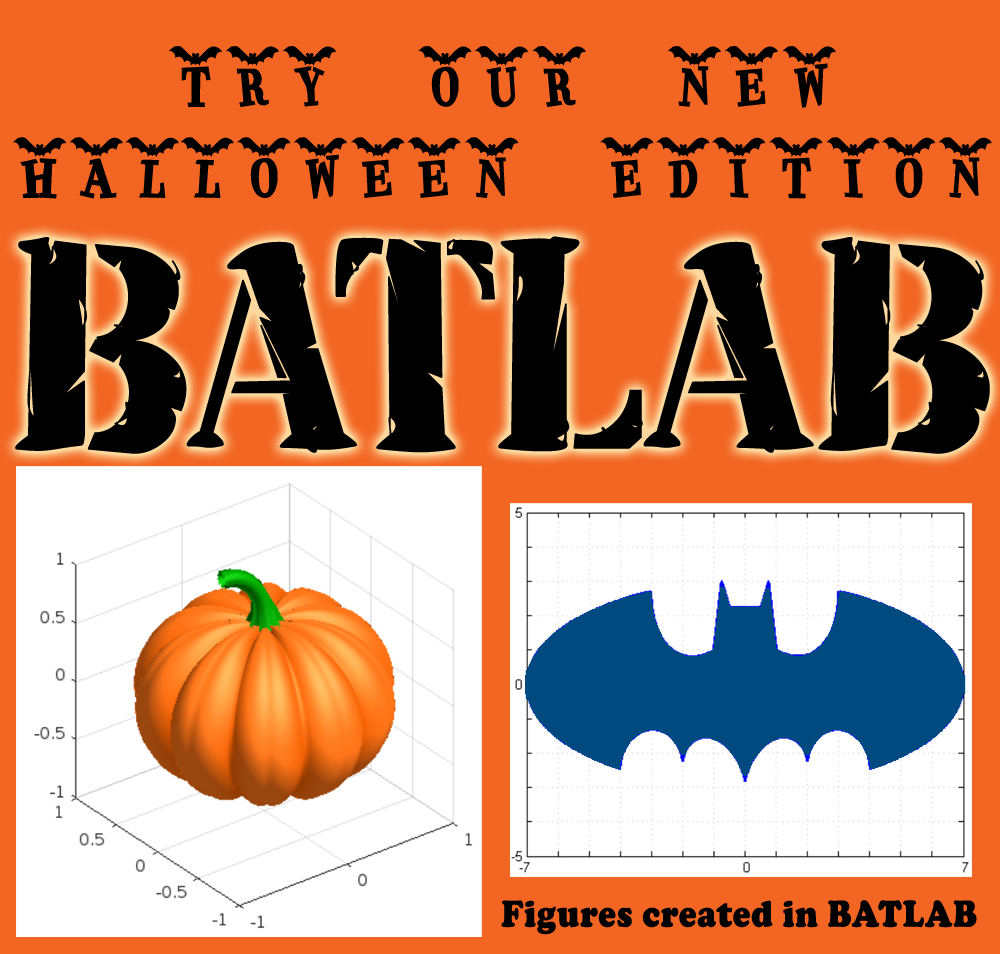

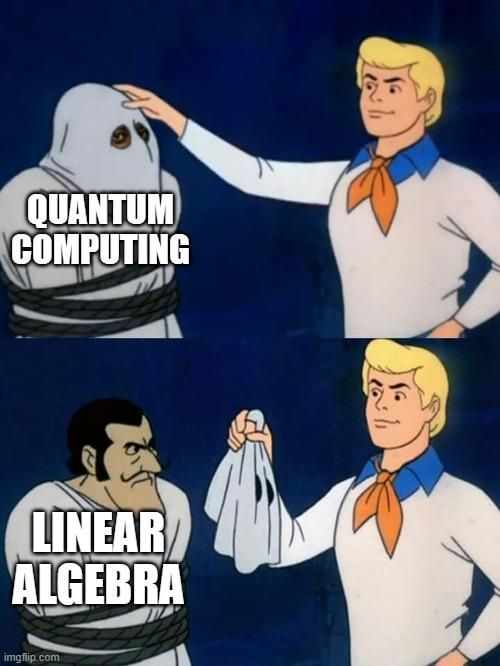
Share your fun photos in the comments!
Here's a MATLAB class I wrote that leverages the MATLAB Central Interface for MATLAB toolbox, which in turn uses the publicy available Community API. Using this class, I've created a few Favorites that show me what's going on in MATLAB Central - without having to leave MATLAB 🙂
The class has a few convenient queries:
- Results for the last 7 days
- Results for the last 30 days
- Results for the current month
- Results for today
And supporting a bunch of different content scopes:
- All MATLAB Central
- MATLAB Answers
- Blogs
- Cody
- Contests
- File Exchange
- Exclude Answers content
The results are displayed in the command window (which worked best for me) and link to each post. Here's what that looks like for this command
>> CommunityFeed.thisMonth("app designer", CommunityFeed.Scope.ExcludeAnswers)
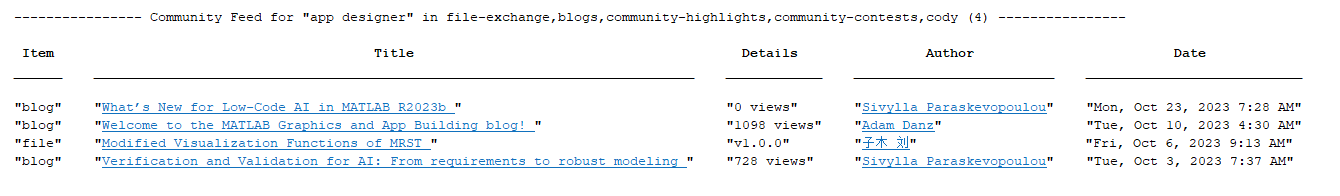
Let me know if you find this class useful and feel free to suggest changes.
Hello,
I've looked around and I haven't found anything obvious about this, but is it possible to link to species/reactions, graphically, in a non-mass transfer sense? I have areas in my model where it would conceptually make sense to be able to see that species or reactions are linked, but if I link them in the standard way it demands that it be involved in the stoichiometry.
Perhaps some kind of dotted line, or similar?
Thank you, best regards,
Dan
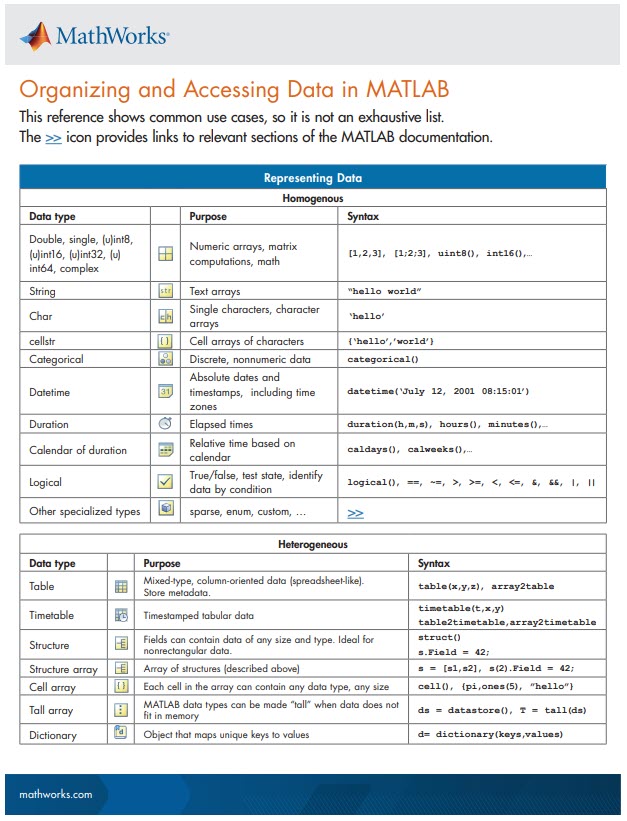
New Cheat Sheet Alert!
Level up your data organization and access skills in MATLAB with our latest cheat sheet! Download the full cheat sheet on MATLAB GitHub for Students here.


Wait for Walter, the rest of us are mere users.