Results for
I am thrilled python interoperability now seems to work for me with my APPLE M1 MacBookPro and MATLAB V2025a. The available instructions are still, shall we say, cryptic. Here is a summary of my interaction with GPT 4o to get this to work.
===========================================================
MATLAB R2025a + Python (Astropy) Integration on Apple Silicon (M1/M2/M3 Macs)
===========================================================
Author: D. Carlsmith, documented with ChatGPT
Last updated: July 2025
This guide provides full instructions, gotchas, and workarounds to run Python 3.10 with MATLAB R2025a (Apple Silicon/macOS) using native ARM64 Python and calling modules like Astropy, Numpy, etc. from within MATLAB.
===========================================================
Overview
===========================================================
- MATLAB R2025a on Apple Silicon (M1/M2/M3) runs as "maca64" (native ARM64).
- To call Python from MATLAB, the Python interpreter must match that architecture (ARM64).
- Using Intel Python (x86_64) with native MATLAB WILL NOT WORK.
- The cleanest solution: use Miniforge3 (Conda-forge's lightweight ARM64 distribution).
===========================================================
1. Install Miniforge3 (ARM64-native Conda)
===========================================================
In Terminal, run:
curl -LO https://github.com/conda-forge/miniforge/releases/latest/download/Miniforge3-MacOSX-arm64.sh
bash Miniforge3-MacOSX-arm64.sh
Follow prompts:
- Press ENTER to scroll through license.
- Type "yes" when asked to accept the license.
- Press ENTER to accept the default install location: ~/miniforge3
- When asked:
Do you wish to update your shell profile to automatically initialize conda? [yes|no]
Type: yes
===========================================================
2. Restart Terminal and Create a Python Environment for MATLAB
===========================================================
Run the following:
conda create -n matlab python=3.10 astropy numpy -y
conda activate matlab
Verify the Python path:
which python
Expected output:
/Users/YOURNAME/miniforge3/envs/matlab/bin/python
===========================================================
3. Verify Python + Astropy From Terminal
===========================================================
Run:
python -c "import astropy; print(astropy.__version__)"
Expected output:
6.x.x (or similar)
===========================================================
4. Configure MATLAB to Use This Python
===========================================================
In MATLAB R2025a (Apple Silicon):
clear classes
pyenv('Version', '/Users/YOURNAME/miniforge3/envs/matlab/bin/python')
py.sys.version
You should see the Python version printed (e.g. 3.10.18). No error means it's working.
===========================================================
5. Gotchas and Their Solutions
===========================================================
❌ Error: Python API functions are not available
→ Cause: Wrong architecture or broken .dylib
→ Fix: Use Miniforge ARM64 Python. DO NOT use Intel Anaconda.
❌ Error: Invalid text character (↑ points at __version__)
→ Cause: MATLAB can’t parse double underscores typed or pasted
→ Fix: Use: py.getattr(module, '__version__')
❌ Error: Unrecognized method 'separation' or 'sec'
→ Cause: MATLAB can't reflect dynamic Python methods
→ Fix: Use: py.getattr(obj, 'method')(args)
===========================================================
6. Run Full Verification in MATLAB
===========================================================
Paste this into MATLAB:
% Set environment
clear classes
pyenv('Version', '/Users/YOURNAME/miniforge3/envs/matlab/bin/python');
% Import modules
coords = py.importlib.import_module('astropy.coordinates');
time_mod = py.importlib.import_module('astropy.time');
table_mod = py.importlib.import_module('astropy.table');
% Astropy version
ver = char(py.getattr(py.importlib.import_module('astropy'), '__version__'));
disp(['Astropy version: ', ver]);
% SkyCoord angular separation
c1 = coords.SkyCoord('10h21m00s', '+41d12m00s', pyargs('frame', 'icrs'));
c2 = coords.SkyCoord('10h22m00s', '+41d15m00s', pyargs('frame', 'icrs'));
sep_fn = py.getattr(c1, 'separation');
sep = sep_fn(c2);
arcsec = double(sep.to('arcsec').value);
fprintf('Angular separation = %.3f arcsec\n', arcsec);
% Time difference in seconds
Time = time_mod.Time;
t1 = Time('2025-01-01T00:00:00', pyargs('format','isot','scale','utc'));
t2 = Time('2025-01-02T00:00:00', pyargs('format','isot','scale','utc'));
dt = py.getattr(t2, '__sub__')(t1);
seconds = double(py.getattr(dt, 'sec'));
fprintf('Time difference = %.0f seconds\n', seconds);
% Astropy table display
tbl = table_mod.Table(pyargs('names', {'a','b'}, 'dtype', {'int','float'}));
tbl.add_row({1, 2.5});
tbl.add_row({2, 3.7});
disp(tbl);
===========================================================
7. Optional: Automatically Configure Python in startup.m
===========================================================
To avoid calling pyenv() every time, edit your MATLAB startup:
edit startup.m
Add:
try
pyenv('Version', '/Users/YOURNAME/miniforge3/envs/matlab/bin/python');
catch
warning("Python already loaded.");
end
===========================================================
8. Final Notes
===========================================================
- This setup avoids all architecture mismatches.
- It uses a clean, minimal ARM64 Python that integrates seamlessly with MATLAB.
- Do not mix Anaconda (Intel) with Apple Silicon MATLAB.
- Use py.getattr for any Python attribute containing underscores or that MATLAB can't resolve.
You can now run NumPy, Astropy, Pandas, Astroquery, Matplotlib, and more directly from MATLAB.
===========================================================
Is it possible to create a Simulink model that is independent of specific microcontrollers?
For example, in the model, the STM32 block is used for CAN transmission. But if I want to deploy the same model to an Arduino, I have to replace the STM32 block with an Arduino-compatible one.
So, is it possible to create a custom block or abstraction that works across multiple microcontrollers like STM32, PIC32, and Arduino without changing the hardware-specific block each time?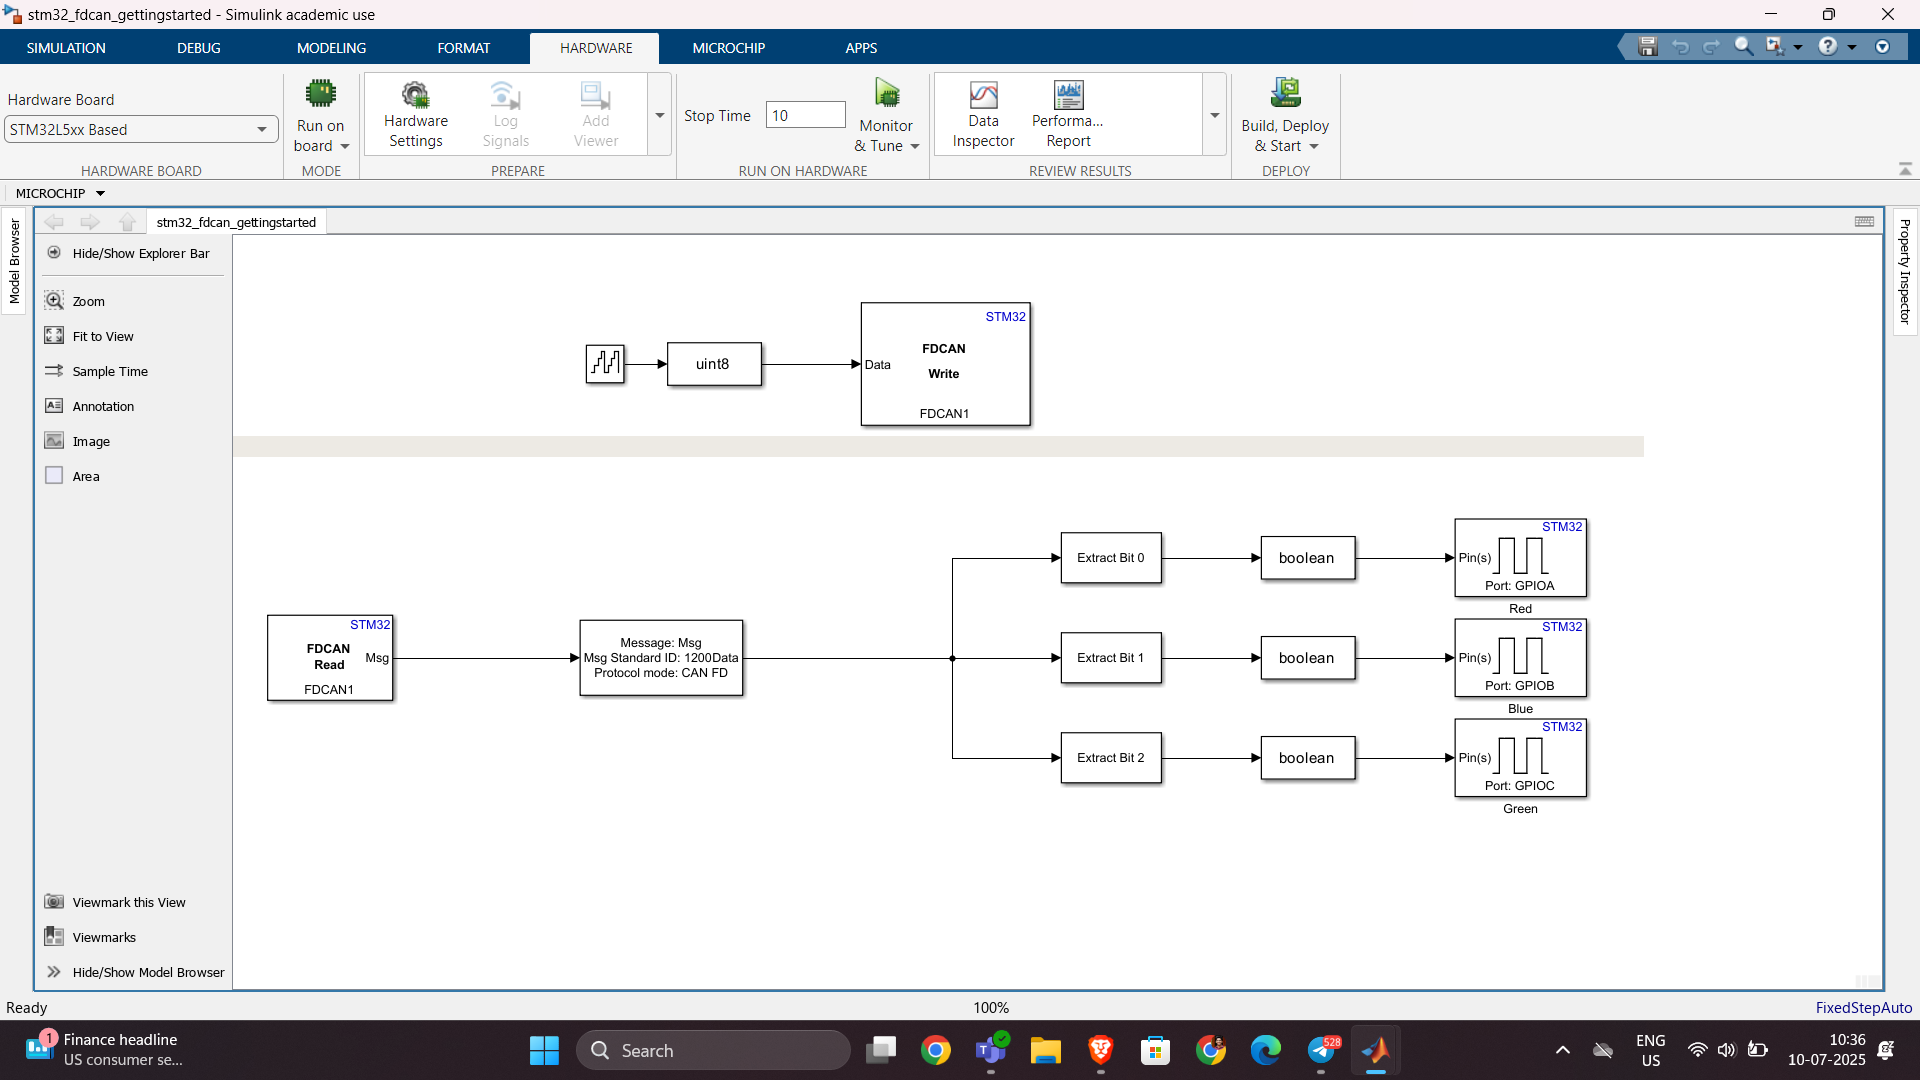
Hello,
I've successfully tested the Processor-in-the-Loop (PIL) workflow in Simulink using a TI F28069M LaunchPad, following the standard examples provided by MathWorks. The PIL block, code generation, and communication all worked without issues.
Now, I’d like to run a similar PIL setup using the Infineon TLE9879 EVALKIT (based on an ARM Cortex-M0), which is not officially supported by Simulink as a target.
I’m wondering if it’s possible to configure PIL manually or via custom workflows. For example:
- Can I create a custom PIL target using Embedded Coder?
- Would I need to port rtiostream manually for communication over UART?
- Could I somehow integrate with Keil µVision (which I use for TLE9879) to build and run the generated code?
- Is there a workaround to simulate PIL behavior using a non-supported board?
My setup:
- Simulink R2024b
- Infineon TLE9879 EVALKIT
- Keil µVision 5 + Infineon Config Wizard
- UART and JTAG interfaces available
The main purpose is to validate control algorithms and measure execution time, not to implement a full HIL system.
Has anyone attempted PIL with a custom or unsupported microcontroller before? Any tips or resources would be greatly appreciated. Thanks in advance!

Hey MATLAB enthusiasts!
I just stumbled upon this hilariously effective GitHub repo for image deformation using Moving Least Squares (MLS)—and it’s pure gold for anyone who loves playing with pixels! 🎨✨
- Real-Time Magic ✨
- Precomputes weights and deformation data upfront, making it blazing fast for interactive edits. Drag control points and watch the image warp like rubber! (2)
- Supports affine, similarity, and rigid deformations—because why settle for one flavor of chaos?
- Single-File Simplicity 🧩
- All packed into one clean MATLAB class (mlsImageWarp.m).
- Endless Fun Use Cases 🤹
- Turn your pet’s photo into a Picasso painting.
- "Fix" your friend’s smile... aggressively.
- Animate static images with silly deformations (1).
Try the Demo!
You are not a jedi yet !
20%
We not grant u the rank of master !
0%
Ready are u? What knows u of ready?
0%
May the Force be with you !
80%
5 votes
Sto tentando inutilmente di salvare il valore dell'enegia che consumo ogni giorno nel field5 di questo canale: https://thingspeak.mathworks.com/channels/2851490 , ma inutilemte in quanto vengono visualizzati sempre e solo 2 dati anche se ho impostato days=30. Ho provato ad aumentare a 365 ma senza variazioni. Come mai?
I saw this on Reddit and thought of the past mini-hack contests. We have a few folks here who can do something similar with MATLAB.

I had an error in the web version Matlab, so I exited and came back in, and this boy was plotted.
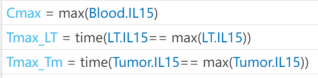
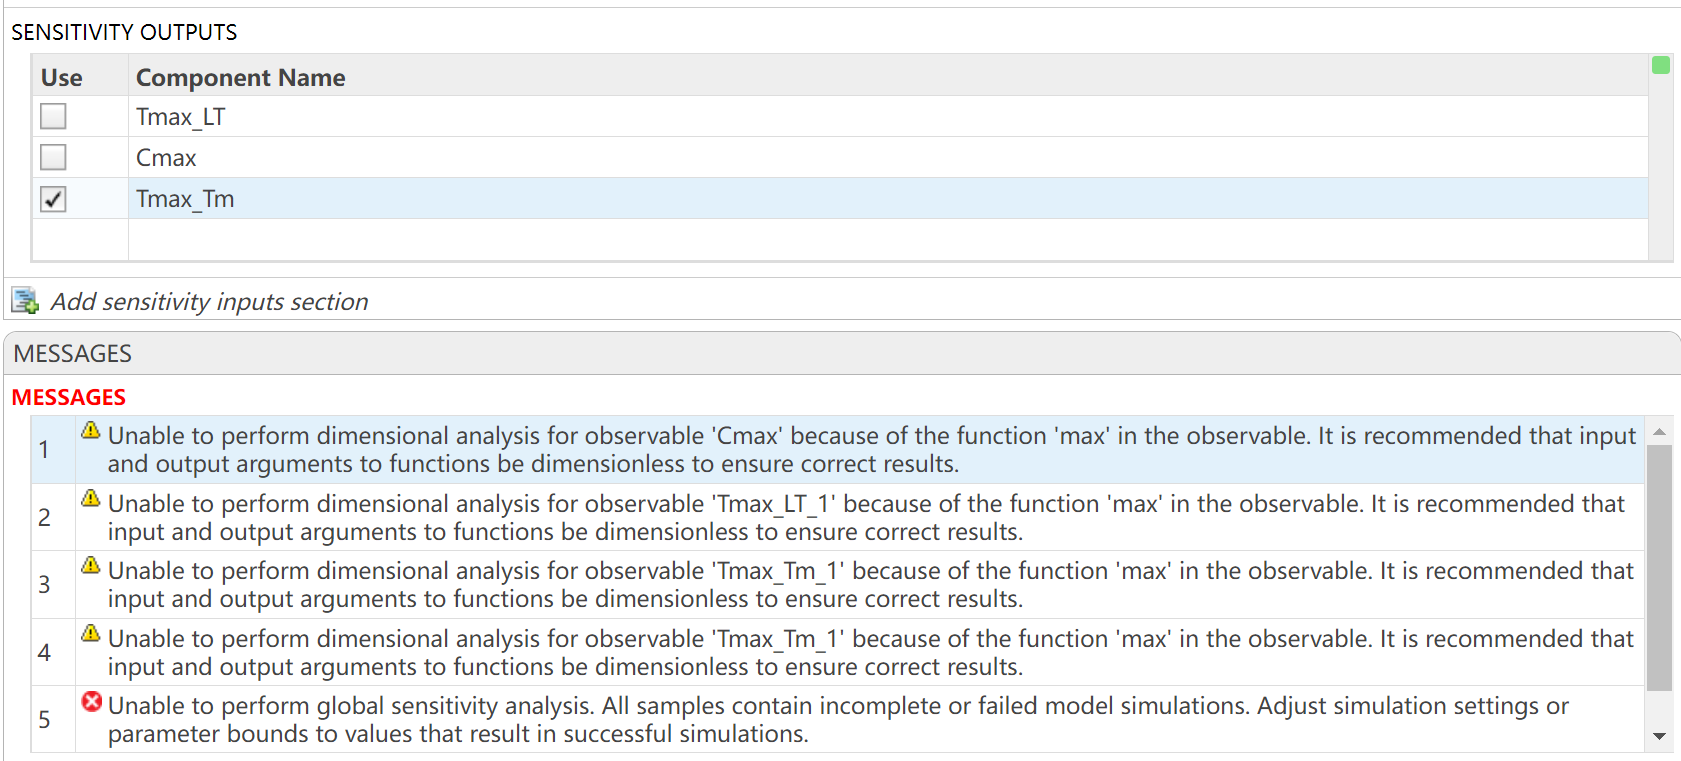
I want to observe the time (Tmax) to reach maximum drug concentration (Cmax) in my model. I have set up the OBSERVABLES as follows (figure1): Cmax = max(Blood.lL15); Tmax_LT = time(Conc_lL15_LT_nm == max(Conc_lL15_LT_nm)); Tmax_Tm = time(Conc_lL15_Tumor_nm == max(Conc_lL15_Tumor_nm)); After running the Sobol indices program for global sensitivity analysis, with inputs being some parameters and their ranges, the output for Cmax works, but there are some prompts, as shown in figure2. Additionally, when outputting Tmax, the program does not run successfully and reports some errors, as shown in figure2. How can I resolve the errors when outputting Tmax?
Bom dia se alguém puder me ajudar, meu código abaixo, não estou conseguintdo conectar o meu Esp8266 ao ThingSpeak, o erro tá na conexão. Estou usando o MicroPython e NodeMCU na plataforma Pytohn o sistema operacional Ubuntu 20
# DHT11 -> ESP8266/ESP32
# 1(Vcc) -> 3v3
# 2(Data) -> GPIO12
# 4(Gnd) -> Gnd
import time, network, machine
from dht import DHT11
from machine import Pin
from umqtt.simple import MQTTClient
print("Iniciando...")
dht = DHT11(Pin(12, Pin.IN, Pin.PULL_UP))
estacao = network.WLAN(network.STA_IF)
estacao.active(True)
estacao.connect('xxxxxxx', 'xxxxxxxxx')
while estacao.isconnected() == False:
machine.idle()
print('Conexao realizada.')
print(estacao.ifconfig())
SERVIDOR = "mqtt.thingspeak.com"
CHANNEL_ID = "XXXXXXXXXXXXXXXXX"
WRITE_API_KEY = "XXXXXXXXXXXXXXXXXXXXX"
topico = "channels/" + CHANNEL_ID + "/publish/" + WRITE_API_KEY
cliente = MQTTClient("umqtt_client", SERVIDOR)
try:
while True:
dht.measure()
temp = dht.temperature()
umid = dht.humidity()
print('Temperatura: %3.1f °C' %temp)
print('Umidade: %3.1f %%' %umid)
conteudo = "field1=" + str(temp) + "&field2=" + str(umid)
print ('Conectando a ThingSpeak...')
cliente.connect()
cliente.publish(topico, conteudo)
cliente.disconnect()
print ('Envio realizado.')
time.sleep(600.0)
except KeyboardInterrupt:
estacao.disconnect()
estacao.active(False)
print("Fim.")
*****************************************************************************************************
No shell aparece como resposta:
MPY: soft reboot
Iniciando...
Conexao realizada.
('192.168.0.23', '255.255.255.0', '192.168.0.1', '8.8.8.8')
Temperatura: 29.0 °C
Umidade: 63.0 %
Conectando a ThingSpeak...
Traceback (most recent call last):
File "<stdin>", line 38, in <module>
File "umqtt/simple.py", line 67, in connect
OSError: -2
linha 38 é cliente.connect()
It seems like the financial news is always saying the stock market is especially volatile now. But is it really? This code will show you the daily variation from the prior day. You can see that the average daily change from one day to the next is 0.69%. So any change in the stock market from the prior day less than about 0.7% or 1% is just normal "noise"/typical variation. You can modify the code to adjust the starting date for the analysis. Data file (Excel workbook) is attached (hopefully - I attached it twice but it's not showing up yet).

% Program to plot the Dow Jones Industrial Average from 1928 to May 2025, and compute the standard deviation.
% Data available for download at https://finance.yahoo.com/quote/%5EDJI/history?p=%5EDJI
% Just set the Time Period, then find and click the download link, but you ned a paid version of Yahoo.
%
% If you have a subscription for Microsoft Office 365, you can also get historical stock prices.
% Reference: https://support.microsoft.com/en-us/office/stockhistory-function-1ac8b5b3-5f62-4d94-8ab8-7504ec7239a8#:~:text=The%20STOCKHISTORY%20function%20retrieves%20historical,Microsoft%20365%20Business%20Premium%20subscription.
% For example put this in an Excel Cell
% =STOCKHISTORY("^DJI", "1/1/2000", "5/10/2025", 0, 1, 0, 1,2,3,4, 5)
% and it will fill out a table in Excel
%====================================================================================================================
clc; % Clear the command window.
close all; % Close all figures (except those of imtool.)
imtool close all; % Close all imtool figures if you have the Image Processing Toolbox.
clear; % Erase all existing variables. Or clearvars if you want.
workspace; % Make sure the workspace panel is showing.
format long g;
format compact;
fontSize = 14;
filename = 'Dow Jones Industrial Index.xlsx';
data = readtable(filename);
% Date,Close,Open,High,Low,Volume
dates = data.Date;
closing = data.Close;
volume = data.Volume;
% Define start date and stop date
startDate = datetime(2011,1,1)
stopDate = dates(end)
selectedDates = dates > startDate;
% Extract those dates:
dates = dates(selectedDates);
closing = closing(selectedDates);
volume = volume(selectedDates);
% Plot Volume
hFigVolume = figure('Name', 'Daily Volume');
plot(dates, volume, 'b-');
grid on;
xticks(startDate:calendarDuration(5,0,0):stopDate)
title('Dow Jones Industrial Average Volume', 'FontSize', fontSize);
hFig = figure('Name', 'Daily Standard Deviation');
subplot(3, 1, 1);
plot(dates, closing, 'b-');
xticks(startDate:calendarDuration(5,0,0):stopDate)
drawnow;
grid on;
caption = sprintf('Dow Jones Industrial Average from %s through %s', dates(1), dates(end));
title(caption, 'FontSize', fontSize);
% Get the average change from one trading day to the next.
diffs = 100 * abs(closing(2:end) - closing(1:end-1)) ./ closing(1:end-1);
subplot(3, 1, 2);
averageDailyChange = mean(diffs)
% Looks pretty noisy so let's smooth it for a nicer display.
numWeeks = 4;
diffs = sgolayfilt(diffs, 2, 5*numWeeks+1);
plot(dates(2:end), diffs, 'b-');
grid on;
xticks(startDate:calendarDuration(5,0,0):stopDate)
hold on;
line(xlim, [averageDailyChange, averageDailyChange], 'Color', 'r', 'LineWidth', 2);
ylabel('Percentage', 'FontSize', fontSize);
caption = sprintf('Day-to-Day Change Percentage. Average Daily Change (from prior day) = %.2f%%', averageDailyChange);
title(caption, 'FontSize', fontSize);
drawnow;
% Get the stddev over a 5 trading day window.
sd = stdfilt(closing, ones(5, 1));
% Get it relative to the magnitude.
sd = sd ./ closing * 100;
averageVariation = mean(sd)
numWeeks = 2;
% Looks pretty noisy so let's smooth it for a nicer display.
sd = sgolayfilt(sd, 2, 5*numWeeks+1);
% Plot it.
subplot(3, 1, 3);
plot(dates, sd, 'b-');
grid on;
xticks(startDate:calendarDuration(5,0,0):stopDate)
hold on;
line(xlim, [averageVariation, averageVariation], 'Color', 'r', 'LineWidth', 2);
ylabel('Percentage', 'FontSize', fontSize);
caption = sprintf('Weekly Standard Deviation, Averaged Over %d Weeks (%d trading days). Mean SD = %.2f', ...
numWeeks, 5*numWeeks+1, averageVariation);
title(caption, 'FontSize', fontSize);
% Maximize figure window.
g = gcf;
g.WindowState = 'maximized';
I want to use Simulink for model-based development of the TC3XX series development board, but I am not sure about the development process and toolchain? Is there a free toolchain available for me to use? Do you have a detailed development tutorial?
I have a pressure vs. time plot resulting from the input of an elastic wave, which I obtained from an Abaqus simulation. So, I have access to all the data. Now, I want to convert this time-domain graph into a frequency-domain graph using FFT in MATLAB.
I came across a code through ChatGPT, but I’m not fully confident in relying on it. Could anyone kindly clarify whether the formulas used for FFT in MATLAB are universal for all types of signals? Or is there a more effective and reliable method I should consider for this purpose?
Hi guys!
Im doing a project where i need to simulate a ship connected to the grid. I have a grid->converter AC-DC-AC -> dynamic load. My converter has to keep the voltage consistent and what changes is the current. Can somebody help me?
I wanted to turn a Markdown nested list of text labels:
- A
- B
- C
- D
- G
- H
- E
- F
- Q
into a directed graph, like this:

Here is my blog post with some related tips for doing this, including text I/O, text processing with patterns, and directed graph operations and visualization.
The topic recently came up in a MATLAB Central Answers forum thread, where community members discussed how to programmatically control when the end user can close a custom app. Imagine you need to prevent app closure during a critical process but want to allow the end user to close the app afterwards. This article will guide you through the steps to add this behavior to your app.
A demo is attached containing an app with a state button that, when enabled, disables the ability to close the app.
Steps
1. Add a property that stores the state of the closure as a scalar logical value. In this example, I named the property closeEnabled. The default value in this example is true, meaning that closing is enabled. -- How to add a property to an app in app designer
properties (Access = private)
closeEnabled = true % Flag that controls ability to close app
end
2. Add a CloseRequest function to the app figure. This function is called any time there is an attempt to close the app. Within the CloseRequest function, add a condition that deletes the app when closure is enabled. -- How to add a CloseRequest function to an app figure in app designer
function UIFigureCloseRequest(app, event)
if app.closeEnabled
delete(app)
end
3. Toggle the value of the closeEnabled property as needed in your code. Imagine you have a "Process" button that initiates a process where it is crucial for the app to remain open. Set the closeEnabled flag to false (closure is disabled) at the beginning of the button's callback function and then set it to true at the end (closure is enabled).
function ProcessButtonPress(app, event)
app.closeEnabled = false;
% MY PROCESS CODE
app.closeEnabled = true;
end
Handling Errors: There is one trap to keep in mind in the example above. What if something in the callback function breaks before the app.closeEnabled is returned to true? That leaves the app in a bad state where closure is blocked. A pro move would be to use a cleanupObj to manage returning the property to true. In the example below, the task to return the closeEnabled property to true is managed by the cleanup object, which will execute that command when execution is terminated in the ProcessButtonPress function—whether execution was terminated by error or by gracefully exiting the function.
function ProcessButtonPress(app, event)
app.closeEnabled = false;
cleanupClosure = onCleanup(@()set(app,'closeEnabled',true));
% MY CODE
end
Force Closure: If the CloseRequest function is preventing an app from closing, here are a couple of ways to force a closure.
- If you have the app's handle, use delete(app) or close(app,'force'). This will also work on the app's figure handle.
- If you do not have the app's handle, you can use close('all','force') to close all figures or use findall(groot,'type','figure') to find the app's figure handle.
Me: If you have parallel code and you apply this trick that only requires changing one line then it might go faster.
Reddit user: I did and it made my code 3x faster
Not bad for just one line of code!
Which makes me wonder. Could it make your MATLAB program go faster too? If you have some MATLAB code that makes use of parallel constructs like parfor or parfeval then start up your parallel pool like this
parpool("Threads")
before running your program.
The worst that will happen is you get an error message and you'll send us a bug report....or maybe it doesn't speed up much at all....
....or maybe you'll be like the Reddit user and get 3x speed-up for 10 seconds work. It must be worth a try...after all, you're using parallel computing to make your code faster right? May as well go all the way.
In an artificial benchmark I tried, I got 10x speedup! More details in my recent blog post: Parallel computing in MATLAB: Have you tried ThreadPools yet? » The MATLAB Blog - MATLAB & Simulink
Give it a try and let me know how you get on.
Hello ThingSpeak Community,
I have an energy meter sending data of energy consumed in 4 rooms in hexadecimal values to Sigfox and I was trying to decode the payload and route it to ThingSpeak.
All the datas are sent at the same time.
But ThingSpeak only receives 1 of them and plots them.
However, the rest 3 are missing. Is this because I am trying the free version ?
Would the payed version be capable of receiving all the 4 messages ?
Hi! I'm Joseff and along with being a student in chemical engineering, one of my great passions is language-learning. I learnt something really cool recently about Catalan (a romance language closely related to Valencian that's spoken in Andorra, Catalonia, and parts of Spain) — and that is how speakers tell the time.
While most European languages stick to the standard minutes-past / minutes-to between hours, Catalan does something really quite special, with a focus on the quarters (quarts [ˈkwarts]). To see what I mean, take a look at this clock made by Penguin___Lover on Instructables :
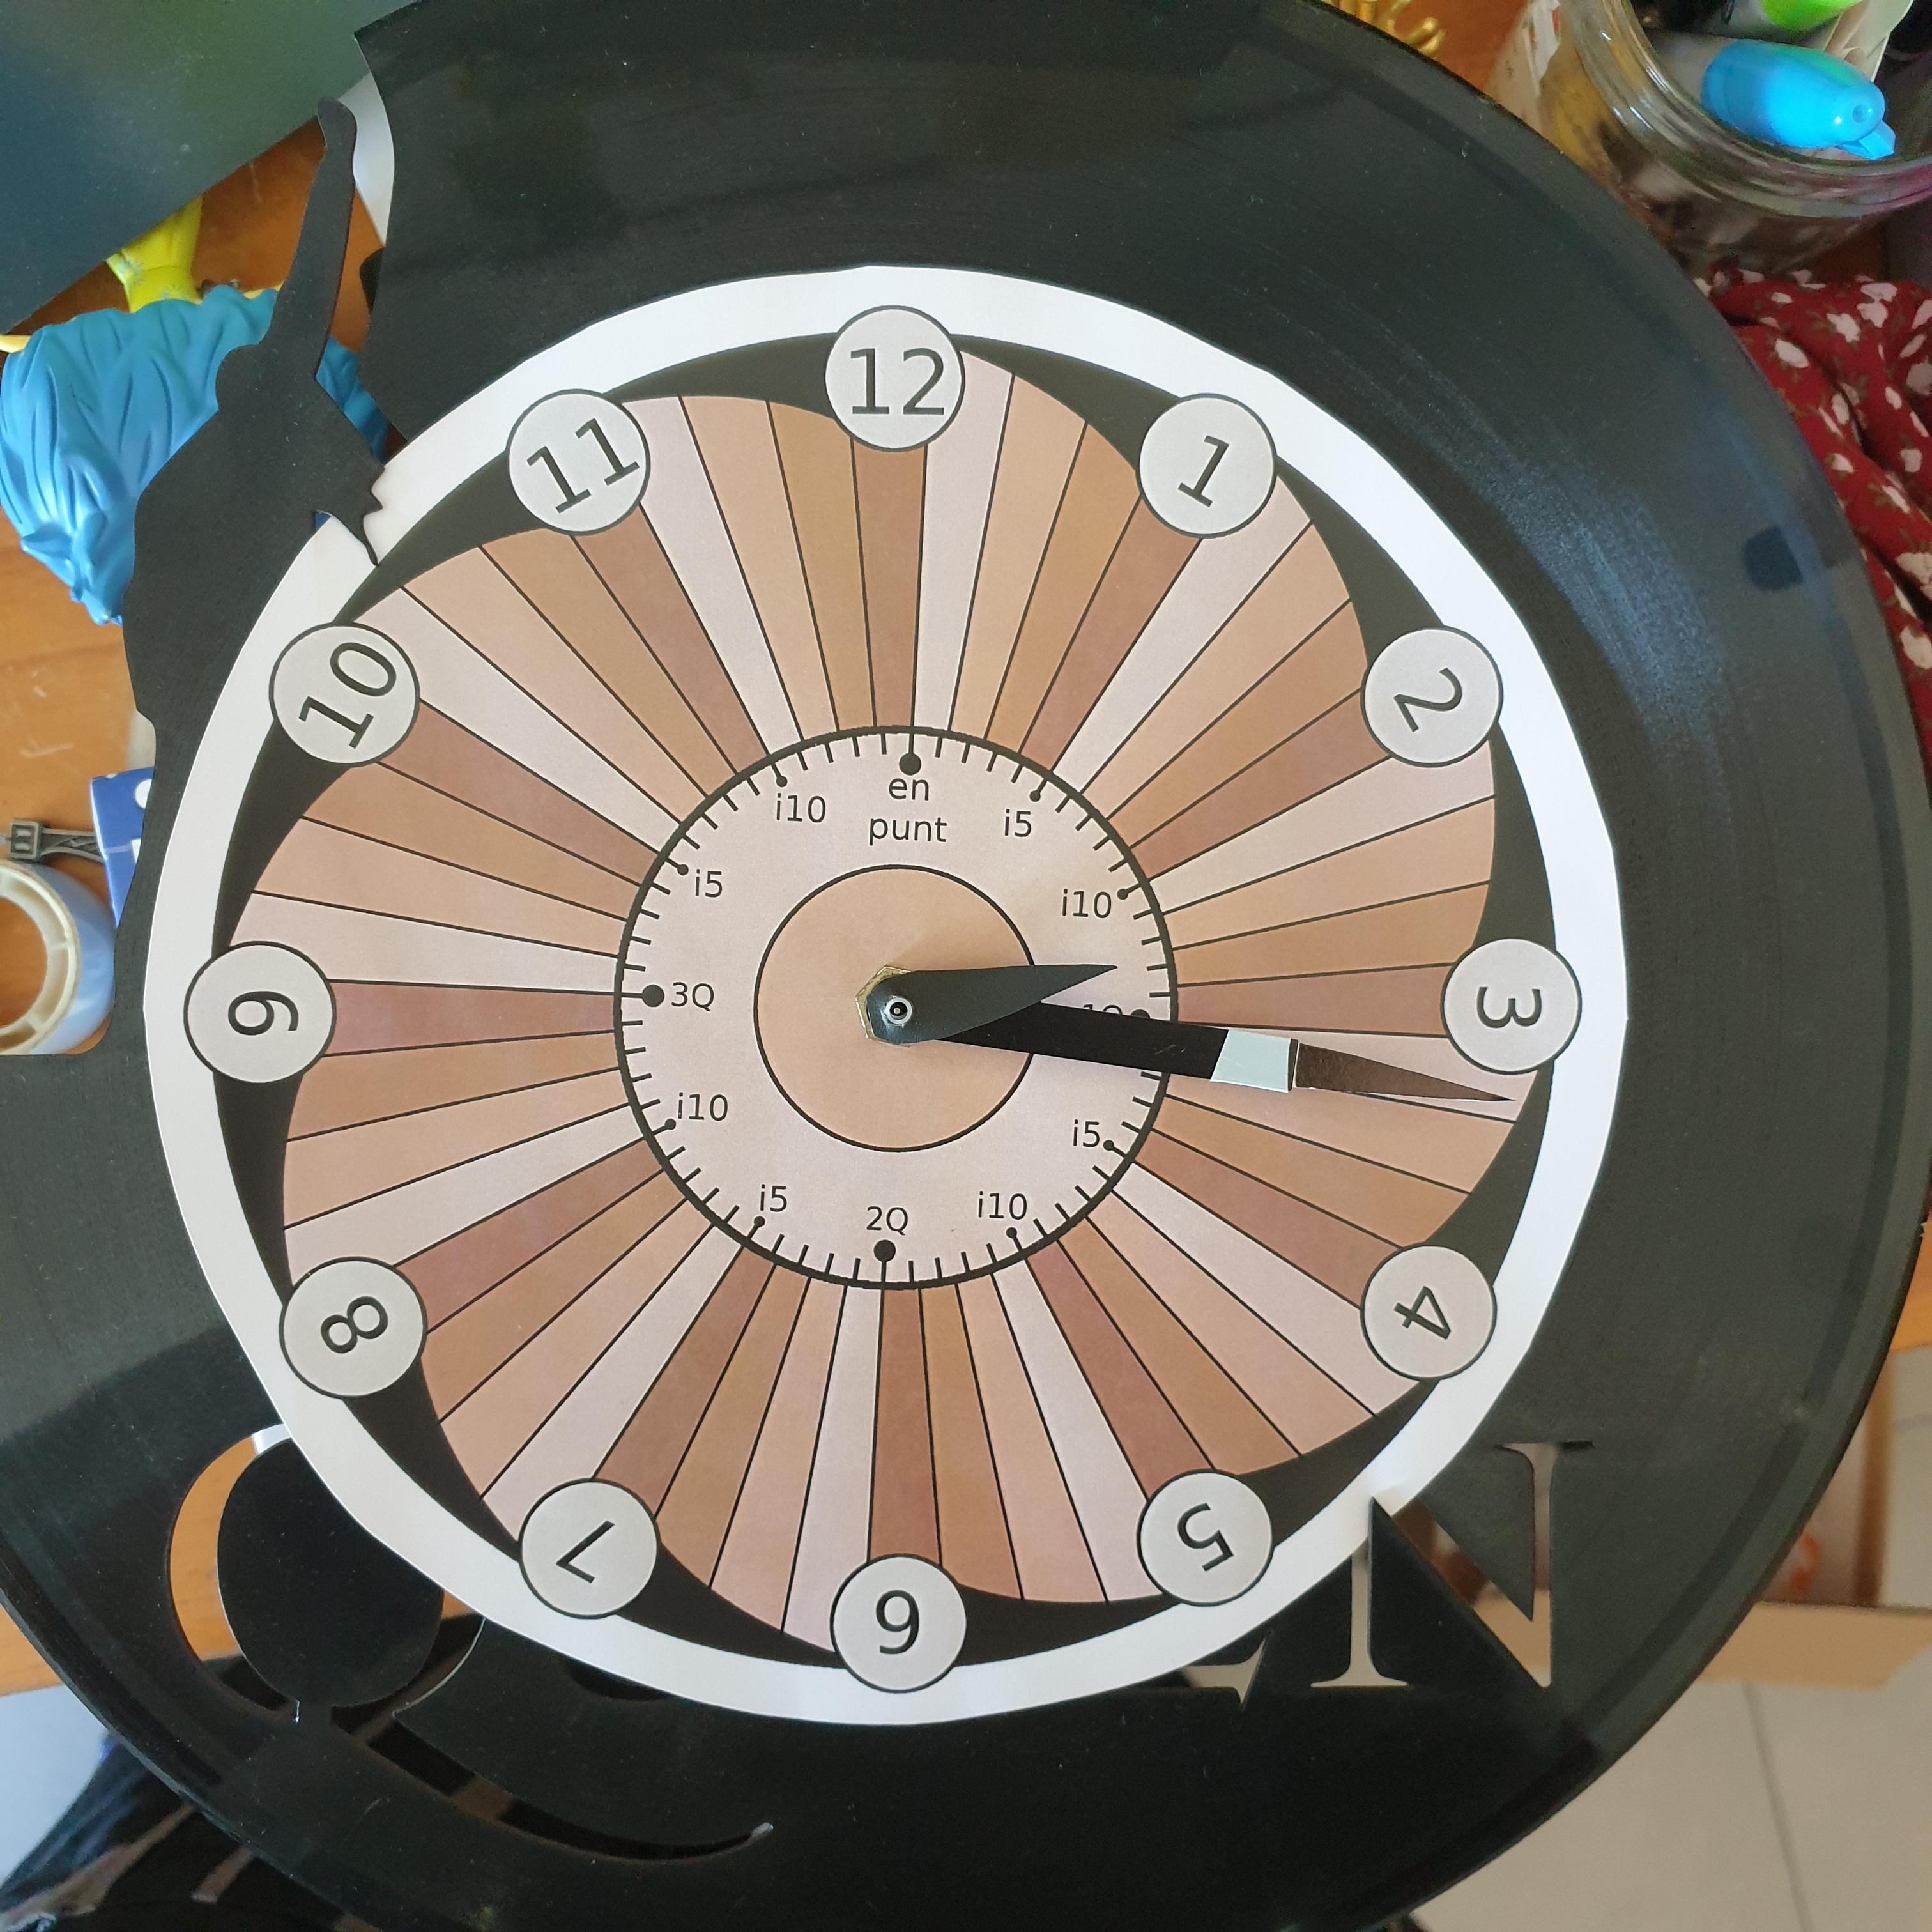
If you want to tell the time in Catalan, you should refer to the following hour (the one that's still to come), and how many minutes have passed or will pass for the closest quarter (sometimes half-quarter / mig quart [ˈmit͡ʃ kwart]) — clear as mud? It's definitely one of the more difficult things to wrap your head around as a learner. But fear not, with the power of MATLAB, we'll understand in no time!
To make a tool to tell the time in Catalan, the first thing we need to do is extract the current time into its individual hours, minutes and seconds*
function catalanTime = quinahora()
% Get the current time
[hours, minutes, seconds] = hms(datetime("now"));
% Adjust hours to 12-hour format
catalanHour = mod(hours-1, 12)+1;
nextHour = mod(hours, 12)+1;
Then to defining the numbers in catalan. It's worth noting that because the hours are feminine and the minutes are masculine, the words for 1 and 2 is different too (this is not too weird as languages go, in fact for my native Welsh there's a similar pattern between 2 and 4).
% Define the numbers in Catalan
catNumbers.masc = ["un", "dos", "tres", "quatre", "cinc"];
catNumbers.fem = ["una", "dues", "tres", "quatre",...
"cinc", "sis", "set", "vuit",...
"nou", "deu", "onze", "dotze"];
Okay, now it's starting to get serious! I mentioned before that this traditional time telling system is centred around the quarters — and that is true, but you'll also hear about the mig de quart (half of a quarter) * which is why we needed that seconds' precision from earlier!
% Define 07:30 intervals around the clock from 0 to 60
timeMarks = 0:15/2:60;
timeFraction = minutes + seconds / 60; % get the current position
[~, idx] = min(abs(timeFraction - timeMarks)); % extract the closest timeMark
mins = round(timeFraction - timeMarks(idx)); % round to the minute
After getting the fraction of the hour that we'll use later to tell the time, we can look into how many minutes it differs from that set time, using menys (less than) and i (on top of). There's also a bit of an AM/PM distinction, so you can use this function and know whether it's morning or night!
% Determine the minute string (diffString logic)
diffString = '';
if mins < 0
diffString = sprintf(' menys %s', catNumbers.masc(abs(mins)));
elseif mins > 0
diffString = sprintf(' i %s', catNumbers.masc(abs(mins)));
end
% Determine the part of the day (partofDay logic)
if hours < 12
partofDay = 'del matí'; % Morning (matí)
elseif hours < 18
partofDay = 'de la tarda'; % Afternoon (tarda)
elseif hours < 21
partofDay = 'del vespre'; % Evening (vespre)
else
partofDay = 'de la nit'; % Night (nit)
end
% Determine 'en punt' (o'clock exactly) based on minutes
enPunt = '';
if mins == 0
enPunt = ' en punt';
end
Now all that's left to do is define the main part of the string, which is which mig quart we are in. Since we extracted the index idx earlier as the closest timeMark, it's just a matter of indexing into this after the strings have been defined.
% Create the time labels
labels = {sprintf('són les %s%s%s %s', catNumbers.fem(catalanHour), diffString, enPunt, partofDay), ...
sprintf('és mig quart de %s%s %s', catNumbers.fem(nextHour), diffString, partofDay), ...
sprintf('és un quart de %s%s %s', catNumbers.fem(nextHour), diffString, partofDay), ...
sprintf('és un quart i mig de %s%s %s', catNumbers.fem(nextHour), diffString, partofDay), ...
sprintf('són dos quarts de %s%s %s', catNumbers.fem(nextHour), diffString, partofDay), ...
sprintf('són dos quarts i mig de %s%s %s', catNumbers.fem(nextHour), diffString, partofDay), ...
sprintf('són tres quarts de %s%s %s', catNumbers.fem(nextHour), diffString, partofDay), ...
sprintf('són tres quarts i mig de %s%s %s', catNumbers.fem(nextHour), diffString, partofDay), ...
sprintf('són les %s%s%s %s', catNumbers.fem(nextHour), diffString, enPunt, partofDay)};
catalanTime = labels{idx};
Then we need to do some clean up — the definite article les / la and the preposition de don't play nice with un and the initial vowel in onze, so there's a little replacement lookup here.
% List of old and new substrings for replacement
oldStrings = {'les un', 'són la una', 'de una', 'de onze'};
newStrings = {'la una', 'és la una', 'd''una', 'd''onze'};
% Apply replacements using a loop
for i = 1:length(oldStrings)
catalanTime = strrep(catalanTime, oldStrings{i}, newStrings{i});
end
end
quinahora()
So, can you work out what time it was when I made this post? 🤔
And how do you tell the time in your language?
Fins després!