Results for
we are planning to design a drive for an EV using synchronous reluctance motor. To move further we need some drive circuits for simulating and comparing various motors with synchronous reluctance to justify our literature survey. can we get som circuit suggestions?
New Cheat Sheet Alert!
Level up your data organization and access skills in MATLAB with our latest cheat sheet! Download the full cheat sheet on MATLAB GitHub for Students here.
I know the latest version of MATLAB R2023b has this feature already, put it should be added to R2023a as well because of its simplicity and convenience.
Basically, I want to make a bar graph that lets me name each column in a basic bar graph:
y=[100 99 100 200 200 300 500 800 1000];
x=["0-4" "5-17" "18-29" "30-39" "40-49" "50-64" "65-74" "75-84" "85+"];
bar(x,y)
However, in R2023a, this isn't a feature. I think it should be added because it helps to present data and ideas more clearly and professionally, which is the purpose of a graph to begin with.
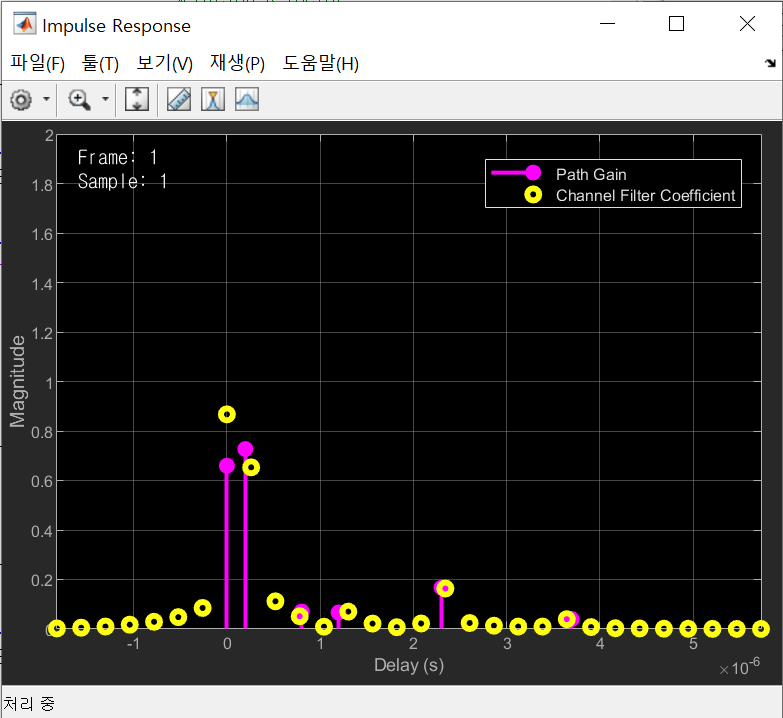
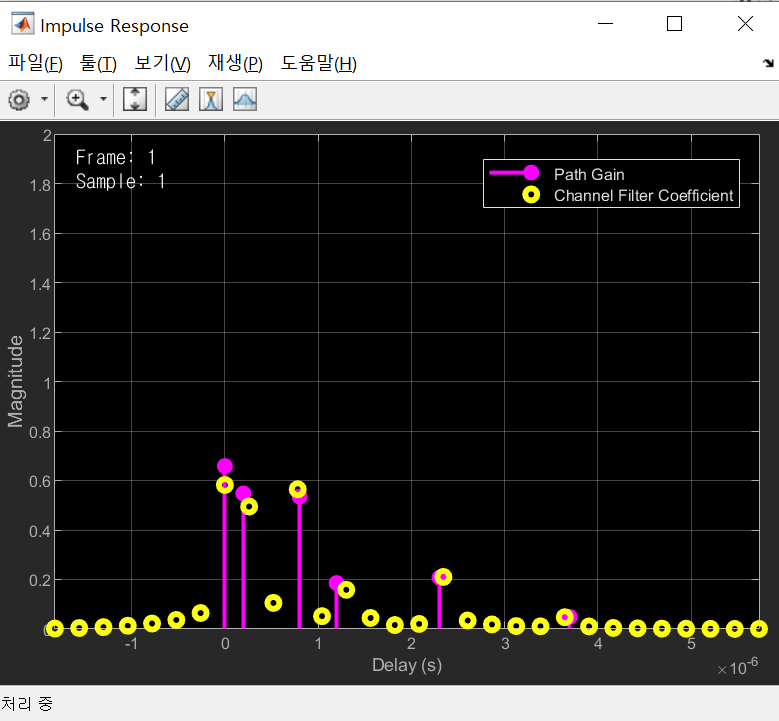
I am running the code from the following URL: https://kr.mathworks.com/help/comm/ref/comm.ricianchannel-system-object.html. I copied and executed the example to visualize the channel's impulse response. However, when I run the same code multiple times with the same path gains and delays, I get different impulse response results each time. What could be the reason for this?
This behavior is unexpected because the code and settings are the same for each run, and the impulse response should remain constant.
This is the code.
fs = 3.84e6; % Sample rate in Hz
pathDelays = [0 200 800 1200 2300 3700]*1e-9; % in seconds
avgPathGains = [0 -0.9 -4.9 -8 -7.8 -23.9]; % dB
kfact = 10; % Rician K-factor
fD = 50; % Max Doppler shift in Hz
ricianChan = comm.RicianChannel( ...
SampleRate=fs, ...
PathDelays=pathDelays, ...
AveragePathGains=avgPathGains, ...
KFactor=kfact, ...
MaximumDopplerShift=fD, ....
Visualization='Impulse and frequency responses');
ricianChan(0.1);
The two images below show the results of running the same code.
Hi,
I was wondering if anyone could help me with how I can simplify this part of my script, specifically scenario 1-3, so that it is easier to read. Perhaps with functions etc. (the comments are in swedish sorry heh. But the script works).
Thanks in advance!
F1_batt_till_P19 = zeros(8760,length(Effekt)); % det som batteriet laddar upp fastigheten med
F1_Elkons_batt = zeros(8760,length(Effekt)); % konsumtionen från nätet av batteriet
F1_batterilast_tot = zeros(8760,length(Effekt)); % batterilasten lagras kontenueligt.
F1_elkonsum = [];
for k = 1: length(Effekt) % går igenom alla olika effekter mellan 100 - 1000 kW
F1_last_batt = 0; % batteriet måste nollas efter varje ny effekt.
batterikapacitet = Kapacitet(k); % såhär stort är batteriet beroende på effekten. Beror på C rate (blir dubbelt så stort som effekten).
batterikapacitet_min = batterikapacitet * SOC_low/100; % undre gräns
batterikapacitet_max = batterikapacitet *SOC_high/100; % övre gräns
F1_last_batt = batterikapacitet_min; % hur mycket kapacitet har batteriet. Finns det något . Börjar tomt.
for i = 1:12 % gå igenom månaderna
mon = [31,28,31,30,31,30,31,31,30,31,30,31];
slut = mon(i)*24;
% medelkonsumtionen (i kW) per månad Elkons_months_eft(744,12)
medel_kons = mean(Elkons_months_eft(1:slut, i)); % Månadens medelkonsumtion
for m = 1:slut % gå igenom timmarna per månad
% går igenom varje timme (m), för varje månad (i).
% scenario 1 - batteriet laddar ur till medelvärdet
if Elkons_months_eft(m,i) > medel_kons
topp = Elkons_months_eft(m,i) - medel_kons; % storleken på toppen över medelvärde
% Om batteriet inte är tomt från början. Om det kan laddas ur.
if F1_last_batt > batterikapacitet_min
% Om batteriet kan laddas ur med hela efffekten utan att gå under min
if (F1_last_batt - Effekt(k)) >= batterikapacitet_min
% Om toppen är större eller lika med än vad som får kapas med batteriet - hela effekten används.
if topp >= Effekt(k) % A
F1_batt_till_P19( (24*sum(mon(1:i-1)) + m) ,k) = Effekt(k); % effekt under timmen som batteriet tillgodoser till Pyramiden 19
F1_last_batt = F1_last_batt - Effekt(k); % batteriet laddas ur med hela effekten den timmen
% Om toppen inte är större än effekten - hela toppen kapas.
else % B
F1_batt_till_P19((24*sum(mon(1:i-1)) + m) ,k) = topp;
F1_last_batt = F1_last_batt - topp;
end
% Om batteriet inte kan tömmas med hela effekten.
else
liten_effekt = F1_last_batt - batterikapacitet_min; % mängden som kan laddas ur.
% Om toppen är större än det vi kan använda – allt som är kvar används
if topp >= liten_effekt % C
F1_batt_till_P19((24*sum(mon(1:i-1)) + m) , k) = liten_effekt; % effekt under timmen som batteriet tillgodoser till Pyramiden 19
F1_last_batt = F1_last_batt - liten_effekt; % batteriet laddas ur till min
% Om toppen inte är större än det vi kan använda - hela toppen kapas
else % D
F1_batt_till_P19( (24*sum(mon(1:i-1)) + m) ,k) = topp;
F1_last_batt = F1_last_batt - topp;
end
end
end
% scenario 2 - batteriet laddar upp och tar från nätet
elseif Elkons_months_eft(m,i) < medel_kons
% Om batteriet inte är fullt
if F1_last_batt < batterikapacitet_max
% Om det får plats en laddning av hela effekten – Batteriet laddas upp
if (F1_last_batt + Effekt(k)) <= batterikapacitet_max
% Om uppladdningen inte överstiger medelvärdet – Batteriet laddas upp med effekten
if (Elkons_months_eft(m,i) + Effekt(k)) <= medel_kons % A
F1_Elkons_batt((24*sum(mon(1:i-1)) + m),k) = Effekt(k); % mängden som tas från nätet
F1_last_batt = F1_last_batt + Effekt(k);
% Om uppladdningen överstiger medelvärdet – Batteriet laddas upp med det som går
else % B
till_medel = medel_kons - Elkons_months_eft(m,i);
F1_Elkons_batt((24*sum(mon(1:i-1)) + m),k) = till_medel;
F1_last_batt = F1_last_batt + till_medel;
end
% Om det får plats mindre än hela efffekten i en laddning – Batteriet laddas fullt
else
plats = batterikapacitet_max - F1_last_batt; % det som får plats i batteriet
% Om elkonsumtionen ej överstiger medelvärdet – Batteriet laddas upp till max-taket
if (Elkons_months_eft(m,i) + plats) <= medel_kons % C
F1_Elkons_batt((24*sum(mon(1:i-1)) + m),k) = plats;
F1_last_batt = F1_last_batt + plats;
% Om elkonsumtionen överstiger medelvärdet – Batteriet laddas upp med det som går
else % D
till_medel = medel_kons - Elkons_months_eft(m,i);
F1_Elkons_batt((24*sum(mon(1:i-1)) + m),k) = till_medel;
F1_last_batt = F1_last_batt + till_medel;
end
end
end
% scenario 3 - om inget händer
elseif Elkons_months_eft(m,i) == medel_kons
% inget händer. Precis som jag vill ha det.
end
F1_batterilast_tot((24*sum(mon(1:i-1)) + m),k) = F1_last_batt; % lägger in batterilasten för timmen i en lista.
end % slut - for timmar per mån (m)
end %slut for - månaderna (i)
% tar bort den sista uppladdningen av batteriet så det kommer ner till min värdet iaf
% får ta bort min värdet kostnaden sen manuellt.
for p = 0:(8760-1)
% Om batteriet har laddning över min kvar i slutet
if F1_last_batt > batterikapacitet_min
over = F1_last_batt - batterikapacitet_min;
% Om platsen är större än eller lika med laddningen på batteriet – Batteriet töms ner till min
if F1_Elkons_batt(end-p,k) >= over
F1_Elkons_batt(end-p,k) = F1_Elkons_batt(end-p,k) - over;
F1_last_batt = batterikapacitet_min;
F1_batterilast_tot(end-p,k) = batterikapacitet_min;
% Om platsen är mindre än laddningen på batteriet – Batteriet töms med hela platsen
elseif F1_Elkons_batt(end-p,k) < over
F1_last_batt = F1_last_batt - F1_Elkons_batt(end-p,k);
F1_batterilast_tot(end-p,k) = batterikapacitet_min;
F1_Elkons_batt(end-p,k) = 0;
end
end
end
end % slut for - effekt (k)
% summerar ihop året till ett värde. Får ett värde för varje effekt.
F1_elkonsum_sum =[];
F1_batt_till_P19_sum =[];
F1_Elkons_batt_sum = [];
F1_effekttopp_medel_year = []; % medel effekttopp under året
for v = 1:length(Effekt)
F1_elkonsum(:,v) = (Elkonsumtion_eft(:,1) - F1_batt_till_P19(:,v)) + F1_Elkons_batt(:,v); % elnätskonsumtion under året
F1_elkonsum_sum(v) = sum(F1_elkonsum(:,v));
F1_batt_till_P19_sum(v) = sum(F1_batt_till_P19(:,v));
F1_Elkons_batt_sum(v) = sum(F1_Elkons_batt(:,v));
end
% figure; yyaxis right; plot(F1_elkonsum(:,20));
% hold on; plot(Elkonsumtion_eft(:,1));
% hold on; yyaxis left; plot(F1_batterilast_tot(:,20)); legend('Konsum','ladd');
% Beräknar maxeffekten (toppen) för varje månad för alla effekter. Blir en 12 x length(effekt) lista
% Den går per rad och tar maxeffekten för månaden för alla kolumner = för alla olika effekter.
F1_effekttopp_months = zeros(12,length(Effekt)); % effekttopp under månaden för alla olika effekter.
mon = [31, 28, 31, 30, 31, 30, 31, 31, 30, 31, 30, 31];
for b = 1:12
F1_effekttopp_months(b,:) = max(F1_elkonsum( (24*sum(mon(1:b-1)) + 1) : 24*sum(mon(1:b)) , : ) ); % [kW]
end
% beräknar medeleffekten för året
for v = 1:length(Effekt)
F1_effekttopp_medel_year(v) = mean(F1_effekttopp_months(:,v));
end
Recently, I came across a post about the JIT compiler on this Korean blog. In the post. The writer discussed the concept of the "Compile Threshold" and how it is calculated.
"The JVM accumulates the number of calls for each method called and compiles when the number exceeds a certain number. In other words, there is a standard for checking how often it is called and then deciding, 'It is time to compile.' This standard is called the compilation threshold. But what is this and why should it be used as a standard?"
The concept of the "Compile Threshold," as used above, seems to be more commonly associated with Tracing just-in-time compilation.
The writer used the simple Java code below to calculate the threshold.
for (int i = 0; i < 500; ++i) {
long startTime = System.nanoTime();
for (int j = 0; j < 1000; ++j) {
new Object();
}
long endTime = System.nanoTime();
System.out.printf("%d\t%d\n", i, endTime - startTime);
}
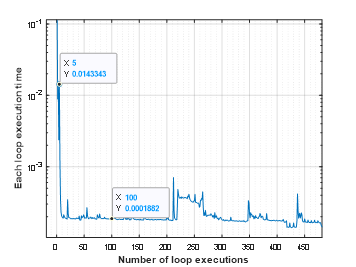
Since the MATLAB execution engine uses JIT compilation, I just wanted to perform the same experiment that the writer did.
I experimented using simple codes based on the code in the blog. I iterated a function 500 time using for-loop and calculated the execution time for each iteration using tic and toc. Then I plotted the execution time for each loop as blow. First five execution times are much higher than followings (10 times!) The test is very rough so I am not sure that I can conclude "MATLAB has Compile Threshold and it is 5!" but this value is actually correct ;-)
t0 = 0;
tfinal = 10;
y0 = [20;20];
timeToRun = zeros(500,1);
for i = 1:500
tStart = tic;
[preypeaks,predatorpeaks] = solvelotka(t0, tfinal, y0);
tEnd = toc(tStart);
timeToRun(i) = tEnd;
end
VS Code Extension for MATLAB was introduced back in April and has been downloaded 75K times since. Do people here use VS Code for writing MATLAB code?
Hi, I'm losing comms with thingspeak after exactly one hour. I'm on the free plan while I evaluate TS.
I am sending data once a minute. It works fine for one hour, and I get 200-OK responses. After exactly 1 hour, the response from TS is a 404-not found. I do a new DNS lookup, and get a new IP address for TS. Still no response. I do more DNS lookups, and get another different IP address. It cycles through 3 different IP addresses, but noe of them work one hour after bootup on my device.
I'm running an Arduino Nano with an Ethercard and the JNH library. I can still ping the arduino, serve webpages and ping a monitored device, and get NTP time, all in a 1 minute loop, so I doubt the TCP/IP stack has crashed.
after I restart the device, it works again for exactly one hour, and the I lose comms with Thingspeak again.
Any help would be appreciated!
Thanks,
Adrian
In my struggle to get my SIM7600 connected to thingspeak using MQTT, i went to the basics: simple testing of my connection:
I use this site : https://testclient-cloud.mqtt.cool
Protocol :tcp
Host : mqtt3.thingspeak.com
Port : 1883
Username : got it from my device (double checked !)
Password : got it from my device (double checked !)
When i try to connect I get the message Connection refused : bad user name or password.
I am completely lost. What basic stupi mistake am i missing. I thoroughly read the MQTT help pages.
Any help is appreciated.
Update :
When i select Dedicated connection and i also fill in the will message and will topic, i am able to update my channel. At least some progress.
Would it be a good thing to have implicit expansion enabled for cat(), horzcat(), vertcat()? There are often situations where I would like to be able to do things like this:
x=[10;20;30;40];
y=[11;12;13;14];
z=cat(3, 0,1,2);
C=[x,y,z]
with the result,
C(:,:,1) =
10 11 0
20 12 0
30 13 0
40 14 0
C(:,:,2) =
10 11 1
20 12 1
30 13 1
40 14 1
C(:,:,3) =
10 11 2
20 12 2
30 13 2
40 14 2
Earlier this year a bunch of MATLAB users got together to talk about their hobbies in a lightning talk format.
- Using "UIHTML" to create app components and Lightning
- Creating generative art with MATLAB
- Making MATLAB run on the Steam Deck (it was a wager)
Do you use MATLAB for hobbies?
my Channel ID 2305210 and Channel ID 2300906 are not working properly. Pl.Guide me
Are there Matlab features which intend to satisfy your needs but fail in certain critical areas, forcing you to abandon them completely in favor of your own version or a 3rd party alternative? Perhaps these features are starting to improve with new Matlab releases, but not quickly enough? Share your own frustrations in the comments below.
Here are two of mine:
1. volumeViewier
volumeViewer is 6 years old now. It is fine when you only need to view one 3D image at a time, but I never do. In my work, I am putting several images side-by-side for visual comparison. For such work, you need to be able to programmatically change axis limits and grayscale and use linkprop to reflect these changes across all the images. With 2D image comparison, all that is possible, but volumeViewer supports none of those things. So, I resort to my own 3D viewer
2.Tomographic projection commands RADON and FANBEAM
These commands are provided in the Image Processing Toolbox seemingly for no other reason than to support homework exercises for people taking introductory tomographic imaging courses. They fail in a number of ways for people who need to do serious tomographic imaging work, producing artifacts or nonlinear effects which shouldn't be there. See for example Why isn't FANBEAM linear? or Radon Transform works unexpectedly. Moreover, the toolbox still provides tomographic projectors only for 2D imaging not 3D, even though 64-bit RAM has made volumetric imaging commonplace in Matlab for at least 10 years. Luckily, there are now freely available 3rd party alternatives like TIGRE.
Hi there,
I hope someone can help me on this.
I have written a code to connect my SIM7600 to Thingspeak using MQTT. It is basically an aruidino code. All instructions are echo's with an OK message so assume those instrictions are correct. However, the final step, publishing the message to the MQTT server return an error : CMQTTCONNLOST : 0,1.
Any idea which instructions might be wron?
I included the commands send.
10:09:09.031 -> AT+CMQTTPUB=0,0,60,0,0
10:09:09.031 -> +CMQTTPUB: 0,0
10:09:09.031 ->
10:09:09.031 -> OK
10:09:09.031 ->
10:09:09.031 -> +CMQTTCONNLOST: 0,1
The program :
SerialAT.begin(115200, SERIAL_8N1, RXD2, TXD2);
delay(1000);
SerialAT.println("AT+CRESET"); // Reset the SIM7600 module
Read_Response(30000);
SerialAT.println("AT+IPR=115200"); // Set Baudrate of the SIM7600 module
Read_Response(30000);
SerialAT.println("AT+CSQ"); // Check signal level
Read_Response(10000);
SerialAT.println("AT+COPS?"); // Query network information
Read_Response(10000);
SerialAT.println("AT+CMQTTSTOP"); //Stop MQTT service
Read_Response(10000);
SerialAT.println("AT+CMQTTSTART"); //Start MQTT service
Read_Response(10000);
SerialAT.println("AT+CSSLCFG=\"sslversion\",0,3"); //Configure SSL contect ssl_ctxindex,sslversion <0,TLS1.2>
Read_Response(10000);
SerialAT.println("AT+CSSLCFG=\"authmode\",0,0"); //Establishing MQTT Connection <ssl_ctx_index,authmode<0,no autentification>
Read_Response(10000);
SerialAT.println("AT+CMQTTACCQ=0,\"Username\",0,4"); // Acquire a client <client_index,client_ID>
Read_Response(10000);
SerialAT.println("AT+CMQTTSSLCFG=0,0"); // Set the SSL context <session_id,ssl_ctx_index> ssl_ctx_index check AT+CSSLCFG command
Read_Response(10000);
SerialAT.println("AT+CMQTTCONNECT=0,\"tcp://mqtt3.thingspeak.com:1883\",90,1,\"Username\",\"password\""); //Connect to MQTT server <client_index,server_addr,keep_alive time,clean_session,username,password>
Read_Response_Ignore_OK(3000);
String payload="\"channels/"+ String(ChannelId)+"/publish\"";
int Payload_Length;
Payload_Length=payload.length();
SerialAT.println("AT+CMQTTTOPIC=0,"+String(Payload_Length)); // Input the publish message topic <client_index,req_length>
SerialAT.println(payload);
Read_Response_Ignore_OK(3000);
payload="field1=12&field2=13&status=MQTTPUBLISH";
Payload_Length=payload.length();
SerialAT.println("AT+CMQTTPAYLOAD=0,"+String(Payload_Length)); // input the publish message body <client_index,req_length>
SerialAT.println(payload);
Read_Response_Ignore_OK(1000);
SerialAT.println("AT+CMQTTPUB=0,0,60,0,0"); // Publish a message to the server <client_id,qos,pub_timeout,retained>
Read_Response_Ignore_OK(1000);
Serial.print(Receive_buffer);
Serial.println("And we are done");
Have you ever learned that something you were doing manually in MATLAB was already possible using a built-in feature? Have you ever written a function only to later realize (or be told) that a built-in function already did what you needed?
Two such moments come to mind for me.
1. Did you realize that you can set conditional breakpoints? Neither did I, until someone showed me that feature. To do that, open or create a file in the editor, right click on a line number for any line that contains code, and select Set Conditional Breakpoint... This will bring up a dialog wherein you can type any logical condition for which execution should be paused. Before I learned about this, I would manually insert if-statements during debugging. Then, after fixing each bug, I would have to delete those statements. This built-in feature is so much better.
2. Have you ever needed to plot horizontal or vertical lines in a plot? For the longest time, I would manually code such lines. Then, I learned about xline() and yline(). Not only is less code required, these lines automatically span the entire axes while zooming, panning, or adjusting axis limits!
Share your own Aha! moments below. This will help everyone learn about MATLAB functionality that may not be obvious or front and center.
(Note: While File Exchange contains many great contributions, the intent of this thread is to focus on built-in MATLAB functionality.)
The carot symbol on my keyboard (ˆ shift+6) doesn't work on matlab. Matlab doesn't recognize it so I can't write any equation with power symbol. I tried every possible solution on the web and it doesn't work. even in the character viewer I don't have any result when I search ''caret".
Exciting news for students! 🚀Simulink Student Challenge 2023 is live! Unleash your engineering skills and compete for exciting rewards. Submission deadline is December 12th, 2023!

In the past year, we've witnessed an exponential growth of ChatGPT and other Generative AI tools. AI has quickly become a transformative force across industries, from tech giants to small startups, and even community sites like ours. For instance, Stack Overflow announced its plan to leverage AI tools to draft a question or tag content; Quora built a ChatGPT bot to answer questions; and GitHub is piloting the AI tool for personalized content.

This trend in the community landscape makes me wonder what MATLAB Central community, especially in MATLAB Answers, can do to integrate AI and enhance the community.
Share with us your ideas in the comment session. Ideally one comment per idea, so that others can vote on a secific idea or have deeper discussions about it.
We launched the Discussions area with 6 channels, based on the existing types of content we see today in the MATLAB Central community.
I'm curious which channels you are most interested in participating, or which channels are missing.
Tell us your thoughts here!
Over the weekend I came across a pi approximation using durations of years and weeks (image below, Wolfram, eq. 89), accurate to 6 digits using the average Gregorian year (365.2425 days).
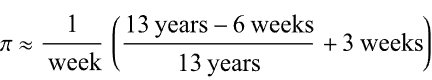
Here it is in MATLAB. I divided by 1 week at the end rather than multiplying by its reciprocal because you can’t divide a numeric by a duration in MATLAB (1/week).
weeks = @(n)n*days(7);
piApprox = ((years(13)-weeks(6))/years(13) + weeks(3)) / weeks(1)
% piApprox = 3.141593493469302
Here’s a breakdown
- The first argument becomes 12.885 yrs / 13 yrs or 0.99115
- Add three weeks: 0.99115 + 3 weeks = 21.991 days
- The reduced fraction becomes 21.991 days / 7 days
Now it looks a lot closer to the more familiar approximation for pi 22/7 but with greater precision!