Results for
Hi!
I'm having trouble sending data to a channel using MQTT. I'm using a program that was working perfectly until just a few days ago, but after making some minor changes yesterday, it stopped working. I’ve also tested it manually using the MQTTX client. If I send data using CURL and GET, it works fine.
It’s a bit strange...
Thankfully,
Ernesto.
Is it possible to create a Simulink model that is independent of specific microcontrollers?
For example, in the model, the STM32 block is used for CAN transmission. But if I want to deploy the same model to an Arduino, I have to replace the STM32 block with an Arduino-compatible one.
So, is it possible to create a custom block or abstraction that works across multiple microcontrollers like STM32, PIC32, and Arduino without changing the hardware-specific block each time?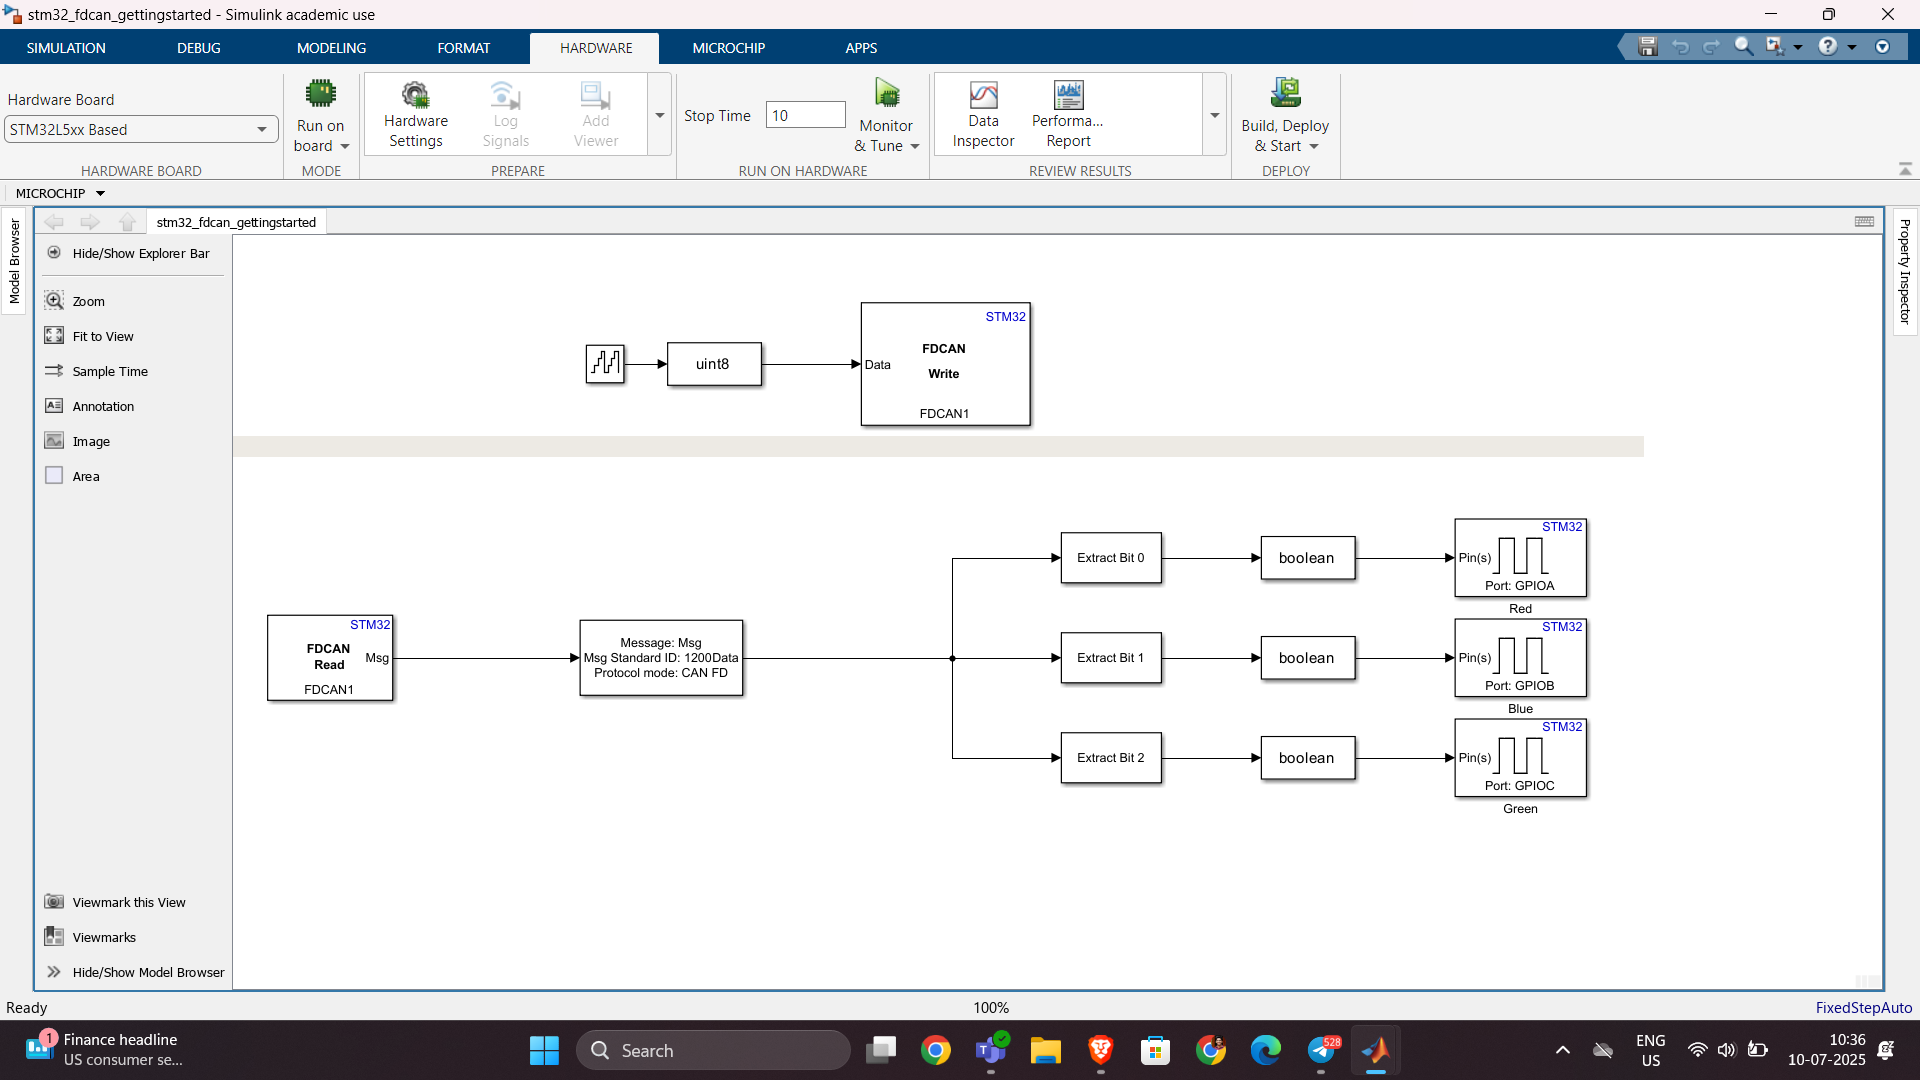
群馬産業技術センター様をお招きし、製造現場での異常検知の取り組みについてご紹介いただくオンラインセミナーを開催します。
実際の開発事例を通して、MATLABを使った「教師なし」異常検知の進め方や、予知保全に役立つ最新機能もご紹介します。
✅ 異常検知・予知保全に興味がある方
✅ データ活用を何から始めればいいか迷っている方
✅ 実際の現場事例を知りたい方
ぜひお気軽にご参加ください!
Hello,
I've successfully tested the Processor-in-the-Loop (PIL) workflow in Simulink using a TI F28069M LaunchPad, following the standard examples provided by MathWorks. The PIL block, code generation, and communication all worked without issues.
Now, I’d like to run a similar PIL setup using the Infineon TLE9879 EVALKIT (based on an ARM Cortex-M0), which is not officially supported by Simulink as a target.
I’m wondering if it’s possible to configure PIL manually or via custom workflows. For example:
- Can I create a custom PIL target using Embedded Coder?
- Would I need to port rtiostream manually for communication over UART?
- Could I somehow integrate with Keil µVision (which I use for TLE9879) to build and run the generated code?
- Is there a workaround to simulate PIL behavior using a non-supported board?
My setup:
- Simulink R2024b
- Infineon TLE9879 EVALKIT
- Keil µVision 5 + Infineon Config Wizard
- UART and JTAG interfaces available
The main purpose is to validate control algorithms and measure execution time, not to implement a full HIL system.
Has anyone attempted PIL with a custom or unsupported microcontroller before? Any tips or resources would be greatly appreciated. Thanks in advance!
Simulinkモデルを生成AIで自動的に作成できたら便利だと思いませんか?
QiitaのSacredTubesさんは、このアイデアを実験的に試みた記事を公開しています。
その方法は、まず生成AIでVerilogコードを作成し、それをSimulinkに取り込んでモデル化するというものです。(ここではHDL Coderというツールボックスの機能が使われました:importhdl)
まだ実用段階には至っていませんが、モデルベース開発(MBD)と生成AIの可能性を探る上で、非常に興味深い試みです。
生成AIの限界と可能性を考えるきっかけとして、一読の価値があります。
---
もし「Simulink Copilot」のような生成AIツールが登場するとしたら、
どんな機能があったら嬉しいと思いますか?
- 自然言語でブロック図を生成?
- 既存モデルの自動ドキュメント化?
- シミュレーション結果の要約と解釈?
皆さんのアイデアをぜひシェアしてください!
Sto tentando inutilmente di salvare il valore dell'enegia che consumo ogni giorno nel field5 di questo canale: https://thingspeak.mathworks.com/channels/2851490 , ma inutilemte in quanto vengono visualizzati sempre e solo 2 dati anche se ho impostato days=30. Ho provato ad aumentare a 365 ma senza variazioni. Come mai?
- 昨日までちゃんと動いていたのに・・
- ヘルプページ通りに書いているのに・・
MATLAB 関数がエラーを出すようになることありますよね(?)そんな時にみなさんがまず確認するもの、何かありますか?教えてください!
例えば
which -all plot
をコマンドウィンドウで実行して、もともと MATLAB で定義されている plot 関数(MATLAB のインストールフォルダにある plot 関数)がちゃんと頭に出てくるかどうか確認します。
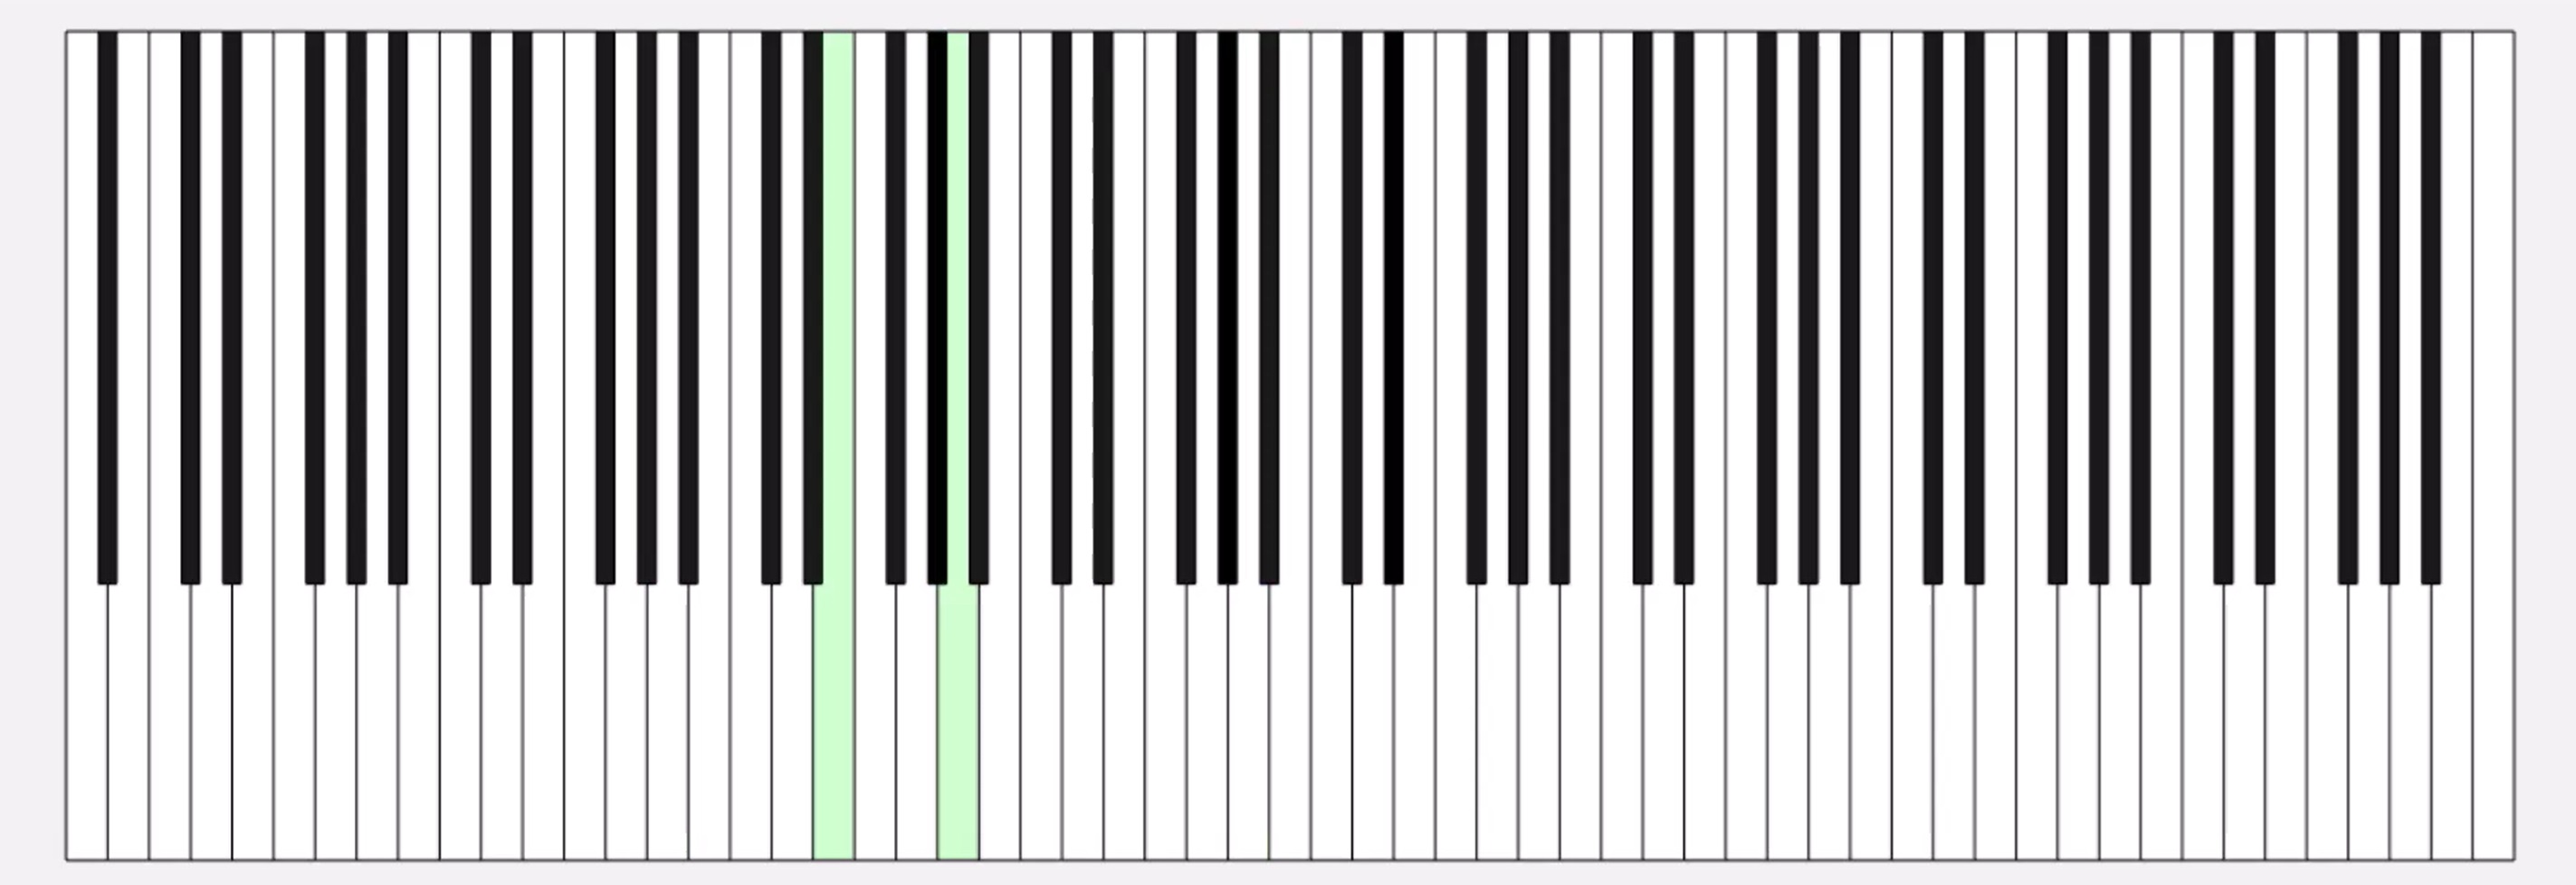
キーと値の組み合わせでデータを格納できるディクショナリ。R2022bでdictionaryコマンドが登場し、最近のバージョンではreaddictionaryとwritedictionaryでJSONファイルからの読み込み・書き込みにも対応しました。
私はMIDIデータからピアノの演奏動画を作るプログラムで、ディクショナリを使いました。音のノート番号をキーにして、patchで白と黒で鍵盤を塗りつぶしたmatlab.graphics.Graphicsデータ型を値にしたディクショナリで保存して、MIDIで鳴らされた音のノート番号からlookupでグラフのオブジェクトを取得し、FaceColorを変更してハイライトするというもの。
コード例
%% MIDIデータの.matファイルを読み取ってピアノを描画するサンプル
fig = figure('Position', [34 328 1626 524]);
ax = axes;
whiteKeyY = [0 0 150 150];
whiteKeyColor = [1 1 1];
blackKeyY = [50 50 150 150];
blackKeyColor = [0.1 0.1 0.1];
edgeColor = [0 0 0];
% ディクショナリの定義
d = configureDictionary("double", "matlab.graphics.Graphics");
% 白鍵を描画
for n = 1:9
pos = 23*7*(n-1);
d = insert(d, 21 + (n-1)*12, patch([pos+5 pos+28 pos+28 pos+5],whiteKeyY, whiteKeyColor, 'EdgeColor', edgeColor, 'UserData', 21 + (n-1)*12));
d = insert(d, 23 + (n-1)*12, patch([pos+28 pos+51 pos+51 pos+28], whiteKeyY, whiteKeyColor, 'EdgeColor', edgeColor, 'UserData', 23 + (n-1)*12));
d = insert(d, 24 + (n-1)*12, patch([pos+51 pos+74 pos+74 pos+51], whiteKeyY, whiteKeyColor, 'EdgeColor', edgeColor, 'UserData', 24 + (n-1)*12));
if n < 9
d = insert(d, 26 + (n-1)*12, patch([pos+74 pos+97 pos+97 pos+74], whiteKeyY, whiteKeyColor, 'EdgeColor', edgeColor, 'UserData', 26 + (n-1)*12));
d = insert(d, 28 + (n-1)*12, patch([pos+97 pos+120 pos+120 pos+97], whiteKeyY, whiteKeyColor, 'EdgeColor', edgeColor, 'UserData', 28 + (n-1)*12));
d = insert(d, 29 + (n-1)*12, patch([pos+120 pos+143 pos+143 pos+120], whiteKeyY, whiteKeyColor, 'EdgeColor', edgeColor, 'UserData', 29 + (n-1)*12));
d = insert(d, 31 + (n-1)*12, patch([pos+143 pos+166 pos+166 pos+143], whiteKeyY, whiteKeyColor, 'EdgeColor', edgeColor, 'UserData', 31 + (n-1)*12));
end
end
% 黒鍵を描画。白鍵の上になるようにループを分けています
for n = 1:9
pos = 23*7*(n-1);
d = insert(d, 22 + (n-1)*12, patch([pos+23 pos+33 pos+33 pos+23], blackKeyY, blackKeyColor, 'EdgeColor', [0 0 0], 'UserData', 22 + (n-1)*12));
if n < 9
d = insert(d, 25 + (n-1)*12, patch([pos+69 pos+79 pos+79 pos+69], blackKeyY, blackKeyColor, 'EdgeColor', [0 0 0], 'UserData', 25 + (n-1)*12));
d = insert(d, 27 + (n-1)*12, patch([pos+92 pos+102 pos+102 pos+92], blackKeyY, blackKeyColor, 'EdgeColor', [0 0 0], 'UserData', 27 + (n-1)*12));
d = insert(d, 30 + (n-1)*12, patch([pos+138 pos+148 pos+148 pos+138], blackKeyY, blackKeyColor, 'EdgeColor', [0 0 0], 'UserData', 30 + (n-1)*12));
d = insert(d, 32 + (n-1)*12, patch([pos+161 pos+171 pos+171 pos+161], blackKeyY, blackKeyColor, 'EdgeColor', [0 0 0], 'UserData', 32 + (n-1)*12));
end
end
xticklabels({})
yticklabels({})
xlim([5 1362])
drawnow
%% MIDI音源の.matファイルを読み込み
matData = load('fur-elise.mat');
msg = matData.receivedMessages;
eventTimes = [msg.Timestamp] - msg(1).Timestamp;
n = 1;
numNotes = 0;
lastNote = 0;
highlightedCircles = cell(1, 127);
% 音が鳴った鍵盤だけハイライトする
tic
while toc < max(eventTimes)
if toc > eventTimes(n)
thisMsg = msg(n);
if thisMsg.Type == "NoteOn"
numNotes = numNotes + 1;
lastNote = thisMsg.Note;
thisPatch = lookup(d, thisMsg.Note);
thisPatch.FaceColor = '#CCFFCC';
drawnow
elseif thisMsg.Type == "NoteOff"
numNotes = 0;
thisPatch = lookup(d, thisMsg.Note);
[~, ~, wOrB] = calcNotePos(thisMsg.Note);
if wOrB == "w"
thisPatch.FaceColor = 'white';
else
thisPatch.FaceColor = 'black';
end
drawnow
end
n = n+1;
end
end
%% サブ関数
function [pianoPos, centerPos, wOrB] = calcNotePos(note)
tempVar = idivide(int64(note), int64(12)); % 12で割った商
pos = 23*7*(tempVar-1);
switch mod(note, 12)
case 0 % C
pianoPos = pos + 62.5;
centerPos = 30;
wOrB = "w";
case 2 % D
pianoPos = pos + 85.5;
centerPos = 30;
wOrB = "w";
case 4 % E
pianoPos = pos + 108.5;
centerPos = 30;
wOrB = "w";
case 5 % F
pianoPos = pos + 131.5;
centerPos = 30;
wOrB = "w";
case 7 % G
pianoPos = pos + 154.5;
centerPos = 30;
wOrB = "w";
case 9 % A
pianoPos = pos + 177.5;
centerPos = 30;
wOrB = "w";
case 11 % B
pianoPos = pos + 200.5;
centerPos = 30;
wOrB = "w";
case 1 % C#
pianoPos = pos + 69;
centerPos = 100;
wOrB = "b";
case 3 % D#
pianoPos = pos + 92;
centerPos = 100;
wOrB = "b";
case 6 % F#
pianoPos = pos + 138;
centerPos = 100;
wOrB = "b";
case 8 % G#
pianoPos = pos + 161;
centerPos = 100;
wOrB = "b";
case 10 % A#
pianoPos = pos + 184;
centerPos = 100;
wOrB = "b";
end
end
皆さんはディクショナリを使ってますか? もし使っていたら、どういう活用をしているか、聞かせてください!
どの方法を使う事が多いですか?他によく使う方法があれば教えてくださいー。
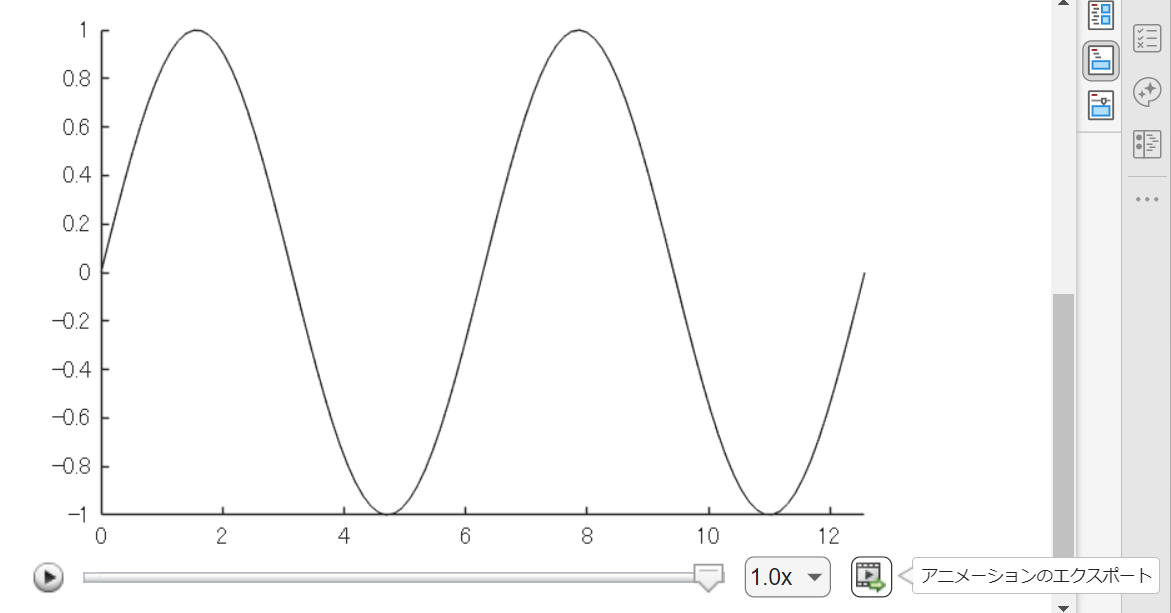
方法①
Livescript 上で for ループ内で描画を編集させて描いた動画は「アニメーションのエクスポート」から動画ファイルに出力するのが一番簡単ですね。再生速度やら細かい設定ができない点は要注意。
方法②
exportgraphics 関数で "Append" オプション指定で実現できるようになった(R2022a から)のでこれも便利ですね。
N = 100;
x = linspace(0,4*pi,N);
y = sin(x);
filename = 'animation_sample.gif'; % Specify the output file name
if exist(filename,'file')
delete(filename)
end
h = animatedline;
axis([0,4*pi,-1,1]) % x軸の表示範囲を固定
for k = 1:length(x)
addpoints(h,x(k),y(k)); % ループでデータを追加
exportgraphics(gca,filename,"Append",true)
end
方法③
R2021b 以前のバージョンだとこんな感じ。
各ループで画面キャプチャして、imwrite で動画ファイルにフレーム追加していくイメージです。"DelayTime" を使って細かい指定ができるので、必要に応じて今でも利用します。
for k = 1:length(x)
addpoints(h,x(k),y(k)); % ループでデータを追加
drawnow % グラフアップデート
frame = getframe(gcf); % Figure 画面をムービーフレーム(構造体)としてキャプチャ
tmp = frame2im(frame); % 画像に変更
[A,map] = rgb2ind(tmp,256); % RGB -> インデックス画像に
if k == 1 % 新規 gif ファイル作成
imwrite(A,map,filename,'gif','LoopCount',Inf,'DelayTime',0.2);
else % 以降、画像をアペンド
imwrite(A,map,filename,'gif','WriteMode','append','DelayTime',0.2);
end
end
これからは生成AIでコードを1から書くという事が減ってくるのかと思いますが,皆さんがMATLABのコードを書く時に意識しているご自身のルールのようなものがあれば教えてください.
MATLAB言語は柔軟に書けますが,自然と個人個人のルールというものが出来上がってきているのでは,と思います.
私はParameter, Valueペアの引数がある関数はそれぞれのペアを新しい行に書く,というのをよくやります.
h = plot(x, y, "ro-", ...
"LineWidth", 2, ...
"MarkerSize", 10, ...
"MarkerFaceColor", "g");
Parameter=Valueでも同じです.
h = plot(x, y, "ro-", ...
LineWidth = 2, ...
MarkerSize = 10, ...
MarkerFaceColor = "g");
また,一時期は "=" を揃えることもやってました(今はやってませんが).
h = plot(x, y, "ro-", ...
LineWidth = 2, ...
MarkerSize = 10, ...
MarkerFaceColor = "g");
皆さんにはどのようなルールがありますか?
The Graphics and App Building Blog just launched its first article on R2025a features, authored by Chris Portal, the director of engineering for the MATLAB graphics and app building teams.
Over the next few months, we'll publish a series of articles that showcase our updated graphics system, introduce new tools and features, and provide valuable references enriched by the perspectives of those involved in their development.
To stay updated, you can subscribe to the blog (look for the option in the upper left corner of the blog page). We also encourage you to join the conversation—your comments and questions under each article help shape the discussion and guide future content.
Bom dia se alguém puder me ajudar, meu código abaixo, não estou conseguintdo conectar o meu Esp8266 ao ThingSpeak, o erro tá na conexão. Estou usando o MicroPython e NodeMCU na plataforma Pytohn o sistema operacional Ubuntu 20
# DHT11 -> ESP8266/ESP32
# 1(Vcc) -> 3v3
# 2(Data) -> GPIO12
# 4(Gnd) -> Gnd
import time, network, machine
from dht import DHT11
from machine import Pin
from umqtt.simple import MQTTClient
print("Iniciando...")
dht = DHT11(Pin(12, Pin.IN, Pin.PULL_UP))
estacao = network.WLAN(network.STA_IF)
estacao.active(True)
estacao.connect('xxxxxxx', 'xxxxxxxxx')
while estacao.isconnected() == False:
machine.idle()
print('Conexao realizada.')
print(estacao.ifconfig())
SERVIDOR = "mqtt.thingspeak.com"
CHANNEL_ID = "XXXXXXXXXXXXXXXXX"
WRITE_API_KEY = "XXXXXXXXXXXXXXXXXXXXX"
topico = "channels/" + CHANNEL_ID + "/publish/" + WRITE_API_KEY
cliente = MQTTClient("umqtt_client", SERVIDOR)
try:
while True:
dht.measure()
temp = dht.temperature()
umid = dht.humidity()
print('Temperatura: %3.1f °C' %temp)
print('Umidade: %3.1f %%' %umid)
conteudo = "field1=" + str(temp) + "&field2=" + str(umid)
print ('Conectando a ThingSpeak...')
cliente.connect()
cliente.publish(topico, conteudo)
cliente.disconnect()
print ('Envio realizado.')
time.sleep(600.0)
except KeyboardInterrupt:
estacao.disconnect()
estacao.active(False)
print("Fim.")
*****************************************************************************************************
No shell aparece como resposta:
MPY: soft reboot
Iniciando...
Conexao realizada.
('192.168.0.23', '255.255.255.0', '192.168.0.1', '8.8.8.8')
Temperatura: 29.0 °C
Umidade: 63.0 %
Conectando a ThingSpeak...
Traceback (most recent call last):
File "<stdin>", line 38, in <module>
File "umqtt/simple.py", line 67, in connect
OSError: -2
linha 38 é cliente.connect()
昨日 5/29 にお台場で MATLAB EXPO が開催されました。ご参加くださった方々ありがとうございました!
私は AI 関連のデモ展示で解説員としても立っておりましたが、立ち寄ってくださる方が絶えず、ずっと喋り続けてました。また、講演後に「さっきのすごくね?」という会話が漏れ聞こえてきたのがハイライト。
参加されたみなさま、印象に残ったこと・気になった講演・ポスター・デモ・新機能等あったら教えてください!(次回に向けて運営面での感想も)
I want to use Simulink for model-based development of the TC3XX series development board, but I am not sure about the development process and toolchain? Is there a free toolchain available for me to use? Do you have a detailed development tutorial?
以前のEXPOでも参加・聴講したことがある
67%
知り合いから聞いた
0%
MathWorksからのプロモーション,EXPOサイトで知った
0%
今年のEXPO会場でたまたま見かけた
0%
ライトニングトークって何?
33%
3 votes
I have a pressure vs. time plot resulting from the input of an elastic wave, which I obtained from an Abaqus simulation. So, I have access to all the data. Now, I want to convert this time-domain graph into a frequency-domain graph using FFT in MATLAB.
I came across a code through ChatGPT, but I’m not fully confident in relying on it. Could anyone kindly clarify whether the formulas used for FFT in MATLAB are universal for all types of signals? Or is there a more effective and reliable method I should consider for this purpose?
Hi guys!
Im doing a project where i need to simulate a ship connected to the grid. I have a grid->converter AC-DC-AC -> dynamic load. My converter has to keep the voltage consistent and what changes is the current. Can somebody help me?