Results for
Is there a hardware support package available for the MP series?
I'm facing an issue where my Thinkspeak graph is not displaying, even though I'm using exactly the same code as my friend. The code works perfectly in their Thinkspeak account, but not on mine. I've checked the API keys, channel settings, and data formats, but everything seems similar. Has anyone else faced this problem, or do you have tips on what to check next? Suggestions are welcome!
Hi!
I'm having trouble sending data to a channel using MQTT. I'm using a program that was working perfectly until just a few days ago, but after making some minor changes yesterday, it stopped working. I’ve also tested it manually using the MQTTX client. If I send data using CURL and GET, it works fine.
It’s a bit strange...
Thankfully,
Ernesto.
Is it possible to create a Simulink model that is independent of specific microcontrollers?
For example, in the model, the STM32 block is used for CAN transmission. But if I want to deploy the same model to an Arduino, I have to replace the STM32 block with an Arduino-compatible one.
So, is it possible to create a custom block or abstraction that works across multiple microcontrollers like STM32, PIC32, and Arduino without changing the hardware-specific block each time?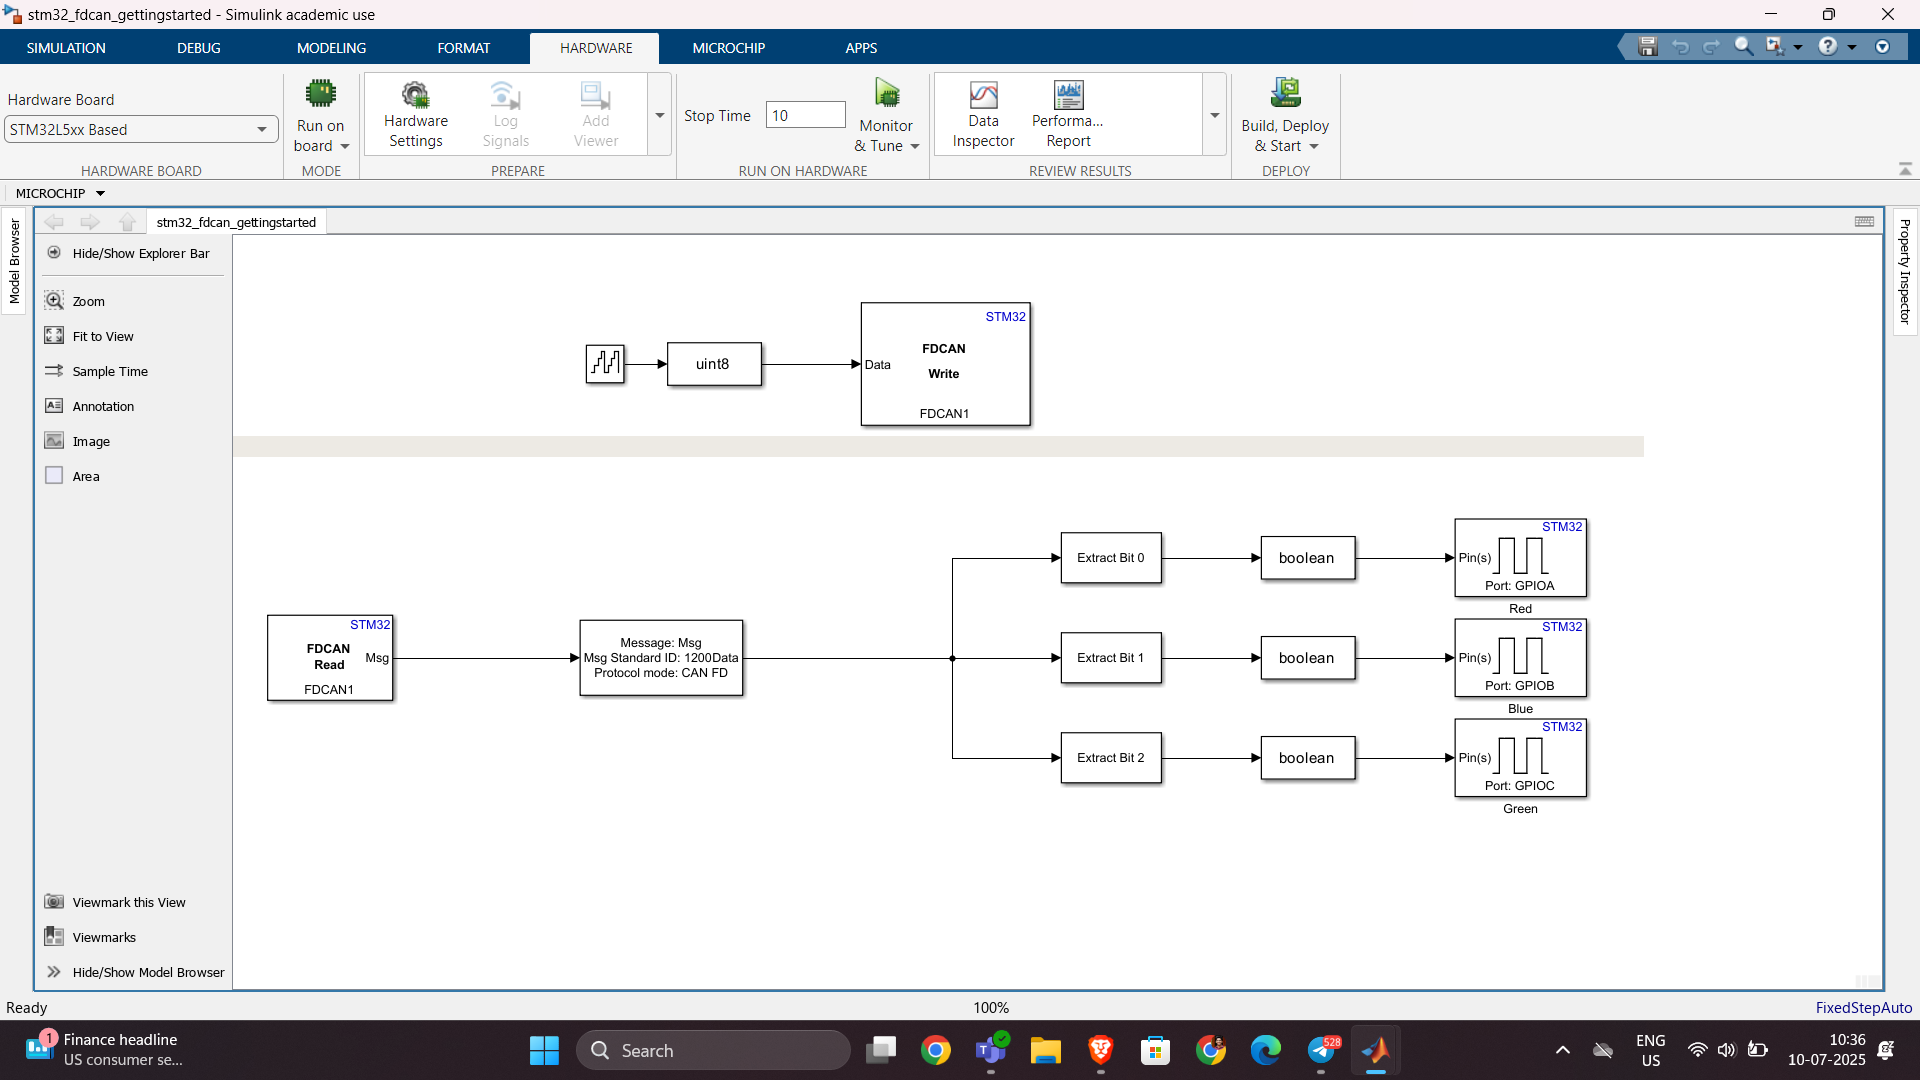
Hello,
I've successfully tested the Processor-in-the-Loop (PIL) workflow in Simulink using a TI F28069M LaunchPad, following the standard examples provided by MathWorks. The PIL block, code generation, and communication all worked without issues.
Now, I’d like to run a similar PIL setup using the Infineon TLE9879 EVALKIT (based on an ARM Cortex-M0), which is not officially supported by Simulink as a target.
I’m wondering if it’s possible to configure PIL manually or via custom workflows. For example:
- Can I create a custom PIL target using Embedded Coder?
- Would I need to port rtiostream manually for communication over UART?
- Could I somehow integrate with Keil µVision (which I use for TLE9879) to build and run the generated code?
- Is there a workaround to simulate PIL behavior using a non-supported board?
My setup:
- Simulink R2024b
- Infineon TLE9879 EVALKIT
- Keil µVision 5 + Infineon Config Wizard
- UART and JTAG interfaces available
The main purpose is to validate control algorithms and measure execution time, not to implement a full HIL system.
Has anyone attempted PIL with a custom or unsupported microcontroller before? Any tips or resources would be greatly appreciated. Thanks in advance!
Sto tentando inutilmente di salvare il valore dell'enegia che consumo ogni giorno nel field5 di questo canale: https://thingspeak.mathworks.com/channels/2851490 , ma inutilemte in quanto vengono visualizzati sempre e solo 2 dati anche se ho impostato days=30. Ho provato ad aumentare a 365 ma senza variazioni. Come mai?
The Graphics and App Building Blog just launched its first article on R2025a features, authored by Chris Portal, the director of engineering for the MATLAB graphics and app building teams.
Over the next few months, we'll publish a series of articles that showcase our updated graphics system, introduce new tools and features, and provide valuable references enriched by the perspectives of those involved in their development.
To stay updated, you can subscribe to the blog (look for the option in the upper left corner of the blog page). We also encourage you to join the conversation—your comments and questions under each article help shape the discussion and guide future content.
Bom dia se alguém puder me ajudar, meu código abaixo, não estou conseguintdo conectar o meu Esp8266 ao ThingSpeak, o erro tá na conexão. Estou usando o MicroPython e NodeMCU na plataforma Pytohn o sistema operacional Ubuntu 20
# DHT11 -> ESP8266/ESP32
# 1(Vcc) -> 3v3
# 2(Data) -> GPIO12
# 4(Gnd) -> Gnd
import time, network, machine
from dht import DHT11
from machine import Pin
from umqtt.simple import MQTTClient
print("Iniciando...")
dht = DHT11(Pin(12, Pin.IN, Pin.PULL_UP))
estacao = network.WLAN(network.STA_IF)
estacao.active(True)
estacao.connect('xxxxxxx', 'xxxxxxxxx')
while estacao.isconnected() == False:
machine.idle()
print('Conexao realizada.')
print(estacao.ifconfig())
SERVIDOR = "mqtt.thingspeak.com"
CHANNEL_ID = "XXXXXXXXXXXXXXXXX"
WRITE_API_KEY = "XXXXXXXXXXXXXXXXXXXXX"
topico = "channels/" + CHANNEL_ID + "/publish/" + WRITE_API_KEY
cliente = MQTTClient("umqtt_client", SERVIDOR)
try:
while True:
dht.measure()
temp = dht.temperature()
umid = dht.humidity()
print('Temperatura: %3.1f °C' %temp)
print('Umidade: %3.1f %%' %umid)
conteudo = "field1=" + str(temp) + "&field2=" + str(umid)
print ('Conectando a ThingSpeak...')
cliente.connect()
cliente.publish(topico, conteudo)
cliente.disconnect()
print ('Envio realizado.')
time.sleep(600.0)
except KeyboardInterrupt:
estacao.disconnect()
estacao.active(False)
print("Fim.")
*****************************************************************************************************
No shell aparece como resposta:
MPY: soft reboot
Iniciando...
Conexao realizada.
('192.168.0.23', '255.255.255.0', '192.168.0.1', '8.8.8.8')
Temperatura: 29.0 °C
Umidade: 63.0 %
Conectando a ThingSpeak...
Traceback (most recent call last):
File "<stdin>", line 38, in <module>
File "umqtt/simple.py", line 67, in connect
OSError: -2
linha 38 é cliente.connect()
I want to use Simulink for model-based development of the TC3XX series development board, but I am not sure about the development process and toolchain? Is there a free toolchain available for me to use? Do you have a detailed development tutorial?
I have a pressure vs. time plot resulting from the input of an elastic wave, which I obtained from an Abaqus simulation. So, I have access to all the data. Now, I want to convert this time-domain graph into a frequency-domain graph using FFT in MATLAB.
I came across a code through ChatGPT, but I’m not fully confident in relying on it. Could anyone kindly clarify whether the formulas used for FFT in MATLAB are universal for all types of signals? Or is there a more effective and reliable method I should consider for this purpose?
Hi guys!
Im doing a project where i need to simulate a ship connected to the grid. I have a grid->converter AC-DC-AC -> dynamic load. My converter has to keep the voltage consistent and what changes is the current. Can somebody help me?
Large Languge model with MATLAB, a free add-on that lets you access LLMs from OpenAI, Azure, amd Ollama (to use local models) on MATLAB, has been updated to support OpenAI GPT-4.1, GPT-4.1 mini, and GPT-4.1 nano.
According to OpenAI, "These models outperform GPT‑4o and GPT‑4o mini across the board, with major gains in coding and instruction following. They also have larger context windows—supporting up to 1 million tokens of context—and are able to better use that context with improved long-context comprehension."
What would you build with the latest update?

Provide insightful answers
9%
Provide label-AI answer
9%
Provide answer by both AI and human
21%
Do not use AI for answers
46%
Give a button "chat with copilot"
10%
use AI to draft better qustions
5%
1561 votes
%% 清理环境
close all; clear; clc;
%% 模拟时间序列
t = linspace(0,12,200); % 时间从 0 到 12,分 200 个点
% 下面构造一些模拟的"峰状"数据,用于演示
% 你可以根据需要替换成自己的真实数据
rng(0); % 固定随机种子,方便复现
baseIntensity = -20; % 强度基线(z 轴的最低值)
numSamples = 5; % 样本数量
yOffsets = linspace(20,140,numSamples); % 不同样本在 y 轴上的偏移
colors = [ ...
0.8 0.2 0.2; % 红
0.2 0.8 0.2; % 绿
0.2 0.2 0.8; % 蓝
0.9 0.7 0.2; % 金黄
0.6 0.4 0.7]; % 紫
% 构造一些带多个峰的模拟数据
dataMatrix = zeros(numSamples, length(t));
for i = 1:numSamples
% 随机峰参数
peakPositions = randperm(length(t),3); % 三个峰位置
intensities = zeros(size(t));
for pk = 1:3
center = peakPositions(pk);
width = 10 + 10*rand; % 峰宽
height = 100 + 50*rand; % 峰高
% 高斯峰
intensities = intensities + height*exp(-((1:length(t))-center).^2/(2*width^2));
end
% 再加一些小随机扰动
intensities = intensities + 10*randn(size(t));
dataMatrix(i,:) = intensities;
end
%% 开始绘图
figure('Color','w','Position',[100 100 800 600],'Theme','light');
hold on; box on; grid on;
for i = 1:numSamples
% 构造 fill3 的多边形顶点
xPatch = [t, fliplr(t)];
yPatch = [yOffsets(i)*ones(size(t)), fliplr(yOffsets(i)*ones(size(t)))];
zPatch = [dataMatrix(i,:), baseIntensity*ones(size(t))];
% 使用 fill3 填充面积
hFill = fill3(xPatch, yPatch, zPatch, colors(i,:));
set(hFill,'FaceAlpha',0.8,'EdgeColor','none'); % 调整透明度、去除边框
% 在每条曲线尾部标注 Sample i
text(t(end)+0.3, yOffsets(i), dataMatrix(i,end), ...
['Sample ' num2str(i)], 'FontSize',10, ...
'HorizontalAlignment','left','VerticalAlignment','middle');
end
%% 坐标轴与视角设置
xlim([0 12]);
ylim([0 160]);
zlim([-20 350]);
xlabel('Time (sec)','FontWeight','bold');
ylabel('Frequency (Hz)','FontWeight','bold');
zlabel('Intensity','FontWeight','bold');
% 设置刻度(根据需要微调)
set(gca,'XTick',0:2:12, ...
'YTick',0:40:160, ...
'ZTick',-20:40:200);
% 设置视角(az = 水平旋转,el = 垂直旋转)
view([211 21]);
% 让三维坐标轴在后方
set(gca,'Projection','perspective');
% 如果想去掉默认的坐标轴线,也可以尝试
% set(gca,'BoxStyle','full','LineWidth',1.2);
%% 可选:在后方添加一个浅色网格平面 (示例)
% 这个与题图右上方的网格类似
[Xplane,Yplane] = meshgrid([0 12],[0 160]);
Zplane = baseIntensity*ones(size(Xplane)); % 在 Z = -20 处画一个竖直面的框
surf(Xplane, Yplane, Zplane, ...
'FaceColor',[0.95 0.95 0.9], ...
'EdgeColor','k','FaceAlpha',0.3);
%% 进一步美化(可根据需求调整)
title('3D Stacked Plot Example','FontSize',12);
constantplane("x",12,FaceColor=rand(1,3),FaceAlpha=0.5);
constantplane("y",0,FaceColor=rand(1,3),FaceAlpha=0.5);
constantplane("z",-19,FaceColor=rand(1,3),FaceAlpha=0.5);
hold off;

Have fun! Enjoy yourself!
Hello Community,
We're excited to announce that registration is now open for the MathWorks AUTOMOTIVE CONFERENCE 2025! This event presents a fantastic opportunity to connect with MathWorks and industry experts while exploring the latest trends in the automotive sector.
Event Details:
- Date: April 29, 2025
- Location: St. John’s Resort, Plymouth, MI
Featured Topics:
- Virtual Development
- Electrification
- Software Development
- AI in Engineering
Whether you're a professional in the automotive industry or simply interested in these cutting-edge topics, we highly encourage you to register for this conference.
We look forward to seeing you there!
We are excited to announce another update to our Discussions area: the new Contribution Widget! The new widget simplifies the process of creating diverse types of content, whether you're praising someone who has helped you, sharing tips and tricks, or polling the community.

Previously, creating various types of content required navigating multiple links or channels. With the new Contribution Widget, everything you need is conveniently located in one place.
Give it a try and let us know how we can further enhance your user experience.
P.S. Who has been particularly helpful to you lately? Create your first praise post and let them know!
We are excited to announce the first edition of the MathWorks AI Challenge. You’re invited to submit innovative solutions to challenges in the field of artificial intelligence. Choose a project from our curated list and submit your solution for a chance to win up to $1,000 (USD). Showcase your creativity and contribute to the advancement of AI technology.
Hello ThingSpeak Community,
I have an energy meter sending data of energy consumed in 4 rooms in hexadecimal values to Sigfox and I was trying to decode the payload and route it to ThingSpeak.
All the datas are sent at the same time.
But ThingSpeak only receives 1 of them and plots them.
However, the rest 3 are missing. Is this because I am trying the free version ?
Would the payed version be capable of receiving all the 4 messages ?
Creating data visualizations
79%
Interpreting data visualizations
21%
28 votes