Results for
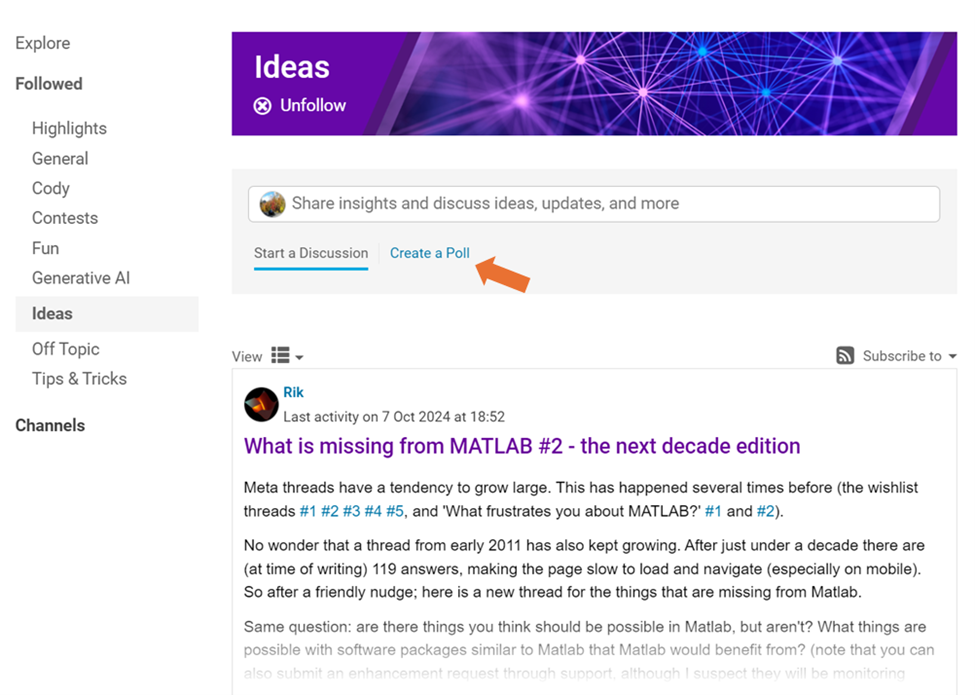
We are thrilled to announce that every community member now has the ability to create a poll in Discussions, allowing you to gather votes and opinions from the community.
How to create a poll:
You can find the ‘Create a Poll’ link just below the text box (see screenshot below). Please note that the default type of content is a ‘Discussion’. To start a poll, simply click the link.
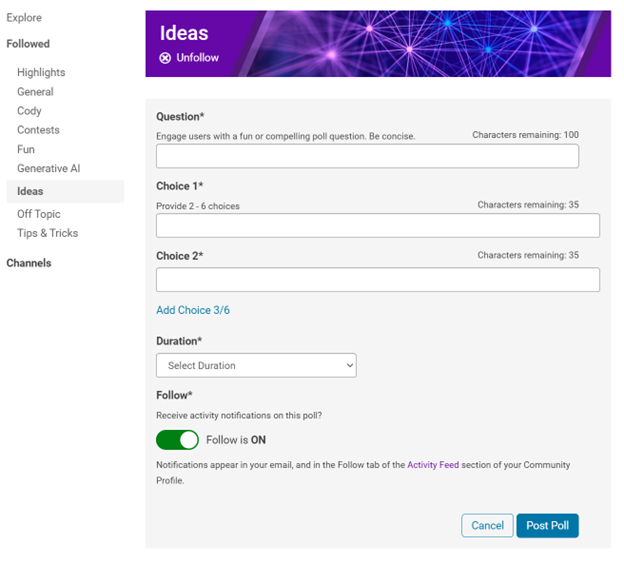
Creating a poll is straightforward. You can add up to 6 choices for your poll and set the duration from 1 to 6 weeks.
Where to find the poll
Polls created by community members will appear only in the channel where they are created and the landing page of Discussions area. Discussions moderators have the privilege to feature/broadcast the poll across Answers, File Exchange, and Cody.
Thoughts?
We can’t wait to see what interesting polls our community will create. Meanwhile, if you have any questions or suggestions, feel free to leave a comment.
Hi, My data send to thingspeak is not received/updated for the last 6 hours on the charts and dials. All worked well till about 6 hour ago. I am using Node-red and the API Url: https://thingspeak.com
Any help please?
Greetings Gert
To solve issues around the browsers blocking 3p cookies and having different behavior across different browsers, the ThingSpeak website is now served from https://thingspeak.mathworks.com. There are no changes required from devices or users. Just log in and use the service as you always did.
If you are interested in AI, Autonomous Systems and Robotics, and the future of engineering, don't miss out on MATLAB EXPO 2024 and register now.
You will have the opportunity to connect with engineers, scientists, educators, and researchers, and new ideas.
Featured Sessions:
- From Embedded to Empowered: The Rise of Software-Defined Products - María Elena Gavilán Alfonso, MathWorks
- The Empathetic Engineers of Tomorrow - Dr. Darryll Pines, University of Maryland
- A Model-Based Design Journey from Aerospace to an Artificial Pancreas System - Louis Lintereur, Medtronic Diabetes
Featured Topics:
- AI
- Autonomous Systems and Robotics
- Electrification
- Algorithm Development and Data Analysis
- Modeling, Simulation, Verification, Validation, and Implementation
- Wireless Communications
- Cloud, Software Factories, and DevOps
- Preparing Future Engineers and Scientists

We are thrilled to announce the redesign of the Discussions leaf page, with a new user-focused right-hand column!
Why Are We Doing This?
- Address Readers’ Needs:
Previously, the right-hand column displayed related content, but feedback from our community indicated that this wasn't meeting your needs. Many of you expressed a desire to read more posts from the same author but found it challenging to locate them.
With the new design, readers can easily learn more about the author, explore their other posts, and follow them to receive notifications on new content.
- Enhance Authors’ Experience:
Since the launch of the Discussions area earlier this year, we've seen an influx of community members sharing insightful technical articles, use cases, and ideas. The new design aims to help you grow your followers and organize your content more effectively by editing tags. We highly encourage you to use the Discussions area as your community blogging platform.
We hope you enjoy the new design of the right-hand column. Please feel free to share your thoughts and experiences by leaving a comment below.
I left the code unchanged, modifying only secrets.h.
I am using an ESP32-WROOM -32U
Connection to network succeeds, but ThingSpeak.writeFields fails every time, with HTTP error code 400.
The sketch I am really trying to use is loosely based on this example, accesses Time and Weather info with no problems, but ThingSpeak.writeFields fails with HTTP error code 301.
This is my first attempt to use ThingSpeak.
Is this example sketch still valid, or must I look elsewhere? Suggestions please.
Hi everyone,
I'm working on a school project where I need to send sensor data from my Arduino to a Power BI REST API using ThingsHTTP. I've been trying to get this to work, but I'm running into errors like this:
{"error":{"code":"InvalidRequest","message":"Error parsing request for dataset sobe_wowvirtualserver|a7b68fb5-533b-471f-a5da-3bdd6746ee16: Conversion error on column '<pi>pH</pi>': <pi>Input string was not in a correct format.</pi>"}}
I'm a beginner with this, and I'm not sure what I'm doing wrong. What steps should I take to resolve this issue? Also, does anyone know the correct format for an HTTP request body when sending dynamic sensor data?
This is the body format I'm trying to send to Power BI:
[
{
"pH": 98.6,
"TDS": 98.6,
"turbidity": 98.6,
"temperature": 98.6
}
]
Any advice on how to construct the HTTP body with values that change over time would be greatly appreciated! Thanks in advance!"
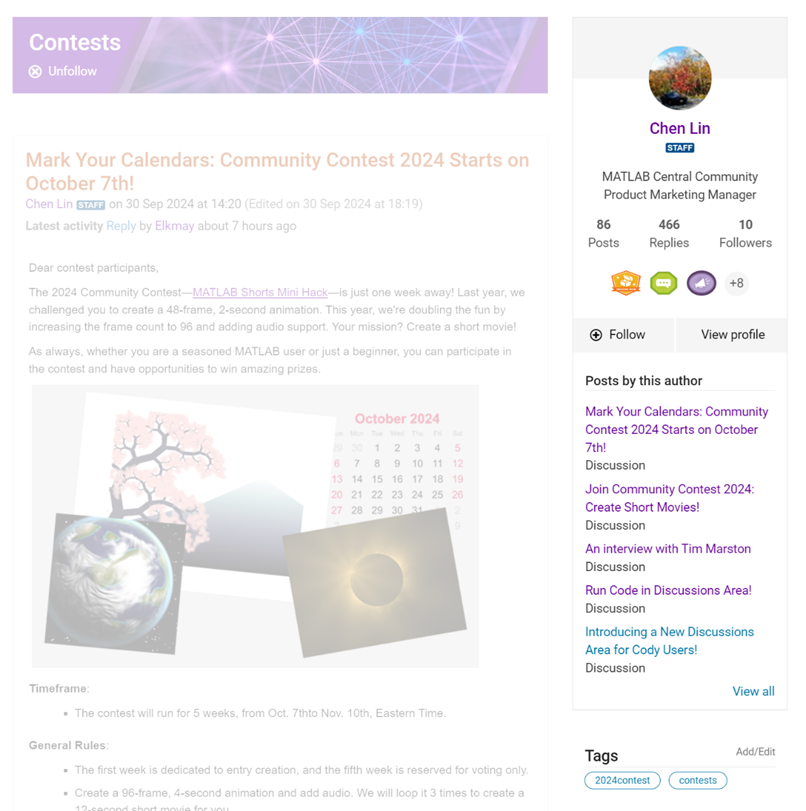
We are excited to invite you to join our 2024 community contest – MATLAB Shorts Mini Hack! Last year, we challenged you to create a 48-frame animation. In 2024, we are increasing the frame count to 96 and supporting audio. Your mission? Create a short movie!
Whether you are a seasoned MATLAB user or just a beginner, you can participate in the contest and have opportunities to win amazing prizes. Be sure to check out our Blog post for more details on the Community Contests.
Timeframe
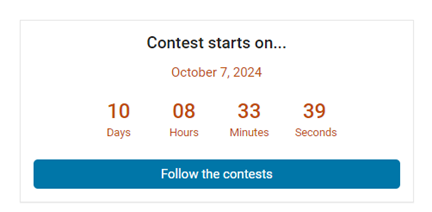
This contest runs for 5 weeks, from Oct. 7th to Nov. 10th.
How to Participate
- Create a new short movie or remix an existing one with up to 2,000 characters of code.
- Vote or comment on the short movies you love!
Prizes
You will have opportunities to win compelling prizes, including Amazon gift cards, MathWorks T-shirts, and virtual badges. We will give out both weekly prizes and grand prizes.
Stay Informed
Make sure to follow the contest to get important announcements and your prize updates.
The AI Chat Playground at MATLAB Central has two new upgrades: OpenAI GPT-4o mini and MATLAB R2024b!
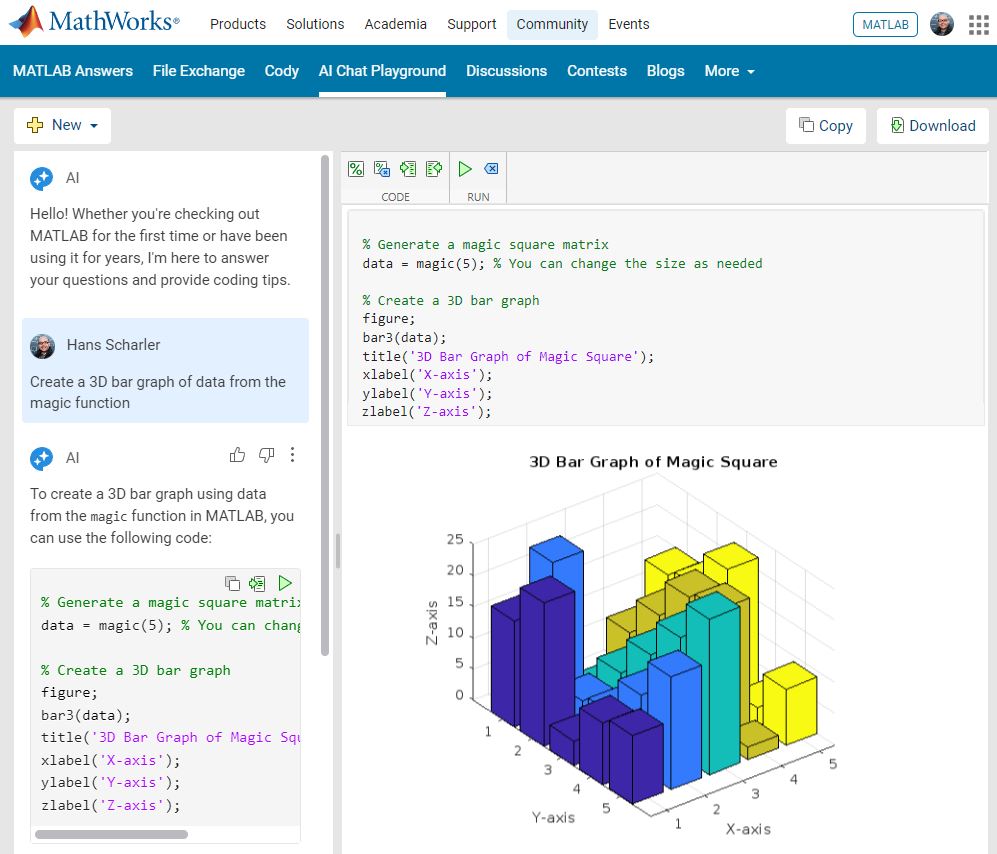
GPT-4o mini is a new language model from OpenAI and brings general knowledge up to October 2023. GPT-4o mini surpasses GPT-3.5 Turbo and other small models on academic benchmarks across both textual intelligence and reasoning. Our goal is to keep improving the output of the AI Chat Playground. This upgrade is available now: https://www.mathworks.com/matlabcentral/playground/
One more thing... we also updated the system to the latest release of MATLAB. This is R2024b and comes with hundreds of updates and new plot types to explore.Check out Mike Croucher's blog post about the latest version of MATLAB: https://blogs.mathworks.com/matlab/2024/09/13/the-latest-version-of-matlab-r2024b-has-just-been-released/
We are looking forward to your feedback on the updates to the AI Chat Playground. Let us know what you think and how you use this community app.
hope this message finds you well. I am currently working on a project involving the design and numerical simulation of metalenses using Zemax and MATLAB. The design phase involves saving phase data from the Zemax simulation, which is later used in a numerical script to generate the metalens in MATLAB.
I have a MATLAB file that contains the phase data saved from Zemax, but I am unsure of the specific method or format used to extract and save the data from Zemax. The phase data I currently have in MATLAB is as follows:
- Phase matrix: 571 x 571 (double)
- X data: 571 x 1 (double)
- Y data: 571 x 1 (double)
Could you please provide guidance on:
- How this phase data was likely saved from Zemax into MATLAB?
- What steps or scripts were used to extract this information from the design, particularly the 571 x 571 phase matrix and the corresponding X and Y data?
- Any best practices or tools available in Zemax for exporting such data?
This information will help me reproduce the workflow and proceed with my analysis.
Thank you for your support. I look forward to your guidance.
Best regards,
Zaka
Always!
29%
It depends
14%
Never!
21%
I didn't know that was possible
36%
1810 votes
I went to perform an IoT for an automated plantation but the same error always occurs to me when I upload it to the mcu node, which is: Connection to ThingSpeak failed.
Hello everyone,
Over the past few weeks, our community members have shared some incredible insights and resources. Here are some highlights worth checking out:
Interesting Questions
Johnathan is seeking help with implementing a complex equation into MATLAB's curve fitting toolbox. If you have experience with curve fitting or MATLAB, your input could be invaluable!
Popular Discussions
Athanasios continues his exploration of the Duffing Equation, delving into its chaotic behavior. It's a fascinating read for anyone interested in nonlinear dynamics or chaos theory.
John shares his playful exploration with MATLAB to find a generative equation for a sequence involving Fibonacci numbers. It's an intriguing challenge for those who love mathematical puzzles.
From File Exchange
Ayesha provides a graphical analysis of linearised models in epidemiology, offering a detailed look at the dynamics of these systems. This resource is perfect for those interested in mathematical modeling.
Gareth brings some humor to MATLAB with a toolbox designed to share jokes. It's a fun way to lighten the mood during conferences or meetups.
From the Blogs
Ned Gulley interviews Tim Marston, the 2023 MATLAB Mini Hack contest winner. Tim's creativity and skills are truly inspiring, and his story is a must-read for aspiring programmers.
Sivylla discusses the integration of AI with embedded systems, highlighting the benefits of using MATLAB and Simulink. It's an insightful read for anyone interested in the future of AI technology.
Thank you to all our contributors for sharing your knowledge and creativity. We encourage everyone to engage with these posts and continue fostering a vibrant and supportive community.
Happy exploring!
Explore the newest online training courses, available as of 2024b: one new Onramp, eight new short courses, and one new learning path. Yes, that’s 10 new offerings. We’ve been busy.
As a reminder, Onramps are free to all. Short courses and learning paths require a subscription to the Online Training Suite (OTS).
- Multibody Simulation Onramp
- Analyzing Results in Simulink
- Battery Pack Modeling
- Introduction to Motor Control
- Signal Processing Techniques for Streaming Signals
- Core Signal Processing Techniques in MATLAB (learning path – includes the four short courses listed below)
It's been over six years since I've written any serious MATLAB code, so I thought it would be fun to see how easily ChatGPT could help me out. While others have probably already used ChatGPT to generate MATLAB code, I didn't find any evidence of it when I searched through the ThingSpeak forum. That inspired me to post an example to get people thinking about it.
This example reads four temperature fields from the same channel and plots them on a single graph.
My ChatGPT prompt:
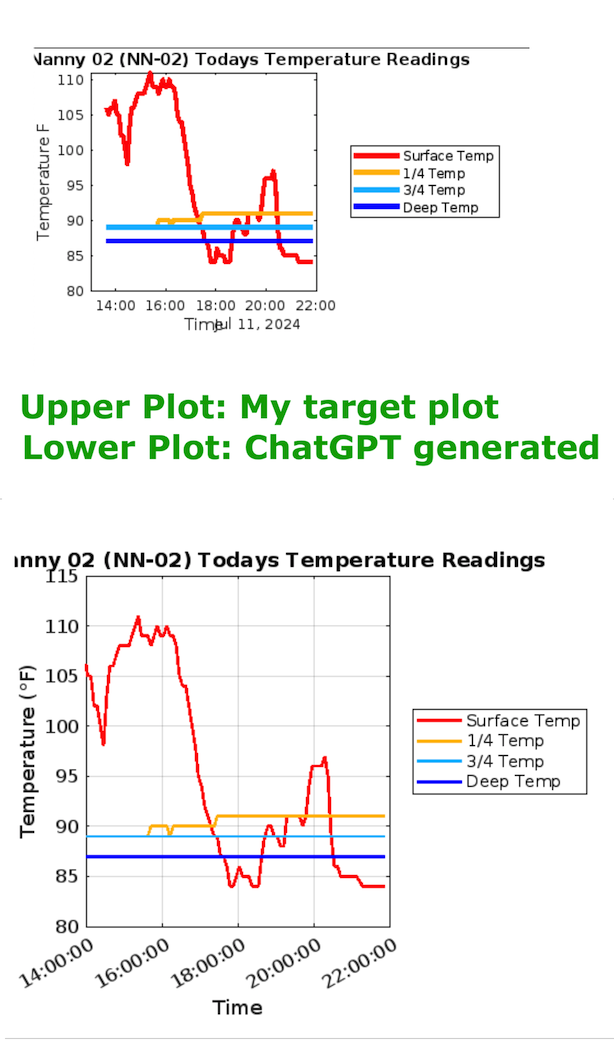
The prompt is pretty straightforward and essentially walks through all the elements of the chart that I wanted. It's also important to consider any filtering or "data cleansing" that should be done. Since this was my first time doing this, I decided to use an existing plot I was already familiar with as my "target state".
The prompt: "I would like you to generate some MATLAB code to create what is called a MATLAB Visualization. Its purpose will be to generate a chart of 4 fields found in a ThingSpeak channel. The ThingSpeak channel name is "Nest Nanny 2 (NN-02)" and its channel id (needed for the code) is xxxxxxx. The read api key is XXXXXXXXXXXXXXXX. The chart title should be "Nest Nanny 02 (NN-02) Todays Temperature Readings" It should plot data from 4 fields (field 3 - 6) who's names are "Surface Temp", "1/4 Temp", "3/4 Temp", and "Deep Temp". I would like the plot lines for these 4 fields to be different colors (red, orange, cyan, and blue) but on the same chart. I would like Temperature in Fahrenheit to be on the Y axis and Time on the x axis. I would like it to display the last 100 data points. I'd like to use this colororder. colororder(["#FF0000","#FFBB00","#00BBFF", "#0000FF"]) I would like the legend to be to the right of the chart, not contained within the chart. No temperature data should have a value of 50 or less and we can assume it's a sensor issue when this is observed. If a data value is 50 or less, use the value of it's nearest (in the time series) non-zero, non-negative value for that field. The data is stored in the channel as Fahrenheit and does not need to be converted from Celsius. "
Because I did this exercise using an existing plot and had a clear objective in mind, it was relatively quick to iterate four or five times with ChatGPT to refine my prompt. In just a few minutes, the generated plot almost perfectly matched my existing plot. (I xxxx'ed out the channel ID and API key before posting.) For someone who now only occasionally uses MATLAB, this approach saves time and will hopefully allow me to tap into elements of MATLAB that are now beyond my skill level and memory. ;)
ChatGPT generated MATLAB code:
% MATLAB code to create a ThingSpeak Visualization for temperature readings
% Define channel ID and Read API Key
channelID = xxxxxxx;
readAPIKey = 'XXXXXXXXXXXXXXXX';
% Number of data points to retrieve
numPoints = 100;
% Read data from the ThingSpeak channel for fields 3 to 6
[data, time] = thingSpeakRead(channelID, ...
'Fields', [3 4 5 6], ...
'NumPoints', numPoints, ...
'ReadKey', readAPIKey);
% Replace any value 50 or less with the nearest non-zero, non-negative value
for i = 1:size(data, 2)
% Identify indices where the data is 50 or less
badIndices = find(data(:,i) <= 50);
% Identify indices where the data is valid (greater than 50)
validIndices = find(data(:,i) > 50);
% Interpolate to replace bad values
if ~isempty(validIndices)
data(badIndices, i) = interp1(validIndices, data(validIndices, i), badIndices, 'linear', 'extrap');
end
end
% Plot the data
figure;
colororder(["#FF0000","#FFBB00","#00BBFF", "#0000FF"]); % Set the color order
plot(time, data(:,1), 'LineWidth', 2); hold on;
plot(time, data(:,2), 'LineWidth', 2);
plot(time, data(:,3), 'LineWidth', 2);
plot(time, data(:,4), 'LineWidth', 2);
hold off;
% Add labels and title
xlabel('Time');
ylabel('Temperature (°F)');
title('Nest Nanny 02 (NN-02) Todays Temperature Readings');
% Add legend and move it to the right of the chart
legend({'Surface Temp', '1/4 Temp', '3/4 Temp', 'Deep Temp'}, ...
'Location', 'eastoutside');
% Format the time on the x-axis
datetick('x', 'HH:MM:SS', 'keepticks');
grid on;
% Adjust the figure for better readability
set(gca, 'FontSize', 12);
Plot Comparison:
I am creating an ESP32 device which will upload data to thingspeak channel and I want the data to be displayed on my website after login. I have succesfully completed the first part of uploading the data to thingspeak. Any suggestions with second part will be very much appreciated.
Hi,
I tried several times to clear my channel data.
I would expect, when I click on Channel settings-clear channel all data from the channel is gone.
For me the data stay in. Delete channel works fine.
Is there a trick?
many thanks for your help
HEP
I'm almost embarressed enough to not ask this. :) I assumed sorting the "Updated" column in the "My Channels" view would sort my channels based on when data was last written to (last updated to) the channel
However, I have channels that have received date in August and yet the date/time stamp in the Uodated column displays a June date and therefore they sort in the wrong order. Does "update" mean something other than a data update, such as a settings update? If so, if there a way to sort the channels by the more recent data update?
With a deployment of ThingSpeak on August 15th, 2024, we are using a new library for visualization of ThingSpeak channel charts. This should require no changes on your part. If you notice any discrepancies/differences in your channel visualization, please post a screenshot on this thread.
Swimming, diving
16%
Other water-based sport
4%
Gymnastics
20%
Other indoor arena sport
15%
track, field
24%
Other outdoor sport
21%
346 votes