Results for
Over at Reddit, a MATLAB user asked about when to use a script vs. a live script. How would you answer this?
Starting with MATLAB can be daunting, but the right resources make all the difference. In my experience, the combination of MATLAB Onramp and Cody offers an engaging start.
MATLAB Onramp introduces you to MATLAB's basic features and workflows. Then practice your coding skill on Cody. Challenge yourself to solve 1 basic problem every day for a month! This consistent practice can significantly enhance your proficiency.
What other resources have helped you on your MATLAB journey? Share your recommendations and let's create a comprehensive learning path for beginners!
I would tell myself to understand vectorization. MATLAB is designed for operating on whole arrays and matrices at once. This is often more efficient than using loops.
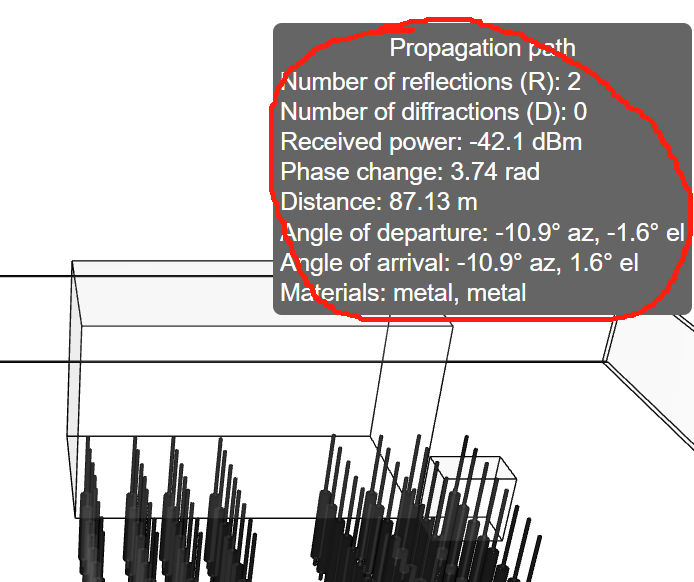
how can I do to get those informations?
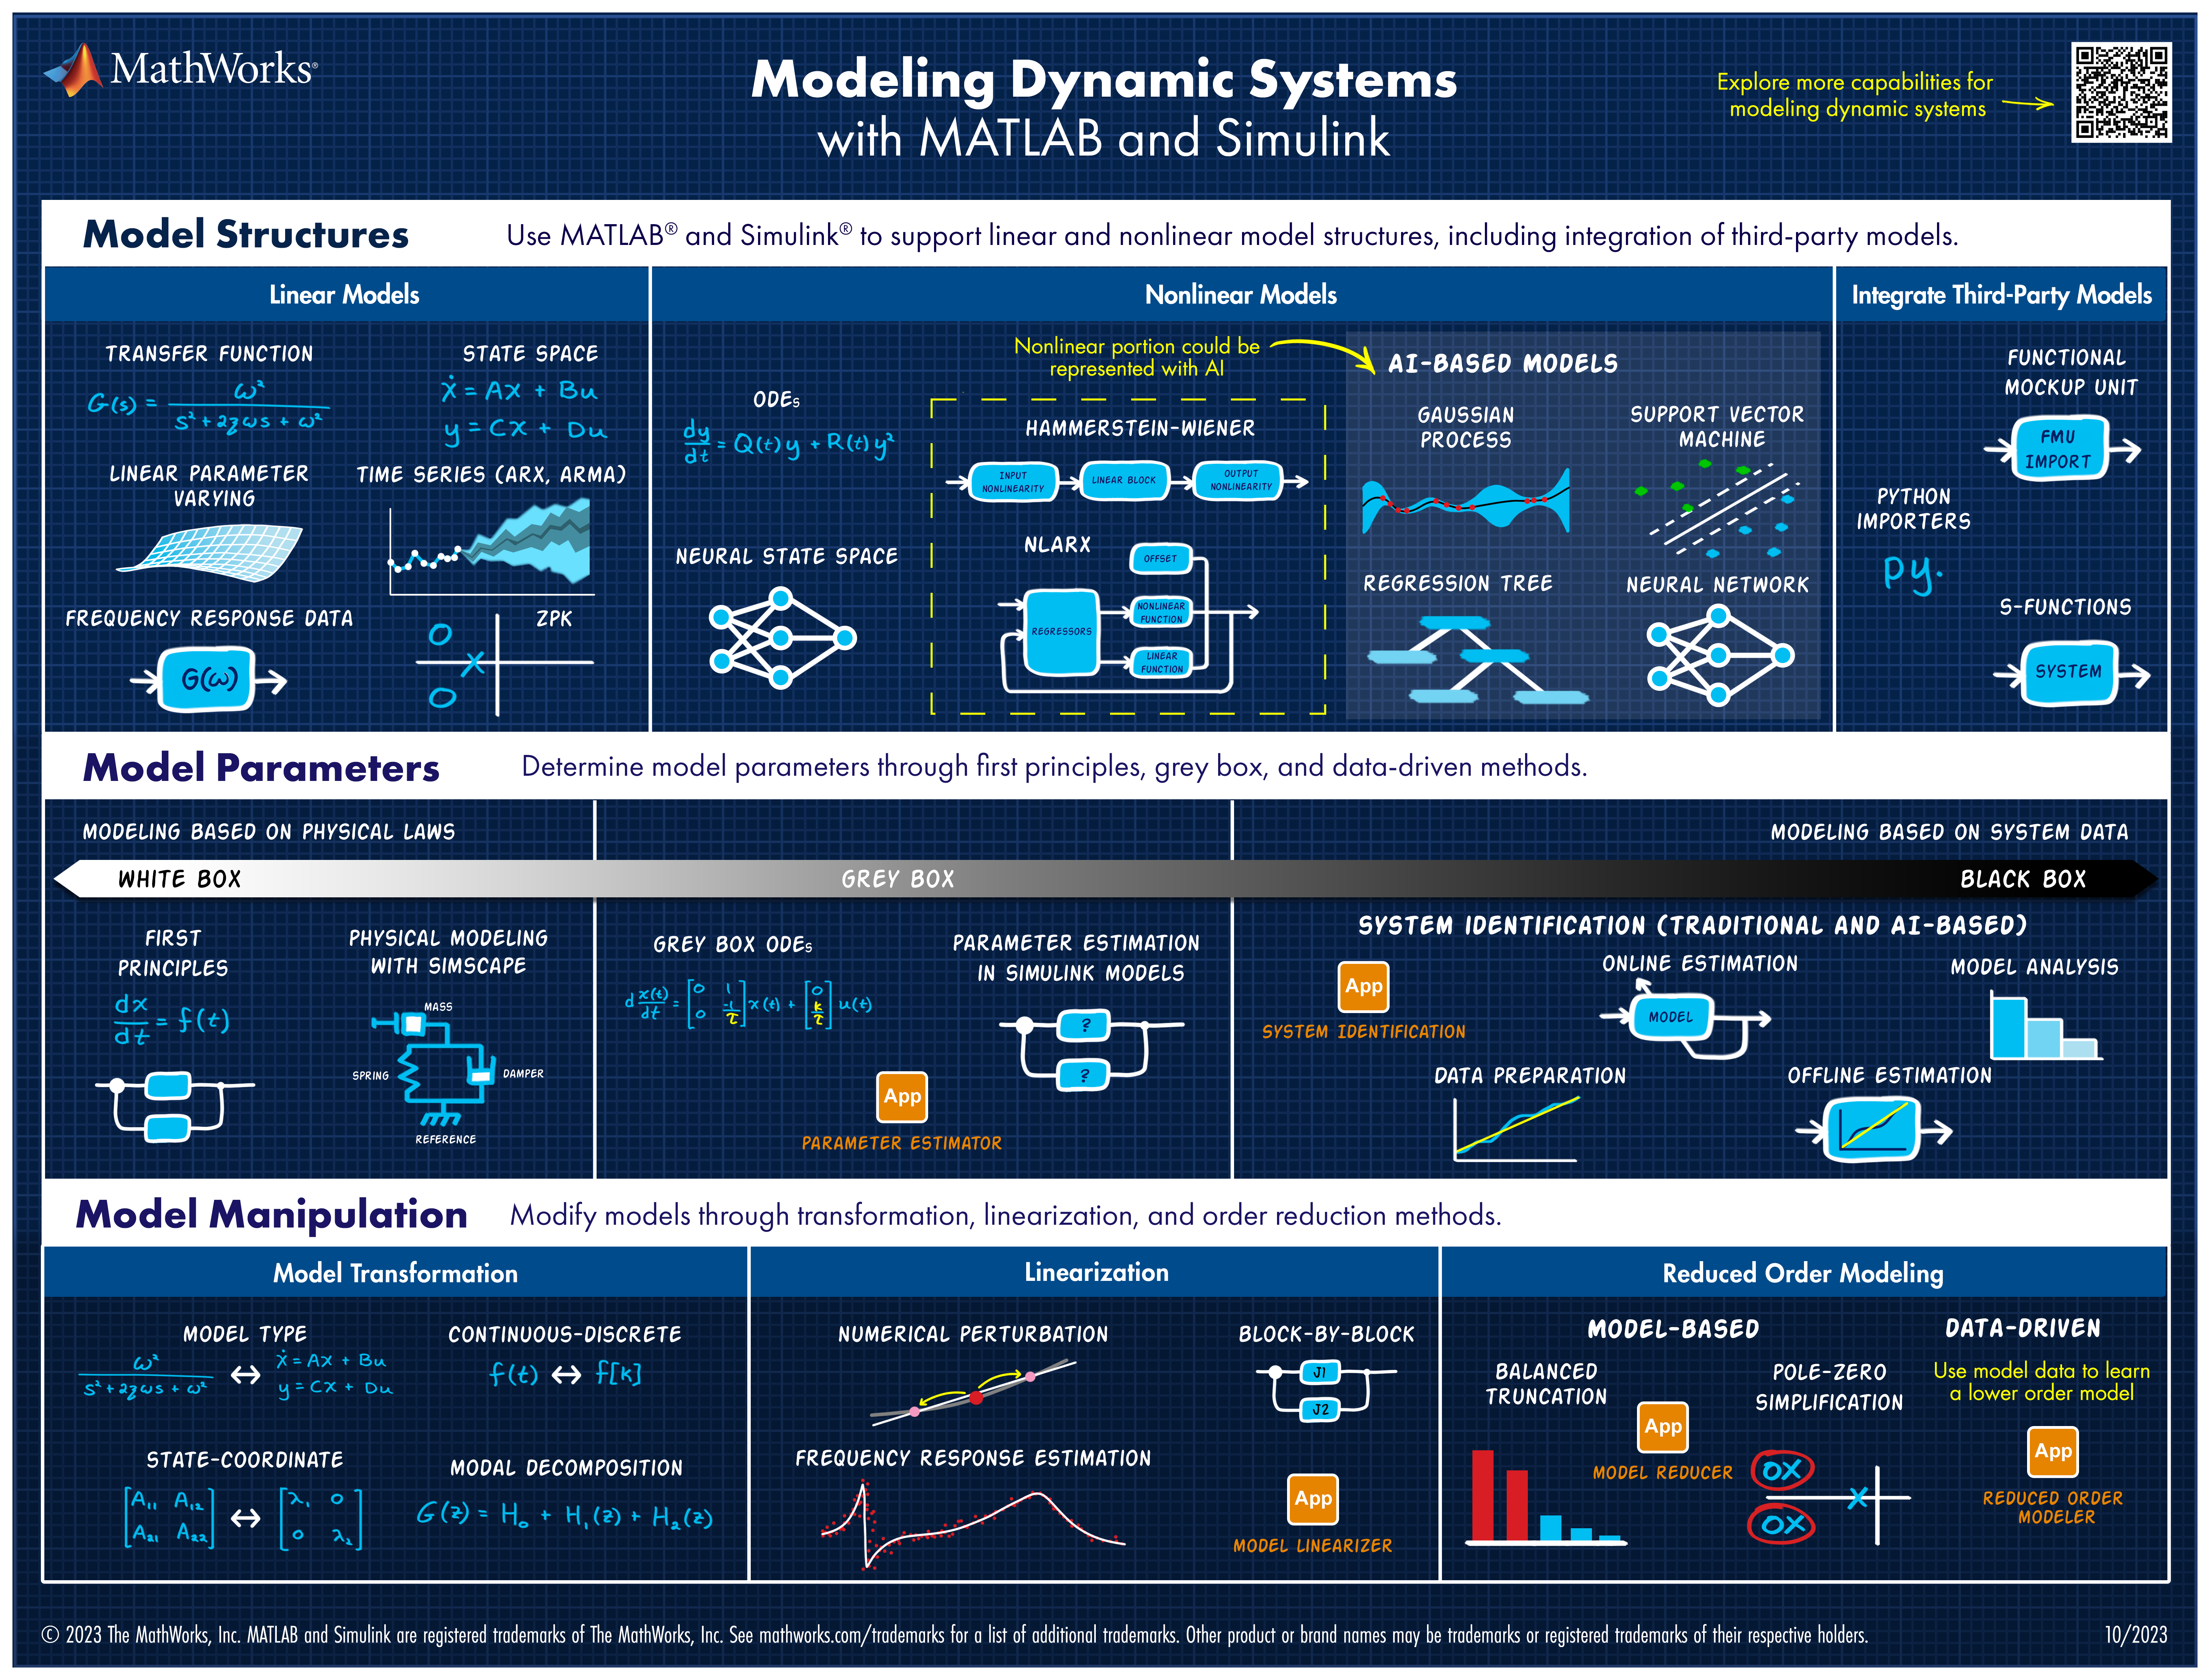
Explore all the capabilities for Modeling Dynamic Systems while keeping them handy with this Cheat Sheet - Download Now.
Hi! I'm new to pk modeling and Matlab. Can someone guide me through how to conduct population pk modeling based on pk parameters from non-human primate studies? Much thanks!!!!
The title is resonably non-descript, but I can explain it easily:
Say I have an initial Emax model:
v = emax1*[G]^n1/(ec501^n1+[G]^n1)
And I want to place v inside of a second Emax model:
y = emax2*v^n2/(ex502^n2+v^n2)
Currently, I have the full function of v inside y, twice, it's very long and whilst I only need to get it correct once, for readability in the future I'd rather have it in form #2. I've played around with non-constant parameters but I need the steady state to be v, not the rate rule, and I haven't worked out how to make a parameter shift to a form like v, as an observation might.
Are there any recommended solutions or do I simply need to keep with having v fully expressed in y?
Thank you,
Dan
Hi All,
I'm currently attempting to implement a Hodgkin-Huxley-type model of membrane potential, ideally I would like a species that represents the membrane potential as its own distinct entity, so as the reference elsewhere. I've currently established a molarity-based work around but it would be great if I could set the units for the species as millivolt, but that throws an error.
Is there an established way to do this? I imagine I'm not the first person to be trying to model a voltage-gated ion channel!
Thank you for your help.
Here's a MATLAB class I wrote that leverages the MATLAB Central Interface for MATLAB toolbox, which in turn uses the publicy available Community API. Using this class, I've created a few Favorites that show me what's going on in MATLAB Central - without having to leave MATLAB 🙂
The class has a few convenient queries:
- Results for the last 7 days
- Results for the last 30 days
- Results for the current month
- Results for today
And supporting a bunch of different content scopes:
- All MATLAB Central
- MATLAB Answers
- Blogs
- Cody
- Contests
- File Exchange
- Exclude Answers content
The results are displayed in the command window (which worked best for me) and link to each post. Here's what that looks like for this command
>> CommunityFeed.thisMonth("app designer", CommunityFeed.Scope.ExcludeAnswers)

Let me know if you find this class useful and feel free to suggest changes.
Hello,
I've looked around and I haven't found anything obvious about this, but is it possible to link to species/reactions, graphically, in a non-mass transfer sense? I have areas in my model where it would conceptually make sense to be able to see that species or reactions are linked, but if I link them in the standard way it demands that it be involved in the stoichiometry.
Perhaps some kind of dotted line, or similar?
Thank you, best regards,
Dan
New Cheat Sheet Alert!
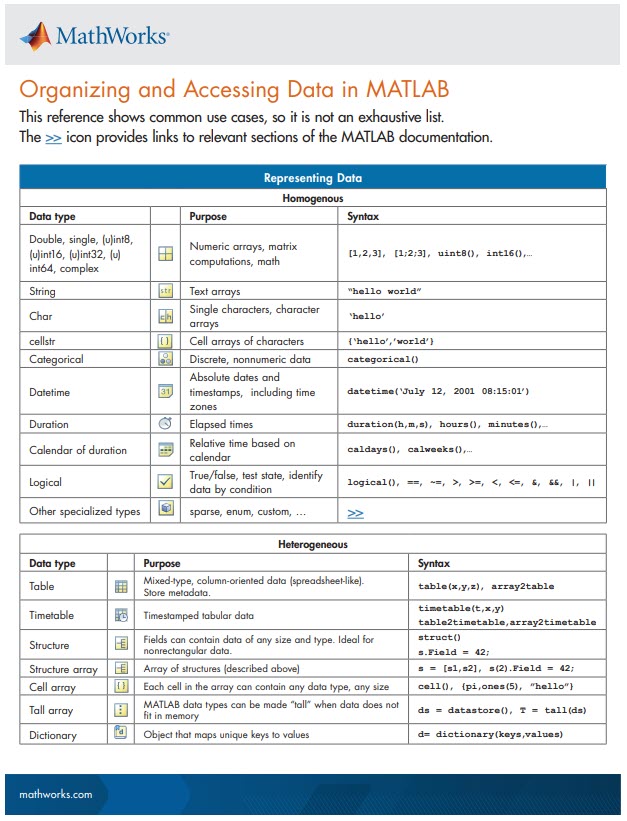
Level up your data organization and access skills in MATLAB with our latest cheat sheet! Download the full cheat sheet on MATLAB GitHub for Students here.
Hello all,
I've been trying to shift my workflow more towards simbiology, it has a lot of very interesting features and it makes sense to try and do everything in one place if it works well..! Part of my hesitancy into this was some bad experiences handling units in the past, though this was almost certainly all out of my own ignorance, relatedly:
Getting onto my question.
In this model I have a species traveling around the body via blow flow, think a basic PBPK model. My species are picomolarities, if everything is already in concentrations, why is it necessary to initially divide by the compartment volume? i.e. 1/Pancreas below.

If my model dealt in molar quantities this would make a lot of sense, the division would represent the transition to concentrations. This, however, now necessitates my parameters be in units of liter/minute, which is actually correct, but I'd like clarification on why it's correct, ha!
Perhaps this is more of a modelling question than a simbiology question, but if there are answers I'd love to hear them. Thanks!
Calling all students! New to MATLAB or need helpful resources? Check out our MATLAB GitHub for Students repository! Find MATLAB examples, videos, cheat sheets, and more!

Visit the repository here: MATLAB GitHub for Students
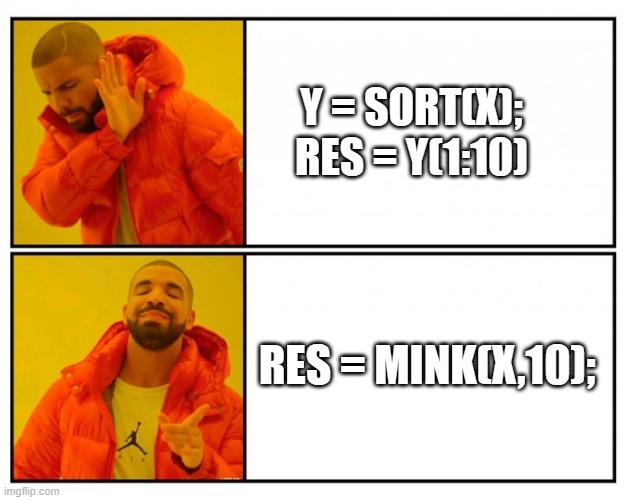
Imagine x is a large vector and you want the smallest 10 elements. How might you do it?
Hi All,
I'm attempting to put a set of simbiology global sensitivity analysis plots into my thesis and I'm running into some issues with the GSA plots. Firstly, the figures are very large, it would be quite beneficial to grab a set of the plots and arrange them myself, is there any documentation on how to mess around with the '1x1 Sobol' produced by sbiosobol? Or just GSA plots in general.
The second problem is that the results appear to be relative to the most sensitive parameter in that run. Is it recommended to have a resonably sensitive 'baseline' parameter in each run? I find it difficult to compare plots when a not so sensitive parameter is being recorded as near '1' for the whole run because it's being stacked against a set of very insensitive parameters. I.e. if i have multiple sets of GSAs due to a large model, how can I easily compare results? If I could do some single run through with every parameter that would be the ideal, I imagine, but then the default plot would be half a mile off the bottom of my screen, haha! Perhaps there is a solution to the first question that might help there?
Thank you for your help,
Dan
Hi all,
I've translated a model from another piece of software (monolix) into simbio programmatically to make use of your very easy global sensitivity analysis system.
It looks a little something like this, for a 'single' line example:
r1 = addreaction(model,'InsI -> InsP');
r1.ReactionRate = 'InsI*kip/vi'; %- is + panc
k1 = addkineticlaw(r1, 'Unknown');
Multiplied about 20 fold, as you can see I have included my volumes within the reaction rates myself (vi). The model functions perfectly and I have corrected the outputs at the end:
[time, x, names] = sbiosimulate(model,csObj,dObj1);
x(:,1) = x(:,1)/vi;
So that they are in concentration, as needed. However, when it comes to sensitivity analysis because I have corrected them post-model it is technically incorrect, it is analysing the absolute quantities. This is quite noticible in the sensitivity to the volumes.
Is there an easy fix to this, I've had to fight dimensionality with units in the past using simbio and I'd be great if there was some way of dividing a compartment output by a volume, for example. It is a functionality that exists in monolix, so I was hopeful it might here!
Thank you for your time.
EDIT:
I think I've worked it out, I had to refactor my model to operate in concentrations, just refitting it now. Now I should just be able to use unitless compartments.
I am trying to simulate model of blood lymphocyte count from a paper using Simbiology. The rate of in or out following circadian rythym is kp(t)=km + kb cos [(t-tpeak)*2pi/24] Where and how do I write the expression ? I dont think I can write in repeated assignment ?
I am currently facing a compatibility issue when attempting to load a SimBiology model created in MATLAB 2021a into MATLAB 2023a. Specifically, the code capture functionality does not seem to be working.
If anyone has encountered a similar situation or has insights on how to capture the code for a SimBiology model created in an older version of MATLAB, I would greatly appreciate your guidance. Are there any alternative methods or specific steps that can be followed to ensure successful code capture?
Thank you in advance for your time and expertise.
I've now seen linear programming questions pop up on Answers recently, with some common failure modes for linprog that people seem not to understand.
One basic failure mode is an infeasible problem. What does this mean, and can it be resolved?
The most common failure mode seems to be a unbounded problem. What does this mean? How can it be avoided/solved/fixed? Is there some direction I can move where the objective obviously grows without bounds towards +/- inf?
Finally, I also see questions where someone wants the tool to produce all possible solutions.
A truly good exposition about linear programming would probably result in a complete course on the subject, and Aswers is limited in how much I can write (plus I'll only have a finite amount of energy to keep writing.) I'll try to answer each sub-question as separate answers, but if someone else would like to offer their own take, feel free to do so as an answer, since it has been many years for me since I learned linear programming.
Dear community,
I would like to develop a fermentation model with 4 ODEs, one of which contains variable y. A "repeated assignment", e. g. y=5x+5, contains variable x that has been measured each second. These data (columns with time and corresponding value x in each row) are recorded in the Excel file.
Does anyone have any suggestion how to implement this in symbiology?
Thank you very much in advance,
Tetiana