Results for
Hi, all friends
If I define a parameter, like solubility with dimension of milligram/milliliter and I want to refer it in an reaction equation in dimension of millimole/liter, suppose I have define its molecularweight, could I input this parameter directly in equation with specified dimension?
Question: How to load a host of variants created through scripts to a sbproj file so that we can simulate and visualize them through the simbiology GUI.
Description : In a typical QSP workflow, we generate virtual patients by perturbing a set of parameters. These virtual patients are generated as variants by using "addvariant".
We end up with an array of variants saved as "variants.mat". This mat contains the list of ~3000 variants.
These variants are now to be simulated with different dose objects. This could be done with scripts but it would be ideal if we import these variants into the sbproj file and simulate via simbiology GUI for both purpose of troubleshooting and dosing.
Is there a way to do this?
Hi, all friends
I am working on building a oral model with "Generic SimBiology PBPK model" and meet some problems about intestinal transit rate. Take duodenum as example, the transit rate is defined as " (kTransportSmallIntestine*organismLengthDuodenum/organismLengthSmallInstestine)*Duodenum.DrugDissolved". I think assuming duodenum transit time is equal to SmallIntestineTransittime*organismLengthDuodenum/organismLengthSmallInstestine, the transit rate constant is the inverse of that,which result in kTransportSmallIntestine*organismLengthSmallInstestine/organismLengthDuodenum, contradicting with the equation in model. Am I wrong?
Besides that, the kTransportSmallIntestine_is defined as _0.693/organismMeanResidenceSmallIntestine in model. Isn't the mean residence time determining the time at which about 63.2% of initial amount having passed through the compartment and inverse of mean residence time determining the transit rate? Why does organismMeanResidenceSmallIntestine correlate with 0.693 which is often seen in half-life associated expression?
Thanks for any comment.
Hi, fellows,
I am a new user of MATLAB and SimBiology. When I open the "Generic SimBiology Physiologically-based Pharmacokinetic (PBPK) model" downloaded from "https://ww2.mathworks.cn/matlabcentral/fileexchange/37752-generic-simbiology-physiologically-based-pharmacokinetic-pbpk-model", I get a note of "Copyright 2012-2018 The MathWorks, Inc. ...". Does that mean I can not access to the model built-in or make any modification?
Thanks for any comment!
New Features
R2019b introduces the new SimBiology Model Analyzer which replaces Task Editor enabling you to do a lot more within the app.
For a detailed look into enhancements with Model Analyzer, we created a few short videos. Below is a list of the new features together with videos describing each feature.
- Programs: Compose SimBiology analysis programs from built-in analysis steps. Video: Simulating a model using SimBiology Model Analyzer
- Scenarios: Generate Samples to perform Monte Carlo simulations using various modeling and dosing conditions. Video: Generating Simulation Scenarios by Sampling Model Quantities Video: Sampling Parameters from Covariate Models
- Plotting and Datasheets: Plot multi-dimensional data slicing by categories such as response or scenarios. Visualize and manipulate raw external and analysis data using datasheets. Video: Stratifying Data for Visualization in SimBiology
Compatibility considerations with earlier versions of SimBiology
There are a few things that one needs to be aware of if planning to use R2019b with a SimBiology project created in older versions. If you load a project created pre-R2019b, the existing tasks are converted to equivalent programs. However, keep in mind the following for the current version of SimBiology Model Analyzer:
- Live Plots functionality of the Task Editor is not supported. If Live Plots in the Task Editor is turned on and shows a time plot of simulation results, then an equivalent time plot is added on import to the SimBiology Model Analyzer app with the main difference being that the time plot is updated and displayed after the program finishes (not while it is running).
- Previously available Calculate Conserved Cycles, Search Model(s), and Generate Report tasks are not supported.
- Any Group Simulation task is converted to a Scan program.
- Fit Data program does not support nlinfit as the estimation method. However, the command-line function sbiofit still supports nlinfit.
- To help with the transition to R2019b, when you open an existing project created in R2019a or earlier, the app creates a backup of the original file. The backup file has the release information suffixed to its name, filename_release.sbproj. For example, if you open an R2019a project named foo.sbproj in the app, the app creates a backup file called foo_R2019a.sbproj.
- Also, when you open and save a project, the app creates a backup file of the version prior to the saved version of the project. The backup file has the .bak extension (for example, foo.sbproj.bak).
See the complete list of general behavior change, compatibility considerations, and new features in the release notes.
I am fitting a generic TMDD model to date. Model fits look reasonable. Once I create a variant and simulate data for various doses to create observed vs predicted concentrations vs time profile, then simulated concentrations do not match fitted profiles. Simulated concentrations are either significantly higher or lower than the model fits. Not sure what is wrong. Fits look fine but simulated profiles using fitted parameters are all over the place.
Hello all,
I have created an arbitrary model for microtubule behavior. More or less just trying to familiarize with the software. I have created plots for multiple types of reactions that may occur and am looking to now plot the instantaneous derivative of each reaction. Would anyone have any suggestions as to how I could do this? I am familiar with how to do it with a clearly defined function with x,y,z,etc. values. However the 'sbiomodel' command doesn't seem to show me a function so I'm really lost on this.
Thanks for any and all help/suggestions.
Hello,
I have a suggestion for a feature which I think would be nice to add in SimBiology: a "date modified" field for all of the objects (species, parameters, rules, etc). It would be nice for this to be visible in the tables in the GUI, as well as being available through code, and to be able to sort on this field in the GUI. The reason I thought about this is because I just got a model with some updates from a colleague, and this would help me to identify what they updated.
Thank you,
Abed
In previous versions, there was an option for exporting fit results as a report. Now it is not there.
There will be an introductory hand-on SimBiology workshop following ACoP on Friday, Oct 24 at University of Florida, Orlando Campus, sponsored by Prof. Sihem Bihorel.
To register, please send me a direct message from the community site or e-mail me at fbuyukoz[at]mathworks.com. Please also let your colleagues know who might be interested in attending. Space is limited and will be allocated to those who sign up first.
Agenda
Introduction
- Overview of MATLAB and SimBiology
- Navigating the SimBiology desktop environment
- Working with a SimBiology project
Building and Simulating Mechanistic Models, using a TMDD example
- Overview of the building blocks and modeling architecture
- Building models using the SimBiology block diagram editor
- Configuring simulation-related settings (solvers, tolerances, sampling time, etc.)
- Exploring model dynamics and sensitivity using parameter sliders and sensitivity analysis
- Simulating hypothetical scenarios and dosing schedules
Implementing Traditional Compartmental PK/PD Workflows, using a 1 compartment PK model as example
- Importing, processing and visualizing data
- Performing non-compartmental analysis (NCA)
- Estimating parameters using nonlinear regression and population-based methods
Programmatic SimBiology and Integration with MATLAB
- Writing custom analysis tasks
- Automating workflows using MATLAB scripts
Over the past several months our communities have been the target of ongoing spam attacks. Spam is a common issue online and spam prevention is something we include as part of our standard development processes. The most recent attempts appear to be specifically targeting our sites with a combination of manual and automated attacks, probing with a variety of content attempting to bypass our filters. Regrettably, the attacks sometimes make it through our defenses, cluttering your inboxes and the content in our communities.
Rest assured, we are dedicated to continuing to evolve our tools and improve our capabilities to meet the goal of eliminating all spam in our communities. We appreciate your patience and understanding as we work to get there.
Sincerely,
David Wey
MATLAB Communities Development Manager
MathWorks, Inc.
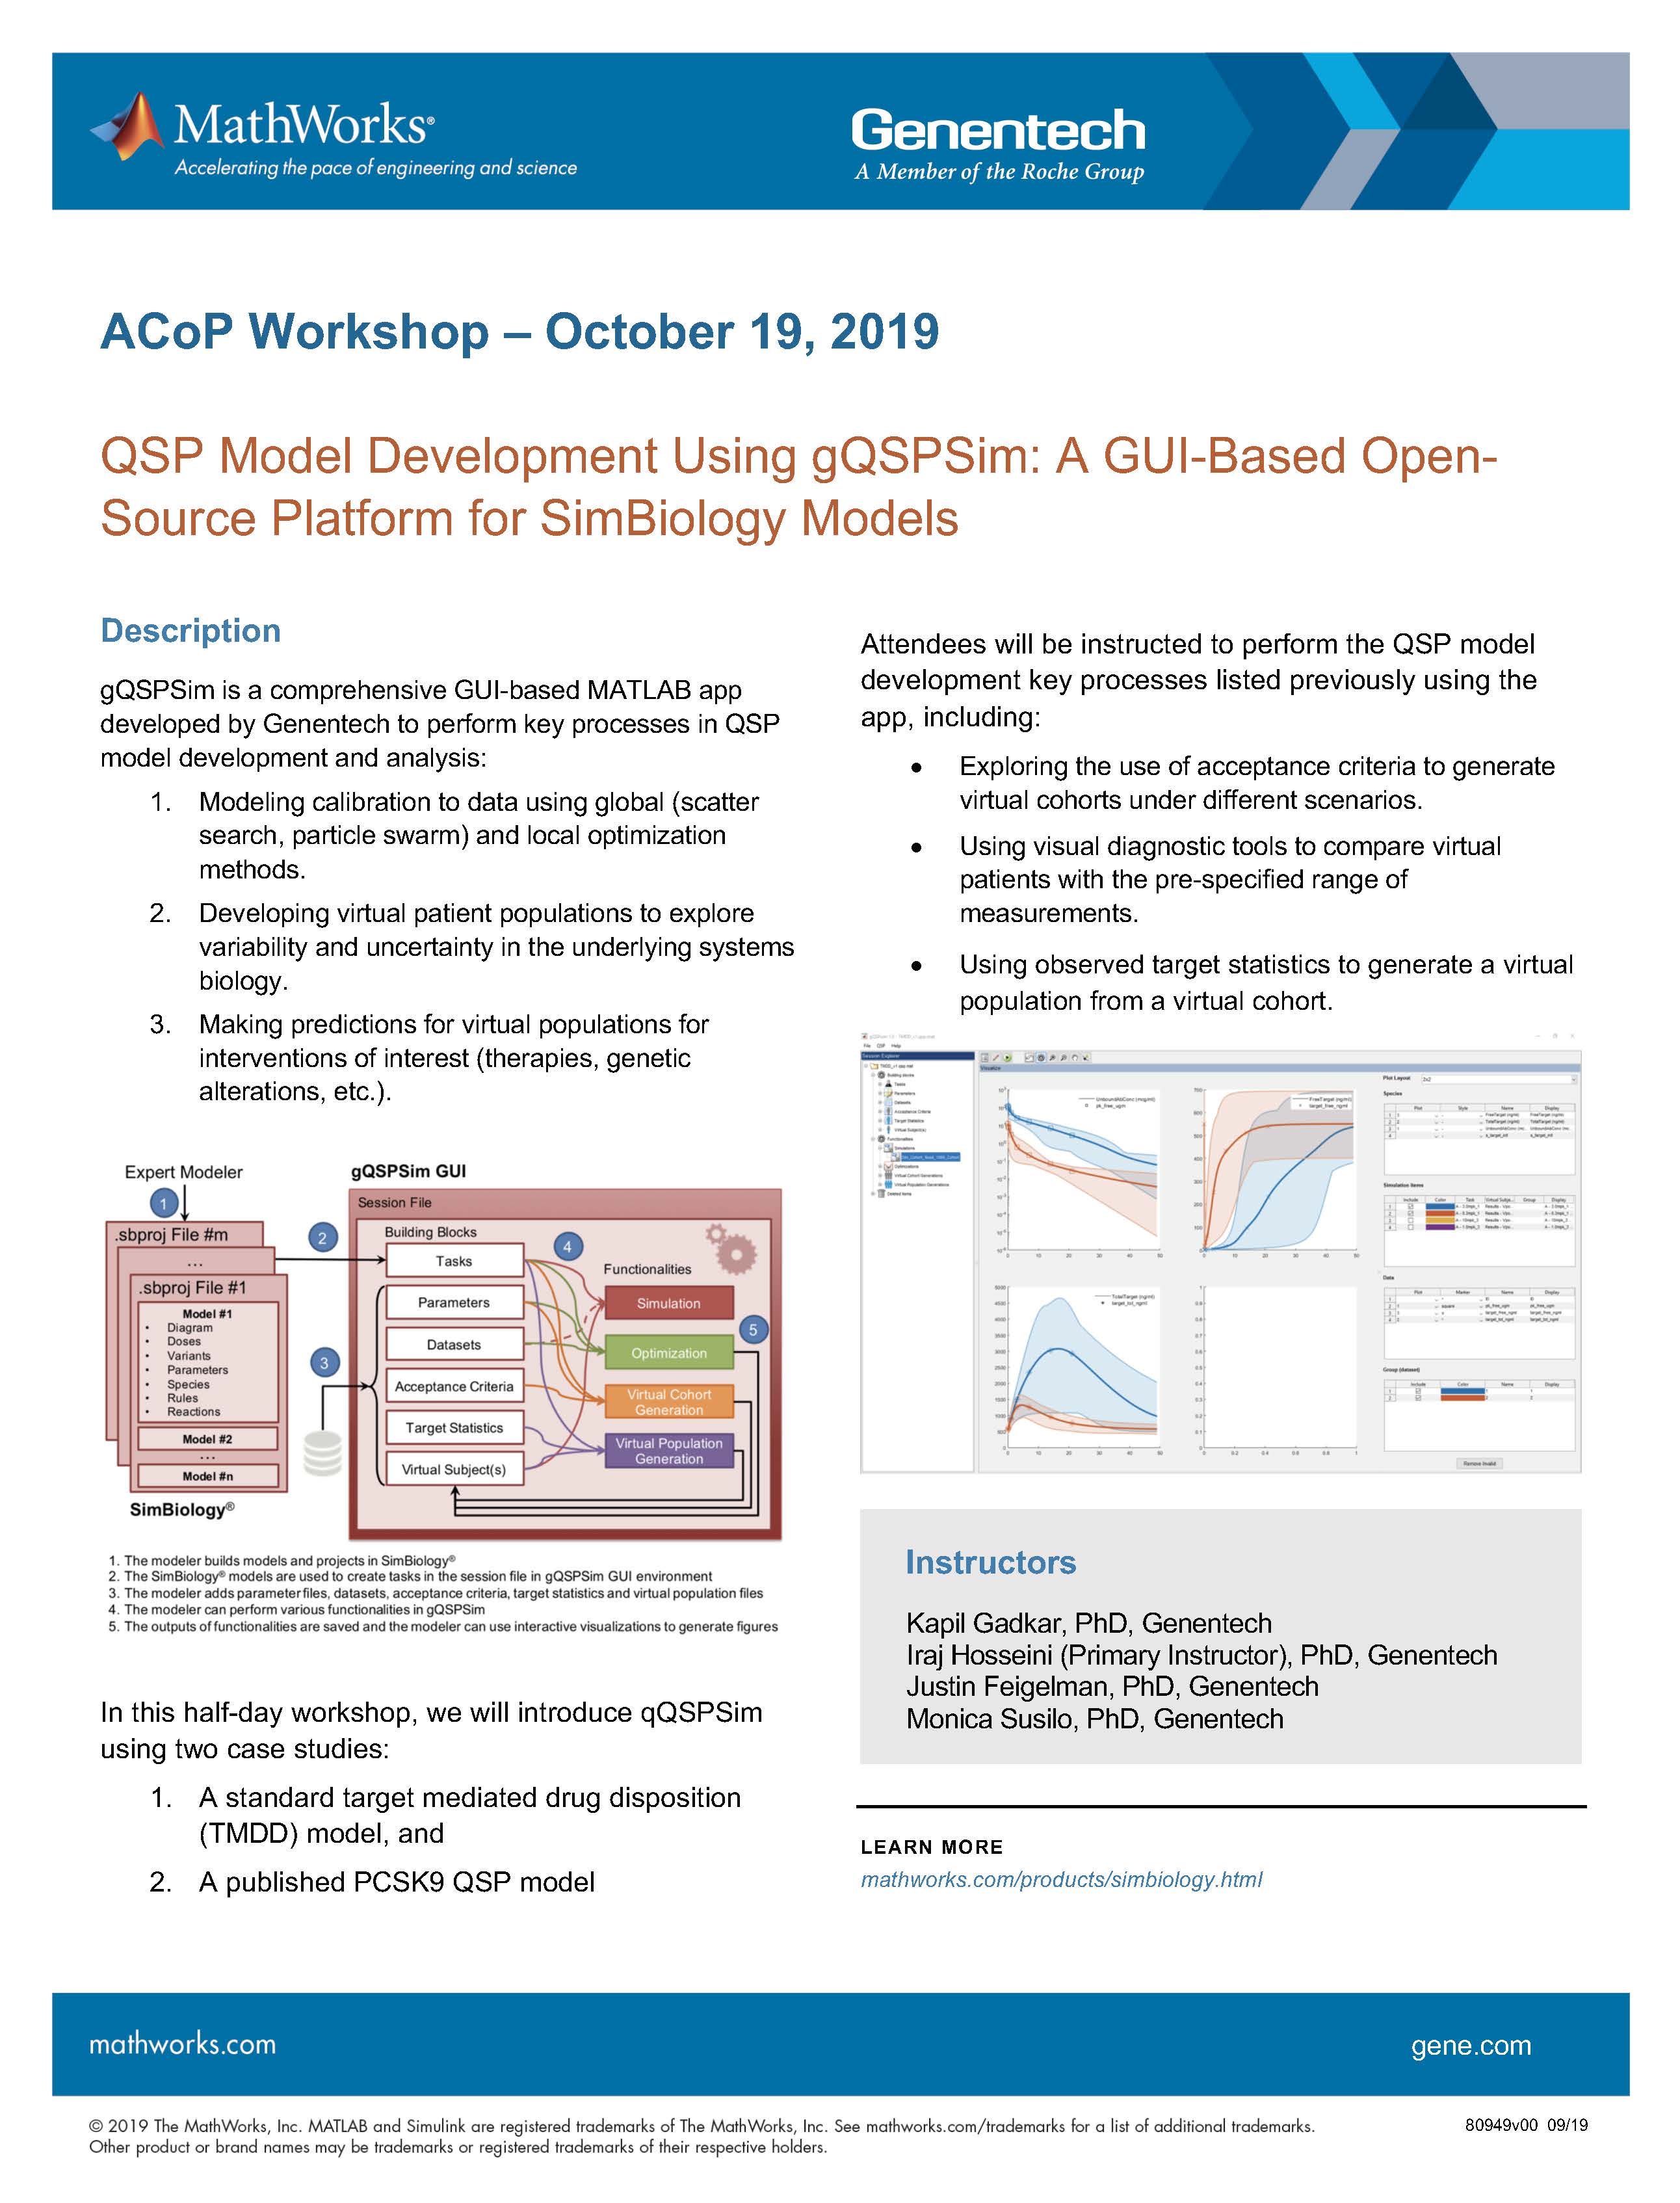
ACoP10 Workshop – October 19, 2019
QSP Model Development Using gQSPSim: A GUI-Based Open-Source Platform for SimBiology Models
Organized by Genentech and MathWorks
IS there a quick and easy way to calculate AUC in SimBiology without exporting results to an NCA analysis>?
can we directly get the SD of the concentration-time AUC after fitting in Simbiology?
Hi, How do I get a numeric integral from a function that uses Excel file input data? I have been able to import the excel file but am having trouble continuing the code,please guide me, thank you
We have a Systems Biology and Biotechnology Specialization on Coursera which has the following specific courses:
1. Introduction to Systems Biology
2. Experimental Methods in Systems Biology
3. Network Analysis in Systems Biology
4. Dynamical Modeling Methods for Systems
5. Integrated Analysis in Systems Biology
6. Systems Biology and Biotechnology Capstone
For "Systems Biology and Biotechnology Capstone", "Dynamical Modeling Methods for Systems", and ":Integrated Analysis in Systems Biology", MATLAB is used for mathematical models and bioinformatics analyses. All assignments with dynamical models are also presented as MATLAB codes and SimBiology Models. The Systems Biology Specialization covers the concepts and methodologies used in systems-level analysis of biomedical systems. Successful participants will learn how to use experimental, computational and mathematical methods in systems biology and how to design practical systems-level frameworks to address questions in a variety of biomedical fields. In the final Capstone Project, students will apply the methods they learned in five courses of specialization to work on a research project.
Here is the link to all of these courses:
https://www.coursera.org/specializations/systems-biology
If you have any question about these courses please let me know.
Iman Tavassoly MD, PhD Icahn School of Medicine at Mount Sinai