Results for
In the past two years, large language models have brought us significant changes, leading to the emergence of programming tools such as GitHub Copilot, Tabnine, Kite, CodeGPT, Replit, Cursor, and many others. Most of these tools support code writing by providing auto-completion, prompts, and suggestions, and they can be easily integrated with various IDEs.
As far as I know, aside from the MATLAB-VSCode/MatGPT plugin, MATLAB lacks such AI assistant plugins for its native MATLAB-Desktop, although it can leverage other third-party plugins for intelligent programming assistance. There is hope for a native tool of this kind to be built-in.
I am considering to upgrade to HOME license. Does the HOME license provides more widgets (including a text message widget), in addition to the 4 basic widgets in the FREE version?
Hi,
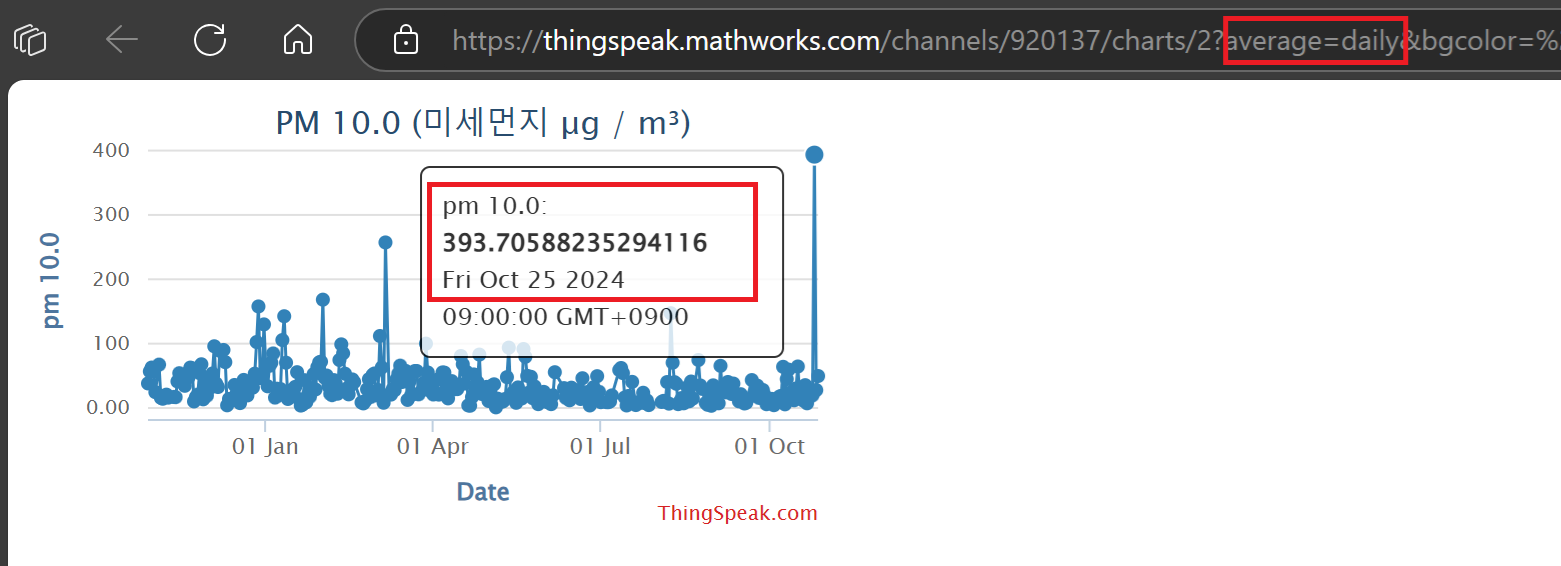
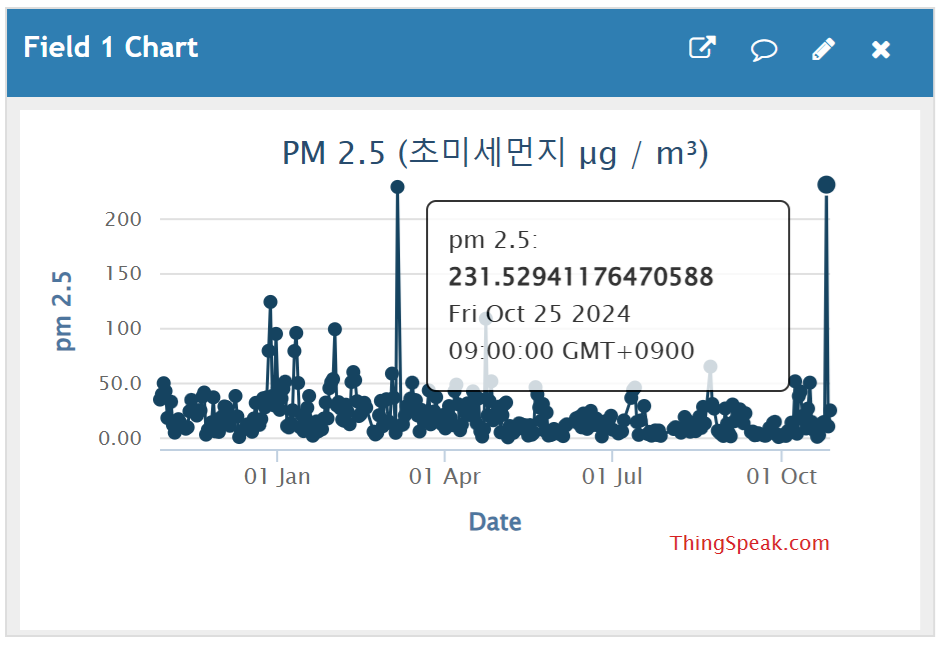
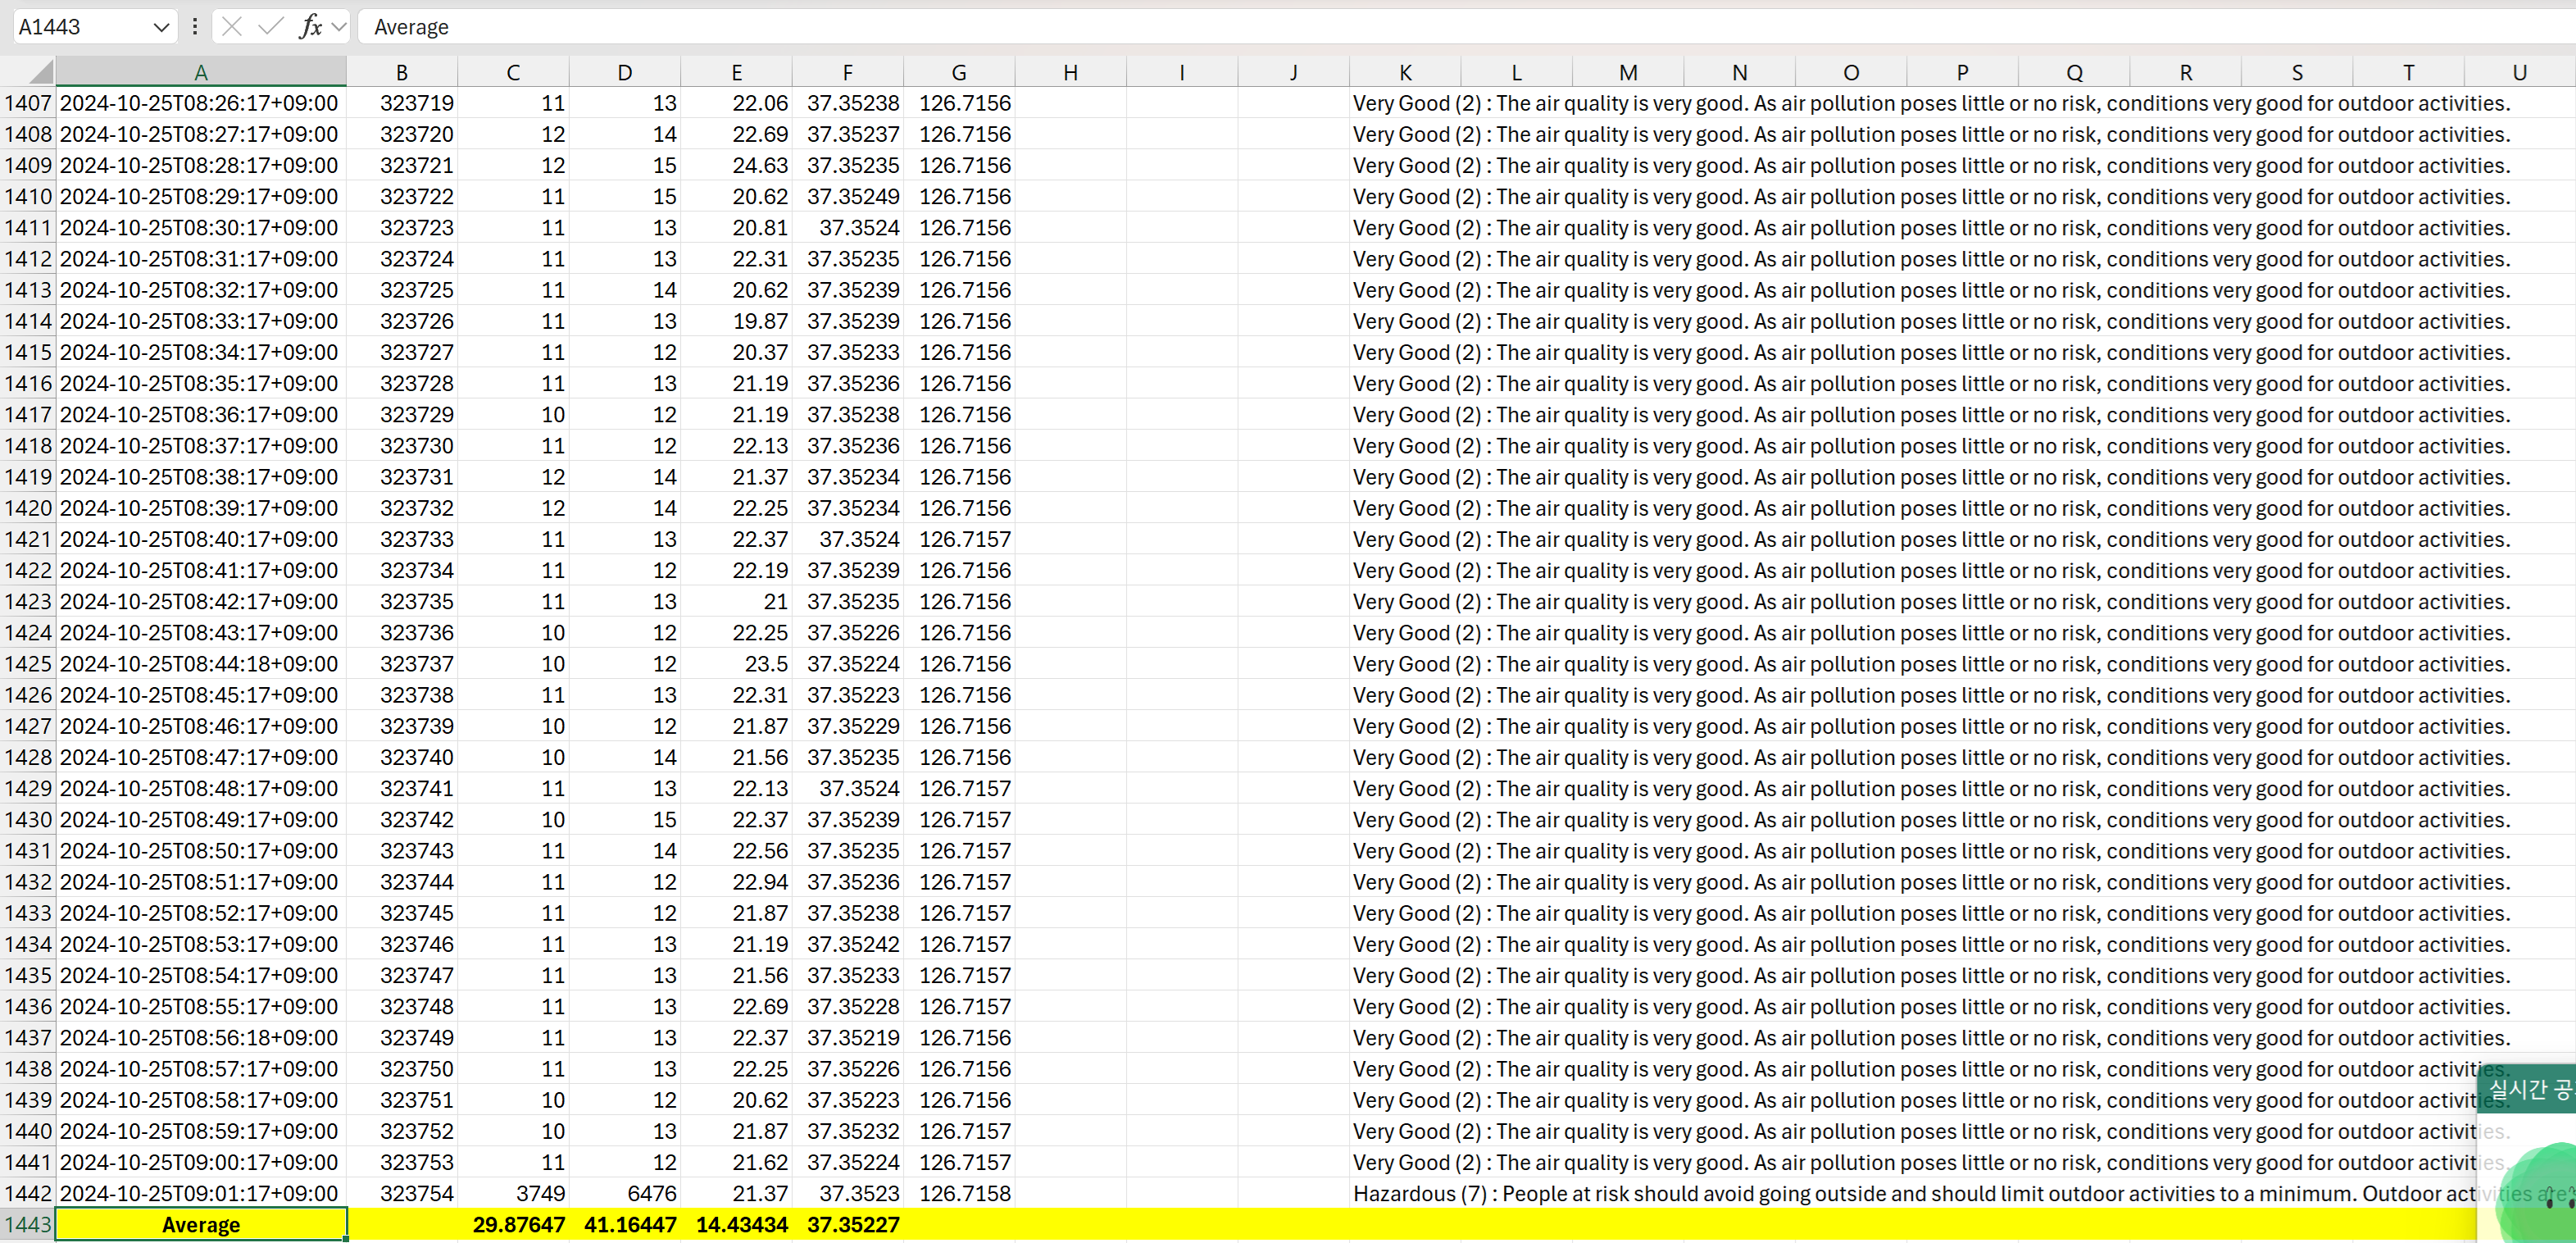
I don't know why really. Why is there seems a difference between daily average that calculated with .csv file that has exported directly from the channel.
and calculation with the ThingSpeak Daily Average API, there is a lot of difference at the moment.
Why does this happens, and how should I fix this issue?
Attached image file is daily average that has been retrived through the API,
And attached excel file is raw data from the channel.
Thank you.
My Licensed avvount has expired. When I go to my expired license page, I select "Revert To Free Account", I get the following message:
Only administrators of this license are allowed to renew units on this ThingSpeak license. If you want to continue to collect data in your ThingSpeak channels, contact your license administrator.
Aren't I the license administrator? or do I need to contact someone at Thingspeak/MathWorks?
If I go to a paint store, I can get foldout color charts/swatches for every brand of paint. I can make a selection and it will tell me the exact proportions of each of base color to add to a can of white paint. There doesn't seem to be any equivalent in MATLAB. The common word "swatch" doesn't even exist in the documentation. (?) One thinks pcolor() would be the way to go about this, but pcolor documentation is the most abstruse in all of the documentation. Thanks 1e+06 !
Hi, My data send to thingspeak is not received/updated for the last 6 hours on the charts and dials. All worked well till about 6 hour ago. I am using Node-red and the API Url: https://thingspeak.com
Any help please?
Greetings Gert
To solve issues around the browsers blocking 3p cookies and having different behavior across different browsers, the ThingSpeak website is now served from https://thingspeak.mathworks.com. There are no changes required from devices or users. Just log in and use the service as you always did.
I left the code unchanged, modifying only secrets.h.
I am using an ESP32-WROOM -32U
Connection to network succeeds, but ThingSpeak.writeFields fails every time, with HTTP error code 400.
The sketch I am really trying to use is loosely based on this example, accesses Time and Weather info with no problems, but ThingSpeak.writeFields fails with HTTP error code 301.
This is my first attempt to use ThingSpeak.
Is this example sketch still valid, or must I look elsewhere? Suggestions please.
As pointed out in Doxygen comments in code generated with Simulink Embedded Coder - MATLAB Answers - MATLAB Central (mathworks.com), it would be nice that Embedded Coder has an option to generate Doxygen-style comments for signals of buses, i.e.:
/** @brief <Signal desciption here> **/
This would allow static analysis tools to parse the comments. Please add that feature!
Hi everyone,
I'm working on a school project where I need to send sensor data from my Arduino to a Power BI REST API using ThingsHTTP. I've been trying to get this to work, but I'm running into errors like this:
{"error":{"code":"InvalidRequest","message":"Error parsing request for dataset sobe_wowvirtualserver|a7b68fb5-533b-471f-a5da-3bdd6746ee16: Conversion error on column '<pi>pH</pi>': <pi>Input string was not in a correct format.</pi>"}}
I'm a beginner with this, and I'm not sure what I'm doing wrong. What steps should I take to resolve this issue? Also, does anyone know the correct format for an HTTP request body when sending dynamic sensor data?
This is the body format I'm trying to send to Power BI:
[
{
"pH": 98.6,
"TDS": 98.6,
"turbidity": 98.6,
"temperature": 98.6
}
]
Any advice on how to construct the HTTP body with values that change over time would be greatly appreciated! Thanks in advance!"
hope this message finds you well. I am currently working on a project involving the design and numerical simulation of metalenses using Zemax and MATLAB. The design phase involves saving phase data from the Zemax simulation, which is later used in a numerical script to generate the metalens in MATLAB.
I have a MATLAB file that contains the phase data saved from Zemax, but I am unsure of the specific method or format used to extract and save the data from Zemax. The phase data I currently have in MATLAB is as follows:
- Phase matrix: 571 x 571 (double)
- X data: 571 x 1 (double)
- Y data: 571 x 1 (double)
Could you please provide guidance on:
- How this phase data was likely saved from Zemax into MATLAB?
- What steps or scripts were used to extract this information from the design, particularly the 571 x 571 phase matrix and the corresponding X and Y data?
- Any best practices or tools available in Zemax for exporting such data?
This information will help me reproduce the workflow and proceed with my analysis.
Thank you for your support. I look forward to your guidance.
Best regards,
Zaka
I went to perform an IoT for an automated plantation but the same error always occurs to me when I upload it to the mcu node, which is: Connection to ThingSpeak failed.
As far as I know, starting from MATLAB R2024b, the documentation is defaulted to be accessed online. However, the problem is that every time I open the official online documentation through my browser, it defaults or forcibly redirects to the documentation hosted site for my current geographic location, often with multiple pop-up reminders, which is very annoying!
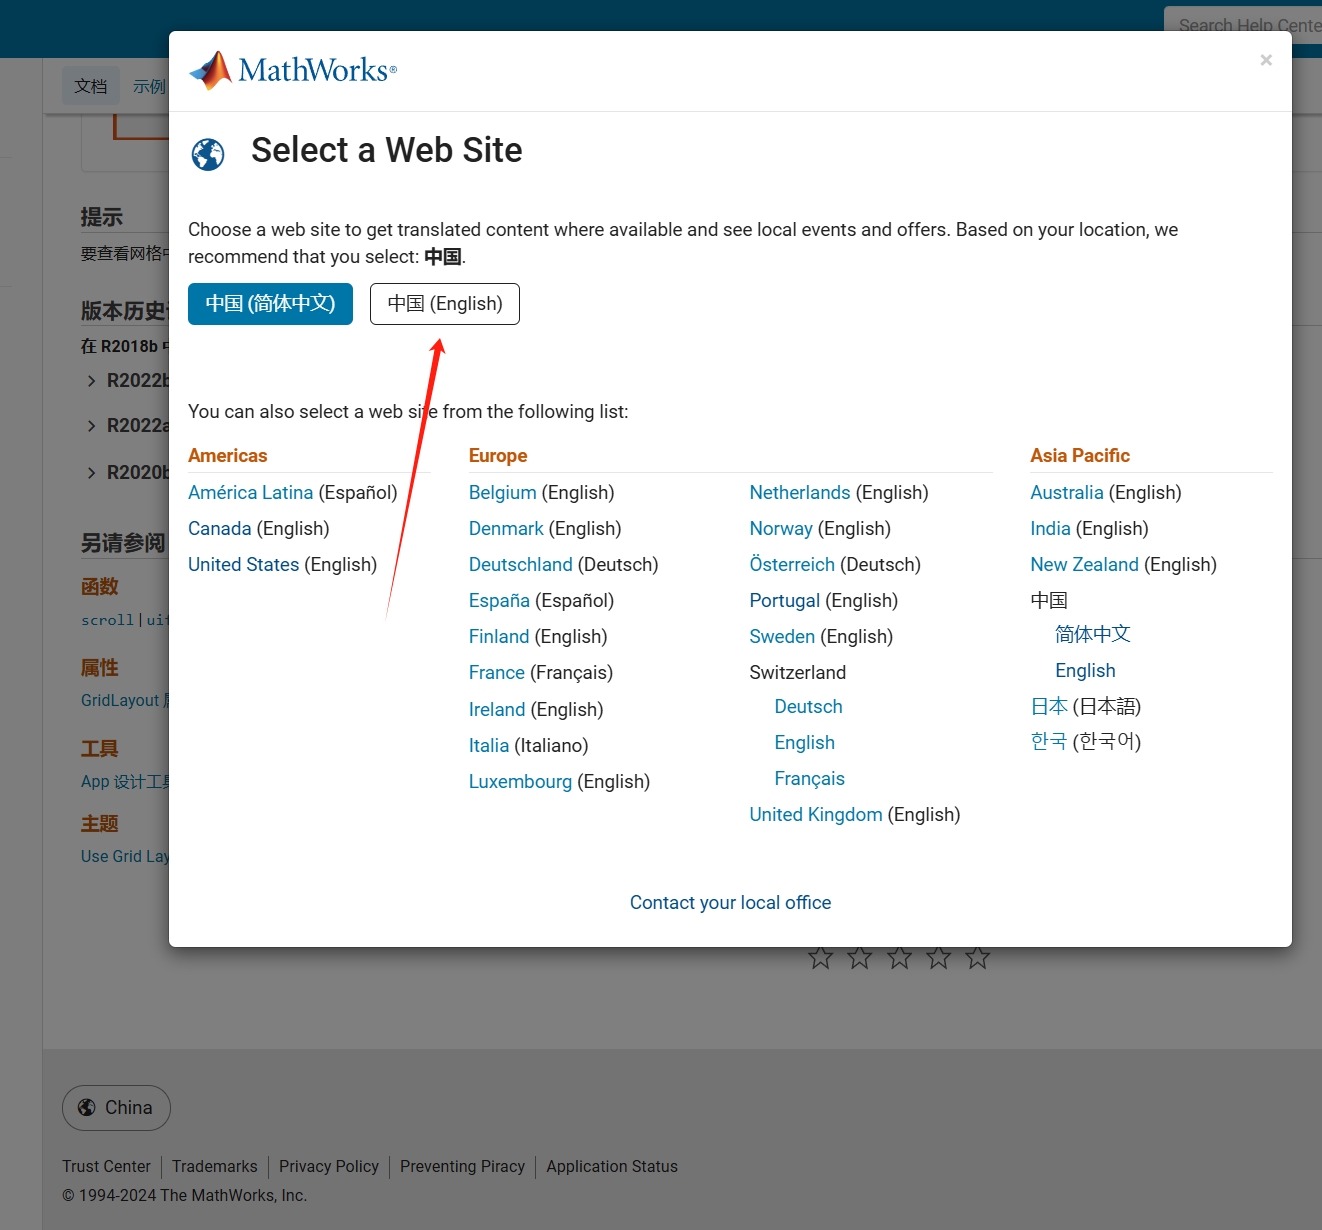
Suggestion: Could there be an option to set preferences linked to my personal account so that the documentation defaults to my chosen language preference without having to deal with “forced reminders” or “forced redirection” based on my geographic location? I prefer reading the English documentation, but the website automatically redirects me to the Chinese documentation due to my geolocation, which is quite frustrating!
----------------2024.12.13 update-----------------
Although the above issue was resolved by technical support, subsequent redirects are still causing severe delays...
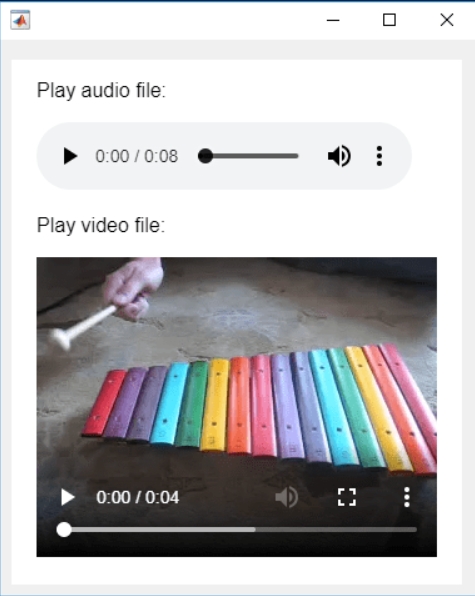
In the past two years, MATHWORKS has updated the image viewer and audio viewer, giving them a more modern interface with features like play, pause, fast forward, and some interactive tools that are more commonly found in typical third-party players. However, the video player has not seen any updates. For instance, the Video Viewer or vision.VideoPlayer could benefit from a more modern player interface. Perhaps I haven't found a suitable built-in player yet. It would be great if there were support for custom image processing and audio processing algorithms that could be played in a more modern interface in real time.
Additionally, I found it quite challenging to develop a modern video player from scratch in App Designer.(If there's a video component for that that would be great)
-----------------------------------------------------------------------------------------------------------------
BTW,the following picture shows the built-in function uihtml function showing a more modern playback interface with controls for play, pause and so on. But can not add real-time image processing algorithms within it.
It's been over six years since I've written any serious MATLAB code, so I thought it would be fun to see how easily ChatGPT could help me out. While others have probably already used ChatGPT to generate MATLAB code, I didn't find any evidence of it when I searched through the ThingSpeak forum. That inspired me to post an example to get people thinking about it.
This example reads four temperature fields from the same channel and plots them on a single graph.
My ChatGPT prompt:
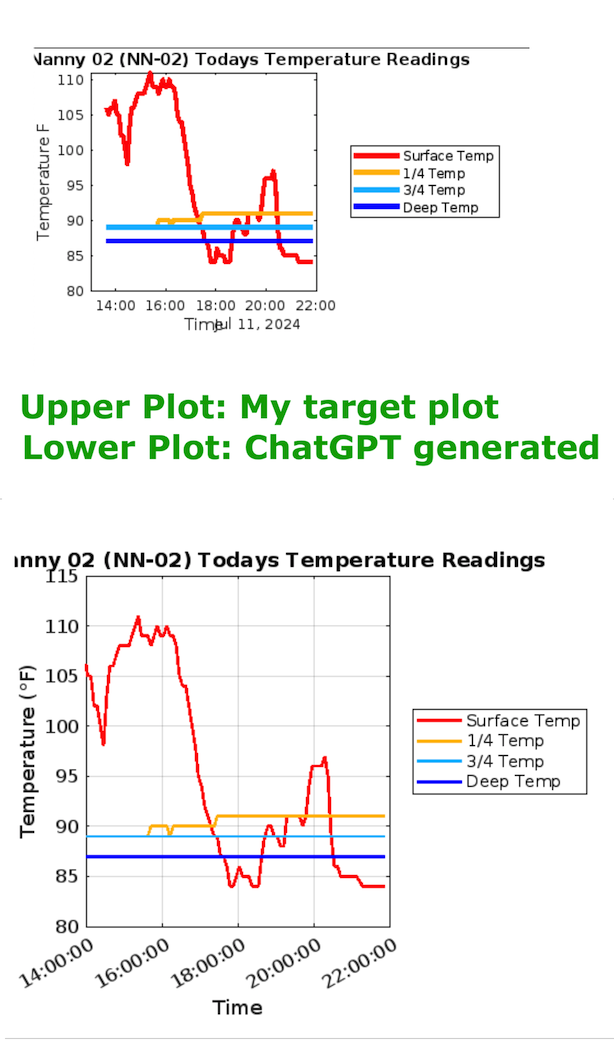
The prompt is pretty straightforward and essentially walks through all the elements of the chart that I wanted. It's also important to consider any filtering or "data cleansing" that should be done. Since this was my first time doing this, I decided to use an existing plot I was already familiar with as my "target state".
The prompt: "I would like you to generate some MATLAB code to create what is called a MATLAB Visualization. Its purpose will be to generate a chart of 4 fields found in a ThingSpeak channel. The ThingSpeak channel name is "Nest Nanny 2 (NN-02)" and its channel id (needed for the code) is xxxxxxx. The read api key is XXXXXXXXXXXXXXXX. The chart title should be "Nest Nanny 02 (NN-02) Todays Temperature Readings" It should plot data from 4 fields (field 3 - 6) who's names are "Surface Temp", "1/4 Temp", "3/4 Temp", and "Deep Temp". I would like the plot lines for these 4 fields to be different colors (red, orange, cyan, and blue) but on the same chart. I would like Temperature in Fahrenheit to be on the Y axis and Time on the x axis. I would like it to display the last 100 data points. I'd like to use this colororder. colororder(["#FF0000","#FFBB00","#00BBFF", "#0000FF"]) I would like the legend to be to the right of the chart, not contained within the chart. No temperature data should have a value of 50 or less and we can assume it's a sensor issue when this is observed. If a data value is 50 or less, use the value of it's nearest (in the time series) non-zero, non-negative value for that field. The data is stored in the channel as Fahrenheit and does not need to be converted from Celsius. "
Because I did this exercise using an existing plot and had a clear objective in mind, it was relatively quick to iterate four or five times with ChatGPT to refine my prompt. In just a few minutes, the generated plot almost perfectly matched my existing plot. (I xxxx'ed out the channel ID and API key before posting.) For someone who now only occasionally uses MATLAB, this approach saves time and will hopefully allow me to tap into elements of MATLAB that are now beyond my skill level and memory. ;)
ChatGPT generated MATLAB code:
% MATLAB code to create a ThingSpeak Visualization for temperature readings
% Define channel ID and Read API Key
channelID = xxxxxxx;
readAPIKey = 'XXXXXXXXXXXXXXXX';
% Number of data points to retrieve
numPoints = 100;
% Read data from the ThingSpeak channel for fields 3 to 6
[data, time] = thingSpeakRead(channelID, ...
'Fields', [3 4 5 6], ...
'NumPoints', numPoints, ...
'ReadKey', readAPIKey);
% Replace any value 50 or less with the nearest non-zero, non-negative value
for i = 1:size(data, 2)
% Identify indices where the data is 50 or less
badIndices = find(data(:,i) <= 50);
% Identify indices where the data is valid (greater than 50)
validIndices = find(data(:,i) > 50);
% Interpolate to replace bad values
if ~isempty(validIndices)
data(badIndices, i) = interp1(validIndices, data(validIndices, i), badIndices, 'linear', 'extrap');
end
end
% Plot the data
figure;
colororder(["#FF0000","#FFBB00","#00BBFF", "#0000FF"]); % Set the color order
plot(time, data(:,1), 'LineWidth', 2); hold on;
plot(time, data(:,2), 'LineWidth', 2);
plot(time, data(:,3), 'LineWidth', 2);
plot(time, data(:,4), 'LineWidth', 2);
hold off;
% Add labels and title
xlabel('Time');
ylabel('Temperature (°F)');
title('Nest Nanny 02 (NN-02) Todays Temperature Readings');
% Add legend and move it to the right of the chart
legend({'Surface Temp', '1/4 Temp', '3/4 Temp', 'Deep Temp'}, ...
'Location', 'eastoutside');
% Format the time on the x-axis
datetick('x', 'HH:MM:SS', 'keepticks');
grid on;
% Adjust the figure for better readability
set(gca, 'FontSize', 12);
Plot Comparison:
isequaln exists to return true when NaN==NaN.
unique treats NaN==NaN as false (as it should) requiring NaN to be replaced if NaN is not considered unique in a particular application. In my application, I am checking uniqueness of table rows using [table_unique,index_unique]=unique(table,"rows","sorted") and would prefer to keep NaN as NaN or missing in table_unique without the overhead of replacing it with a dummy value then replacing it again. Dummy values also have the risk of matching existing values in the table, requiring first finding a dummy value that is not in the table.
uniquen (similar to isequaln) would be more eloquent.
Please point out if I am missing something!
I am creating an ESP32 device which will upload data to thingspeak channel and I want the data to be displayed on my website after login. I have succesfully completed the first part of uploading the data to thingspeak. Any suggestions with second part will be very much appreciated.
Hi,
I tried several times to clear my channel data.
I would expect, when I click on Channel settings-clear channel all data from the channel is gone.
For me the data stay in. Delete channel works fine.
Is there a trick?
many thanks for your help
HEP
I'm almost embarressed enough to not ask this. :) I assumed sorting the "Updated" column in the "My Channels" view would sort my channels based on when data was last written to (last updated to) the channel
However, I have channels that have received date in August and yet the date/time stamp in the Uodated column displays a June date and therefore they sort in the wrong order. Does "update" mean something other than a data update, such as a settings update? If so, if there a way to sort the channels by the more recent data update?
With a deployment of ThingSpeak on August 15th, 2024, we are using a new library for visualization of ThingSpeak channel charts. This should require no changes on your part. If you notice any discrepancies/differences in your channel visualization, please post a screenshot on this thread.