eqn =
Results for
in the below code write is working fine, but read is failing ( 404 error) can you please help me reslove this.
/*
Go to thingspeak.com and create an account if you don't have one already.
After logging in, click on the "New Channel" button to create a new channel for your data. This is where your data will be stored and displayed.
Fill in the Name, Description, and other fields for your channel as desired, then click the "Save Channel" button.
Take note of the "Write API Key" located in the "API keys" tab, this is the key you will use to send data to your channel.
Replace the channelID from tab "Channel Settings" and privateKey with "Read API Keys" from "API Keys" tab.
Replace the host variable with the thingspeak server hostname "api.thingspeak.com"
Upload the sketch to your ESP32 board and make sure that the board is connected to the internet. The ESP32 should now send data to your Thingspeak channel at the intervals specified by the loop function.
Go to the channel view page on thingspeak and check the "Field1" for the new incoming data.
You can use the data visualization and analysis tools provided by Thingspeak to display and process your data in various ways.
Please note, that Thingspeak accepts only integer values.
You can later check the values at https://thingspeak.com/channels/2005329
Please note that this public channel can be accessed by anyone and it is possible that more people will write their values.
*/
#include <WiFi.h>
const char *ssid = "xxxx"; // Change this to your WiFi SSID
const char *password = "xxxxx"; // Change this to your WiFi password
const char *host = "api.thingspeak.com"; // This should not be changed
const int httpPort = 80; // This should not be changed
const String channelID = "2805914"; // Change this to your channel ID
const String writeApiKey = "xxxxxxxxxxxxxxxx"; // Change this to your Write API key
const String readApiKey = "xxxxxxxxxxxxxxxx"; // Change this to your Read API key
// The default example accepts one data filed named "field1"
// For your own server you can ofcourse create more of them.
int field1 = 20;
//int field1 = 20;
int numberOfResults = 1; // Number of results to be read
int fieldNumber = 1; // Field number which will be read out
void setup() {
Serial.begin(115200);
while (!Serial) {
delay(100);
}
// We start by connecting to a WiFi network
Serial.println();
Serial.println("******************************************************");
Serial.print("Connecting to ");
Serial.println(ssid);
WiFi.begin(ssid, password);
while (WiFi.status() != WL_CONNECTED) {
delay(500);
Serial.print(".");
}
Serial.println("");
Serial.println("WiFi connected");
Serial.println("IP address: ");
Serial.println(WiFi.localIP());
}
void readResponse(NetworkClient *client) {
unsigned long timeout = millis();
while (client->available() == 0) {
if (millis() - timeout > 5000) {
Serial.println(">>> Client Timeout !");
client->stop();
return;
}
}
// Read all the lines of the reply from server and print them to Serial
while (client->available()) {
String line = client->readStringUntil('\r');
Serial.print(line);
}
Serial.printf("\nClosing connection\n\n");
}
void loop() {
NetworkClient client;
String footer = String(" HTTP/1.1\r\n") + "Host: " + String(host) + "\r\n" + "Connection: close\r\n\r\n";
// WRITE --------------------------------------------------------------------------------------------
if (!client.connect(host, httpPort)) {
return;
}
client.print("GET /update?api_key=" + writeApiKey + "&field1=" + field1 + footer);
readResponse(&client);
delay(200);
// READ --------------------------------------------------------------------------------------------
String readRequest = "GET /channels/" + channelID + "/fields/" + fieldNumber + ".json?results=" + numberOfResults + " HTTP/1.1\r\n" + "Host: " + host + "\r\n"
+ "Connection: close\r\n\r\n";
if (!client.connect(host, httpPort)) {
return;
}
client.print(readRequest);
readResponse(&client);
// -------------------------------------------------------------------------------------------------
//++field1;
delay(10000);
}
Thingspeak
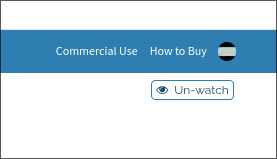
Thingspeak channel shows a "watch" - "un-watch" selection box. What does this do?
Thanks
Hello,
Now that the "Copilot+PC" (Windows ARM) laptops are rapidly increasing in market share (Microsoft Surface Laptop, Dell XPS 13, HP OmniBook X 14, and more), are there any plans to provide builds for Matlab on Windows arm64?
Since there are already Windows builds of Matlab, it shouldn't be too hard to compile for Windows arm64, as far as I know. But I am not famaliar with Matlab's codebase.
Please try to publish Windows arm64 builds soon so that Matlab can be much more usable on Windows on ARM as it will run natively instead of in emulation.
Thank you very much.
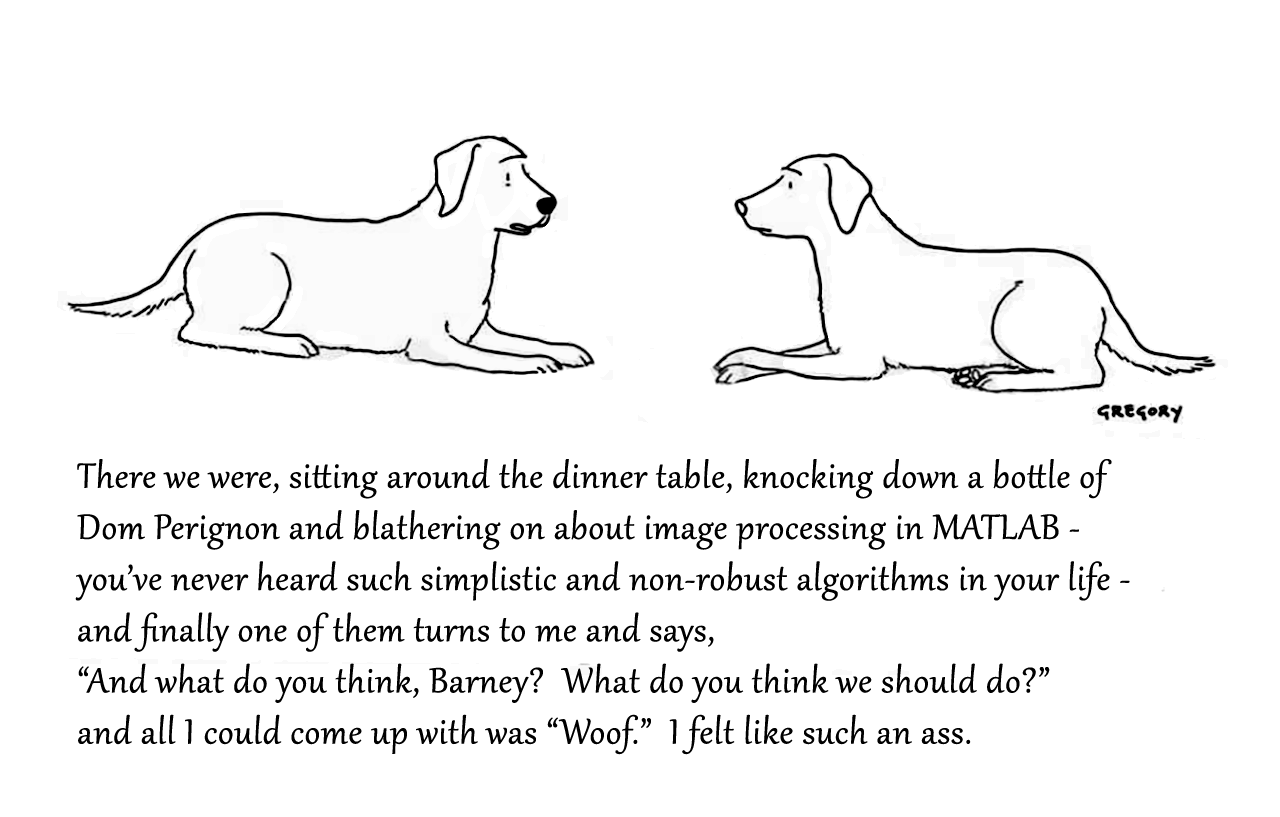
Attaching the Photoshop file if you want to modify the caption.
Dear Sir,
I login my channel in a device using my user name and password (also client id & password) but when I also login using the same user name and password in another device, the first one connection was forced disconnected. I want to publish via thinkspeak mqtt by using the two devices. Please advise how I can do it. Can I use the same thinkspeak user name to login? Is it needed to have another thinkspeak user to login? In this case, please also advise. Many thanks.
Aaron

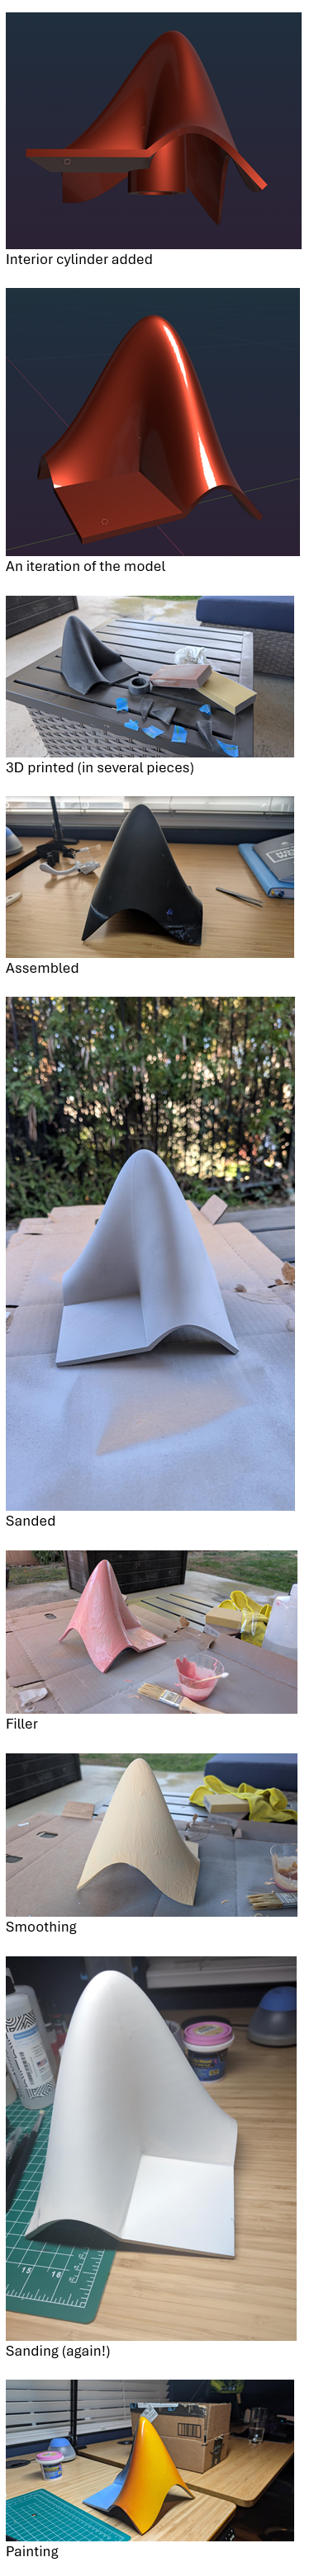
What better way to add a little holiday magic than the L-shaped membrane atop your evergreen? My colleagues output the shape and then added some thickness and an interior cylinder in Blender. Then, the shape was exported to STL and 3D printed (in several pieces). Then glued, sanded, primed, sanded again and painted. If you like, the STL file is attached. Thank you to https://blogs.mathworks.com/community/2013/06/20/paul-prints-the-l-shaped-membrane/ and a tip of the hat to MATLAB Ornament. Happy Holidays!

I have a device that via GPRS publish correctly, after autentication to the server mqtt3.thingspeak.com , a lot of datas like:
.{"sensorDatas":[{"flag":"COUNT","value":1},...........,{"flag":"AI1","value":25.80}]}
I configure a correct Channel with a field called AI1, but I can't fill it with that value 25.80.
I am sure that the device communicate to the server the string {"flag":"AI1","value":25.80} but nothing.
Could you tell me what I have to do? Probably I have to write some software code, may someone help me?
Are there some examples for a beginner like me?
Thank you very much
Hello
I am trying to connect Thingspeak to ibfluxdb. Is that possible? how you do that??
Speaking as someone with 31+ years of experience developing and using imshow, I want to advocate for retiring and replacing it.
The function imshow has behaviors and defaults that were appropriate for the MATLAB and computer monitors of the 1990s, but which are not the best choice for most image display situations in today's MATLAB. Also, the 31 years have not been kind to the imshow code base. It is a glitchy, hard-to-maintain monster.
My new File Exchange function, imview, illustrates the kind of changes that I think should be made. The function imview is a much better MATLAB graphics citizen and produces higher quality image display by default, and it dispenses with the whole fraught business of trying to resize the containing figure. Although this is an initial release that does not yet support all the useful options that imshow does, it does enough that I am prepared to stop using imshow in my own work.
The Image Processing Toolbox team has just introduced in R2024b a new image viewer called imageshow, but that image viewer is created in a special-purpose window. It does not satisfy the need for an image display function that works well with the axes and figure objects of the traditional MATLAB graphics system.
I have published a blog post today that describes all this in more detail. I'd be interested to hear what other people think.
Note: Yes, I know there is an Image Processing Toolbox function called imview. That one is a stub for an old toolbox capability that was removed something like 15+ years ago. The only thing the toolbox imview function does now is call error. I have just submitted a support request to MathWorks to remove this old stub.
The int function in the Symbolic Toolbox has a hold/release functionality wherein the expression can be held to delay evaluation
syms x I
eqn = I == int(x,x,'Hold',true)
which allows one to show the integral, and then use release to show the result
release(eqn)
Maybe it would be nice to be able to hold/release any symbolic expression to delay the engine from doing evaluations/simplifications that it typically does. For example:
x*(x+1)/x, sin(sym(pi)/3)

If I'm trying to show a sequence of steps to develop a result, maybe I want to explicitly keep the x/x in the first case and then say "now the x in the numerator and denominator cancel and the result is ..." followed by the release command to get the final result.
Perhaps held expressions could even be nested to show a sequence of results upon subsequent releases.
Held expressions might be subject to other limitations, like maybe they can't be fplotted.
Seems like such a capability might not be useful for problem solving, but might be useful for exposition, instruction, etc.
I am using a micro:bit device with ESP8266 for a IOT project, but cannot connect thingspeak recently.
The conncection is unstable, I can hardly connect to thingspeak for days, somehow it works last night for 30 mins and then it fails.
The program does not change and I have included a 25 sec delayed between each data sending.
Please advice why and how to fix it. Thank you.


Christmas season is underway at my house:

(Sorry - the ornament is not available at the MathWorks Merch Shop -- I made it with a 3-D printer.)
I am using the ELECFREAKS IOT:bit Expansion Board with micro:bit to record data, it worked normally but in this week I tested again, and discover no data is uploaded to the channel ie.no entries in channel. The code in makecode are the same as before and the wifi is work, I cannot find the reason that cause this failure.
I am using the free option with 4 channels available. I do not have any channels listed, but when I want to create a new channel it gives me an error massage to say that I have used up my 4 channels and need to purchase units to create additional channels.
Hello
I have 3 devices (IOT board using SIM7600 module) sending one value to Thingsspeak. Have been working just fine a couple of years. However 14/11-24 I receive http error code 406 for all 3 devices.
The http get is working just fine when testing directly in the browser (https://api.thingspeak.com/update?api_key=xxxxx&field1=33), the server return the entrie number.
However, when running the same address via SIM7600 I receive - +HTTPACTION: 0,406,0
Any tips for the 406 error code?
Hello, I am wondering why I have over 12000 messages (writes)per day to a channel which I only update all 8 fields every 20 minutes. Or are these statistic timely delayed? Since testing I might have more writes, but now with my ready weather station only every 20 minutes my data will be updated. Wetterbox Channel ID: 2391212 Access: Public Can you explain this to me? Thank you for your help. Regards, Julian
It would be nice to have a function to shade between two curves. This is a common question asked on Answers and there are some File Exchange entries on it but it's such a common thing to want to do I think there should be a built in function for it. I'm thinking of something like
plotsWithShading(x1, y1, 'r-', x2, y2, 'b-', 'ShadingColor', [.7, .5, .3], 'Opacity', 0.5);
So we can specify the coordinates of the two curves, and the shading color to be used, and its opacity, and it would shade the region between the two curves where the x ranges overlap. Other options should also be accepted, like line with, line style, markers or not, etc. Perhaps all those options could be put into a structure as fields, like
plotsWithShading(x1, y1, options1, x2, y2, options2, 'ShadingColor', [.7, .5, .3], 'Opacity', 0.5);
the shading options could also (optionally) be a structure. I know it can be done with a series of other functions like patch or fill, but it's kind of tricky and not obvious as we can see from the number of questions about how to do it.
Does anyone else think this would be a convenient function to add?