Results for
I've noticed a few times that a bulk update can take a while to appear. Normally a few minutes at most but at the moment it seems to be much longer, hours maybe. I know the message I sent had been received as I get an RC = 202 as normal. I sent a non bulk update via the browser and it appeared imediately.
Is this something I have to get used to ? It's a problem when I first set up a device and look at Thingspeak to check it's sending messages correctly (I send a bulk update with 1 message when it first connets). Even a single data point sent in batch form is not appearing.
Update: the data has started appearing but it's still hours behind.
figure out what my old code does
18%
write code comments for future me
11%
address a code analyzer warning
3%
reflect on the skills I've gained
8%
get food on my mouse and keyboard
38%
All of the above
22%
16434 votes
Getting Started with Simulink | Tips and Tricks to Get the Most Out of Simulink
Watch live as Tianyi Zhu and Ashwin Dhawad walk through how you can get started with Simulink by modeling, simulating, and tuning a PID controller for a DC Motor. This session isn’t just for beginners; they will show you the latest and greatest tips and tricks to help you get the most out of Simulink.

I am processing ocean and climate data (1982-2022). Here, I have table which having heatwaves events details. Now, I want to sort the data month wise and also seasonal wise (summer:October- February, and winter:March-September), and then i wanted to plot mean seasonal and trend.
Sample file is attached. length of original file may vary in size.
Thanks in addvance.
MATLAB Central has been great community-based MATLAB resources, but you can now access its content programmatically via the public API, and I created a MATLAB function to take advantage of that. You can learn more here https://api.mathworks.com/community
Example:
data = searchMATLABCentral("plotting",scope="matlab-answers",sort_order="created desc",created_after=datetime("2023-01-01"));
T = struct2table(data.items);
T(:,["created_date","title","is_answered"])
Output
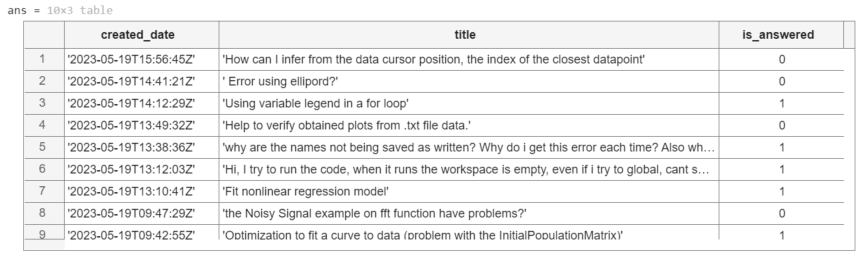
Function
function results = searchMATLABCentral(query,options)
% SEARCGMATLABCENTRAL retrieves content of the MATLAB Central for a given
% query and returns the result as a struct.
% The function uses MathWorks RESTful API to search for content.
% The API is rate limited via IP throttling. No authentication is required.
% See API documentation for more details https://api.mathworks.com/community
%
% Input Arguments:
%
% query (string) - Required. The search query string.
% scope (string) - Optional. Specify the artifact. If not specified,
% the scope defaults to 'matlab-answers'.
% Other options include 'file-exchange','blogs','cody',
% 'community-highlights', and 'community-contests'.
% tags (string) - Optional. Specify a comma-separated list of tags.
% created_before (datetime) - Optional. Specify the last date in the results
% created_after (datetime) - Optional. Specify the first date in the results
% sort_order (string) - Optional. Speficy the order of the results.
% If not specified, it defaults to "relevance desc".
% Other options include 'created asc', 'created desc',
% 'updated asc','updated desc', 'relevance asc',
% and 'relevance desc'.
% page (integer) - Optional. Specify the page to retrieve.
% If the 'has_more' field in the result is positive,
% increment this argument to retrieve the next page.
% count (integer) - Optional. Specify the number of results as a value
% between 1 and 50; The default is 10.
%
% Output Arguments:
%
% results (struct) - Structure array containing the results of the search.
% validate input arguments
arguments
query string {mustBeNonzeroLengthText,mustBeTextScalar}
options.scope string {mustBeMember(options.scope,["matlab-answers", ...
"file-exchange","blogs","cody","community-highlights", ...
"community-contests"])} = "matlab-answers";
options.tags string {mustBeNonzeroLengthText,mustBeVector}
options.created_before (1,1) datetime
options.created_after (1,1) datetime
options.sort_order string {mustBeMember(options.sort_order,["created asc", ...
"created desc","updated asc","updated desc","relevance asc","relevance desc"])}
options.page double {mustBeInteger,mustBeGreaterThan(options.page,0)}
options.count double {mustBeInteger,mustBeInRange(options.count,1,50)}
end
% API URL and endpoint
url = "https://api.mathworks.com/community";
endpoint = "/v1/search";
% convert MATLAB datetime to the internet datetime format string
if isfield(options,"created_before")
options.created_before = string(options.created_before,"yyyy-MM-dd'T'HH:mm:ss'Z'");
end
if isfield(options,"created_after")
options.created_after = string(options.created_after,"yyyy-MM-dd'T'HH:mm:ss'Z'");
end
% convert optional inputs into a cell array of key-value pairs
keys = fieldnames(options);
vals = struct2cell(options);
params = [keys,vals].';
% call the API
try
results = webread(url+endpoint,"query",query,params{:});
catch ME
rethrow(ME)
end
end
I can't get my dynamic position data to display.My JASON body looks like this:
{ "api_key": "XXXXXXXXXXXXXXX", "created_at": "2023-05-15T23:17:54.000Z", "field1": 50.71875, "field2": 20.375, "field3": 4.1132812, "field4": 91.625, "field5": 1523985, "lat": -25.8152875, "long": 152.58867187500002, "status": "Bauple" }
Fields 1-4 display fine, as does the Status field. However the position map always shows a balloon at (0,0). I've tried "lat" and "latitude", "long" and "longitude", but no luck. Any ideas?
This is weird to me.
I have an IP address., I am connected to the MQTT server.
I see the number of entries increasing in my channel. However, no data visible in the graph.
This is the AT command to the SIM7080 module : AT+SMPUB="channels/**********/publish",37,1,1
And then I send the payload : field1=1&field2=2&field3=3&field4=400
As said, each time a send a request I see the number of entries increasing, but no real data.
The export shows me this :
created_at,entry_id,field1,field2,field3,field4
2023-05-15 17:33:40 UTC,1,,,,
2023-05-15 17:34:59 UTC,2,,,,
2023-05-15 17:36:16 UTC,3,,,,
2023-05-15 17:37:31 UTC,4,,,,
2023-05-15 17:38:48 UTC,5,,,,
Any idea why the content of the field is empty?
Thanks
I have a channel where I upload measurements from a BME280 sensor, but on the Pi Pico I calculate the min/avg/max temperature every 10 minutes.
I never have created a visualisation from scratch before. Usually, I can continue from a working example, but I know nothing (yet) about the mathlab language...
Can someone show me how to create a diagram of my temperatures, were the average temp is a (thick) solid line, and the min/max temperatures are a filled out area above and below?
Is it possible to change the color (Background and the Meter itself) of the Gauge Widget ?
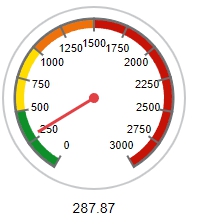
The Widget Edit Menu will only offers Colors for the range Indicators, but not for the Gauge itself.
The background in black would be ideal.
Congratulations, @John D'Errico for winning the Editor's Pick badge awarded for MATLAB Answers, in recognition of your awesome solution in What to be chosen c so that all elements of matrix B will be a round number. B=A.c; where A is the matrix of non integers. The OP has not accepted his answer yet, but
As with other nominated answers, you provided detailed explanation with examples to show that what the OP is looking for may not be possible in some cases.
Unfortunately, you can only get this badge once - perhaps this raises a question about how this award should work. In any case, we nonetheles appreciate your ongoing effort to help other users in the community. Thnk you so much!
MATLAB Central Team
Object Detection and Tracking using Computer Vision
In this event, Matt and Megan show you how to perform one or the more difficult task in computer vision: tracking multiple objects.
They will walk through an example from the new Coursera specialization, Computer Vision for Engineering and Science. The code and video used in the example are available to those who sign up for the specialization.

I have created a mqtt device in thingspeak, allocated a channel for pub and sub. I noted down the credentials for connection when the device was created. I tried to connect using the host mqtt3.thingspeak.com port 1883 and the supplied credentials(user name and password). I tried with node red (mqtt node) and also mqtt lense but still cannot connect. Would appreciate advice some advise. Thanks
AI
22%
Wireless Connectivity and Radar
4%
Autonomous Systems and Robotics
15%
Cloud, Enterprise, and DevOps
2%
Algorithms and Data Analytics
17%
Modeling and Simulation
36%
179 votes
Up until yesterday (May 6, 2023), time controls were working fine in regards to running my Analysis code recurring at specified intervals. Now they will no run more than once? I’ve tried creating new time controls but no luck. I have to manually run the code to get updated results.
How can I display a string value using thingspeak visualization ? for example name, gender, bloodgroup,etc.
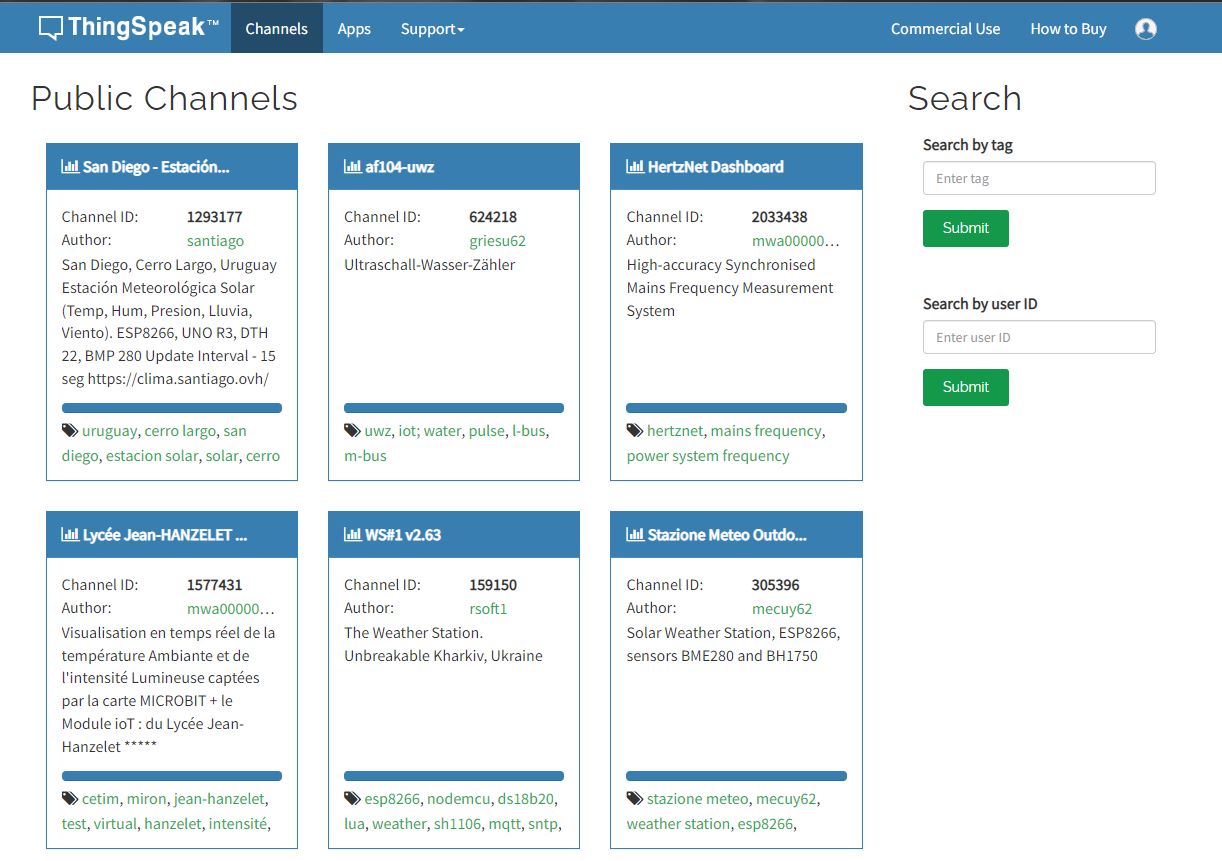
Hello - I have a new account and when I click My Channels, I don't get a drop down menu with choices like My Channels, My Image Channels, ect. I only get Public Channels when I click the Channels tab. I can't select My Channels. Could someone please help me?
Thank you
We need to do IoT work for our university project. I want to open a channel without any profit motive so that I can see the statistics. New Channel option does not appear.
After signing in pop up showing succesfully signed in ,but its getting signed out automatically
plz help me and comment if you are facing same problem
I try this code in MATLAB:
This code working fine:
readChannelID = [1788078];
fieldID1 = [1];
readAPIKey = '';
[data, time] = thingSpeakRead(readChannelID, 'Field', fieldID1, 'NumPoints', 30, 'ReadKey', readAPIKey);
plot(time, data);
This code have error : Unrecognized table variable name 'x1'.
readChannelID = [1788078];
fieldID1 = [2];
readAPIKey = '';
[data, time] = thingSpeakRead(readChannelID, 'Field', fieldID1, 'NumPoints', 30, 'ReadKey', readAPIKey);
plot(time, data);
What i do wrong? Thanks.