Results for

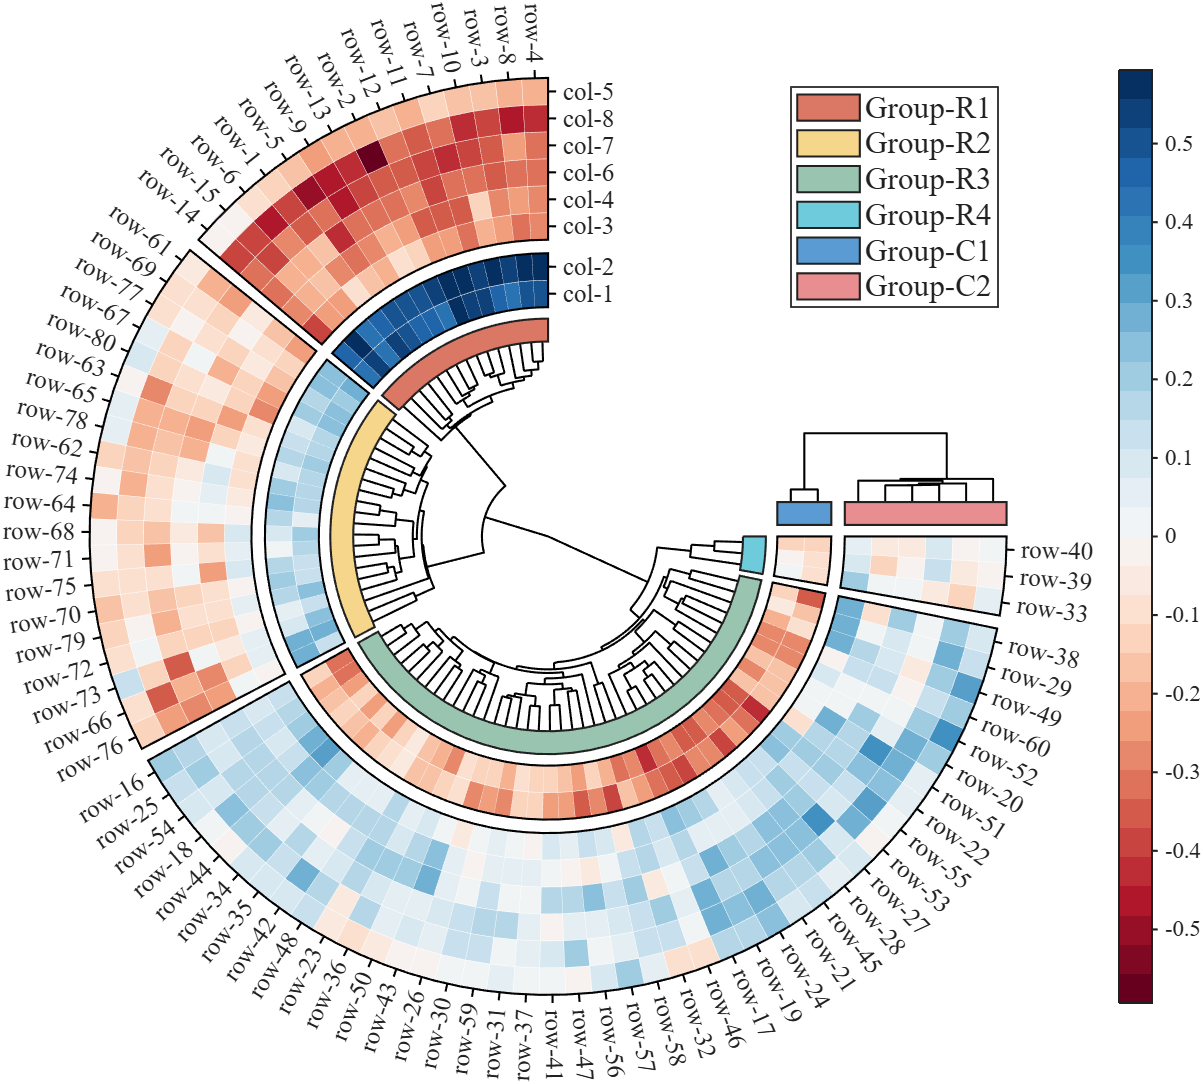
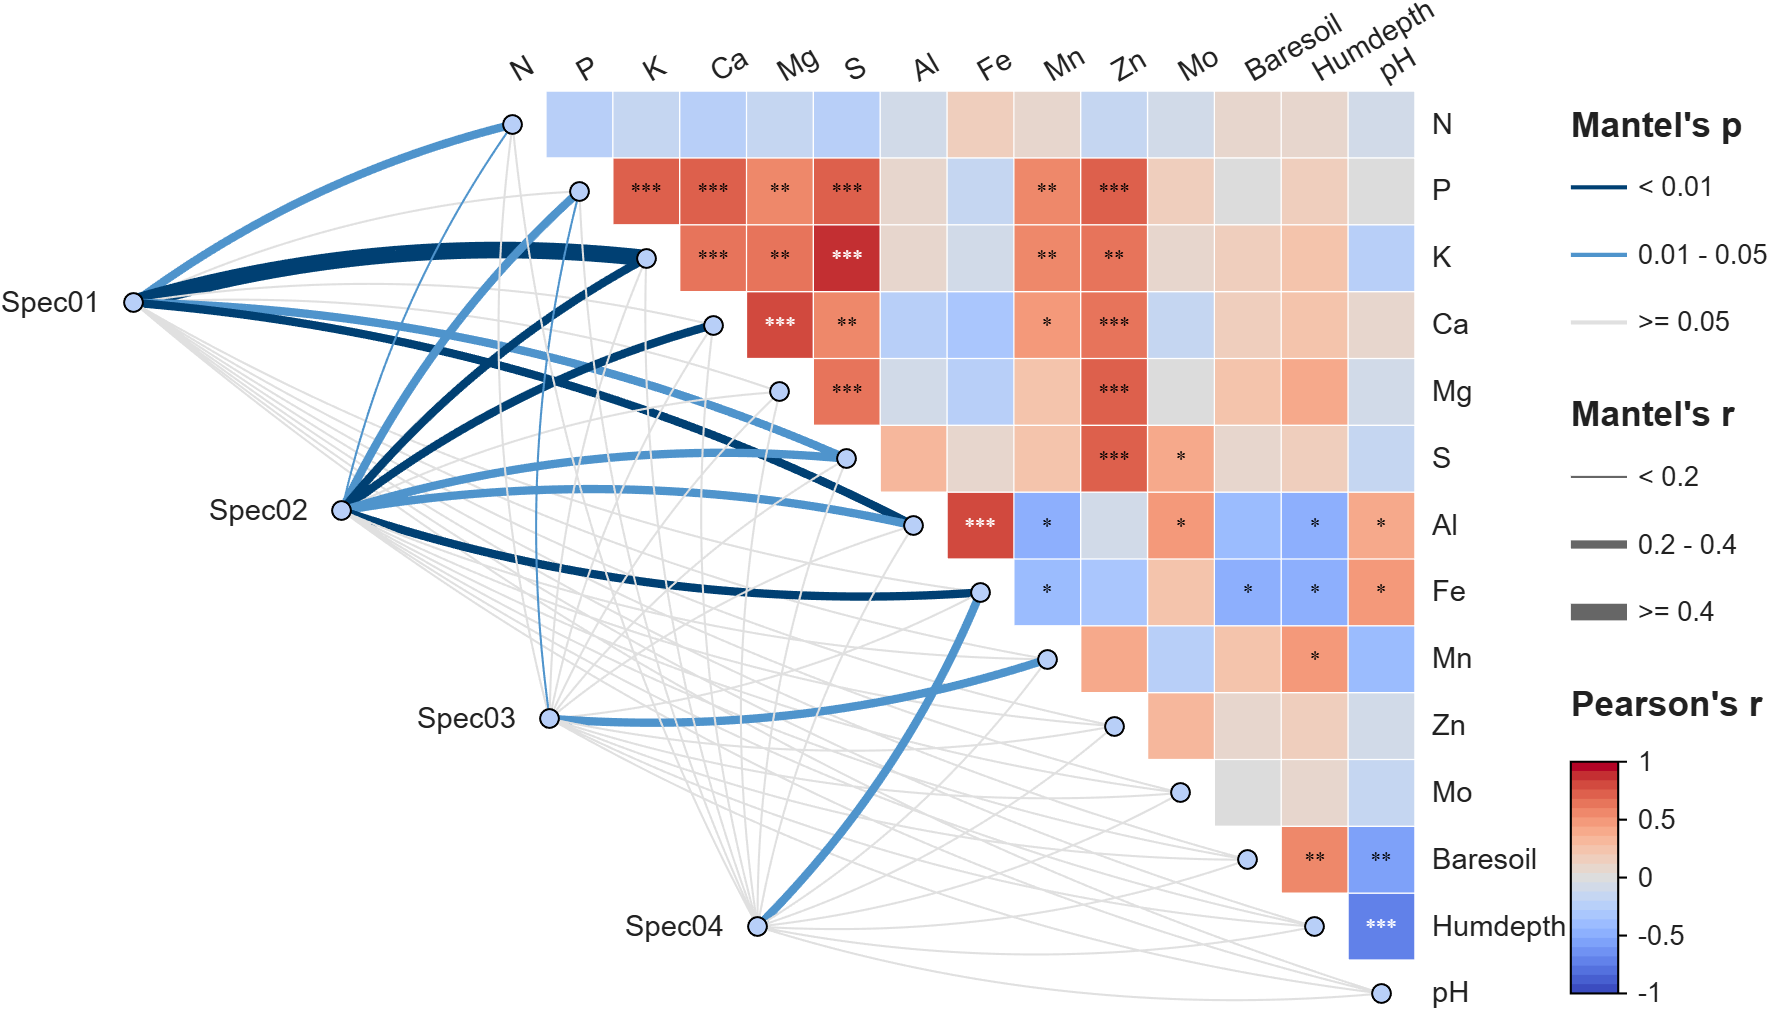
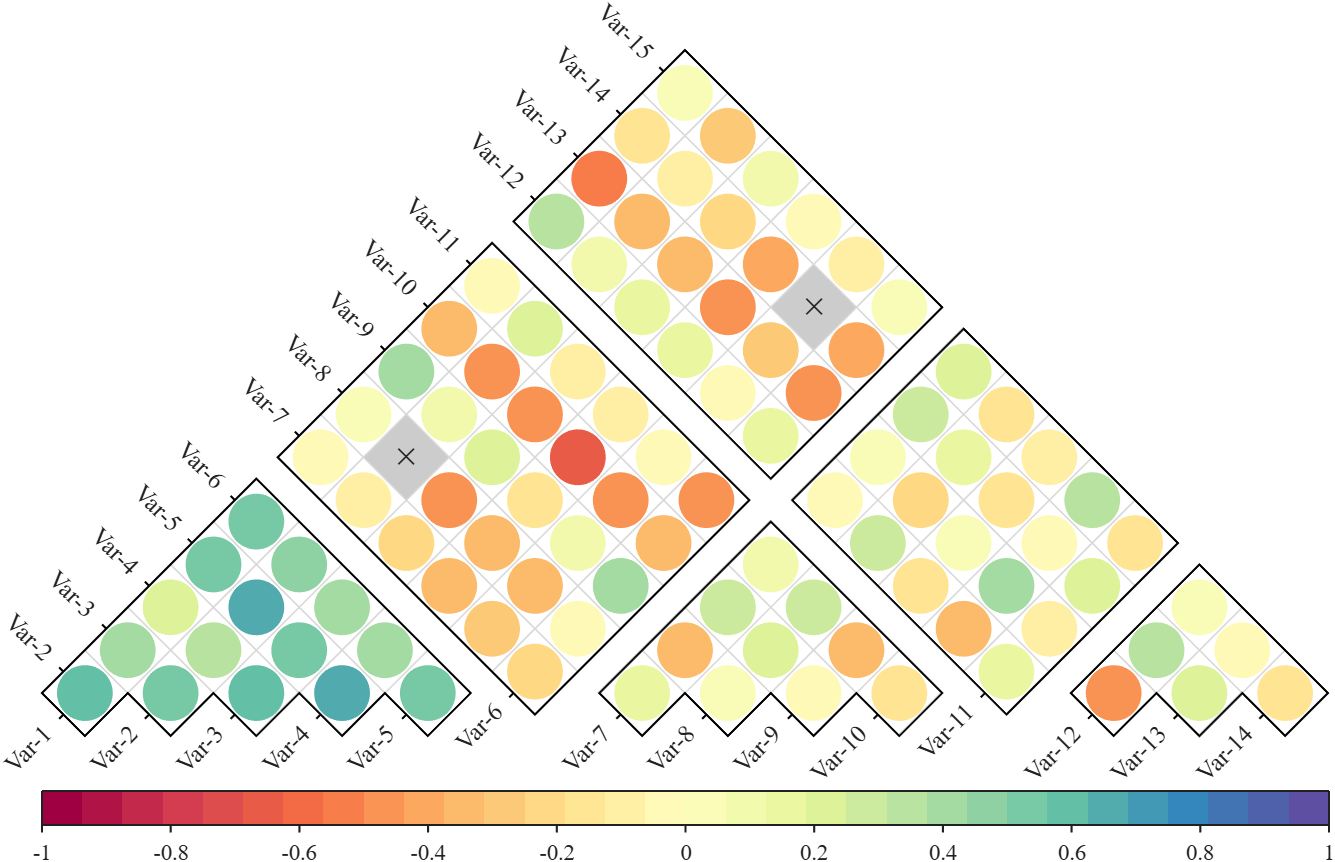
Annular, sector, triangular, and cluster heatmaps can all be produced by this tool:https://www.mathworks.com/matlabcentral/fileexchange/125520-special-heatmap
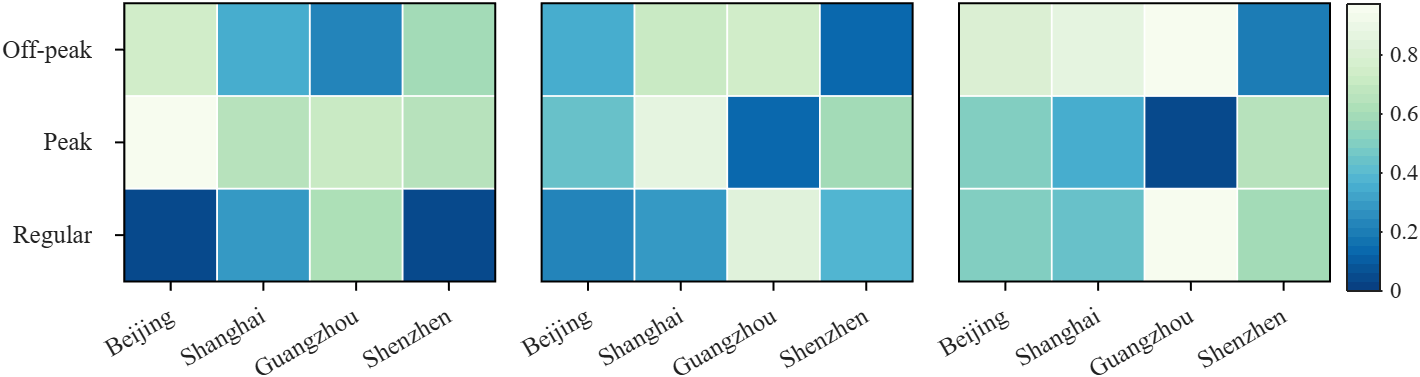
Demo: Group Sep with non-square matrix
Data = rand(3, 12);
SHM = SHeatmap(Data, 'Format','sq');
SHM.RowName = {'Off-peak', 'Peak', 'Regular'};
SHM.ColName = {'Beijing', 'Shanghai', 'Guangzhou', 'Shenzhen'};
SHM.ColGroup = [1,1,1,1, 2,2,2,2, 3,3,3,3];
SHM.draw().setFrame()
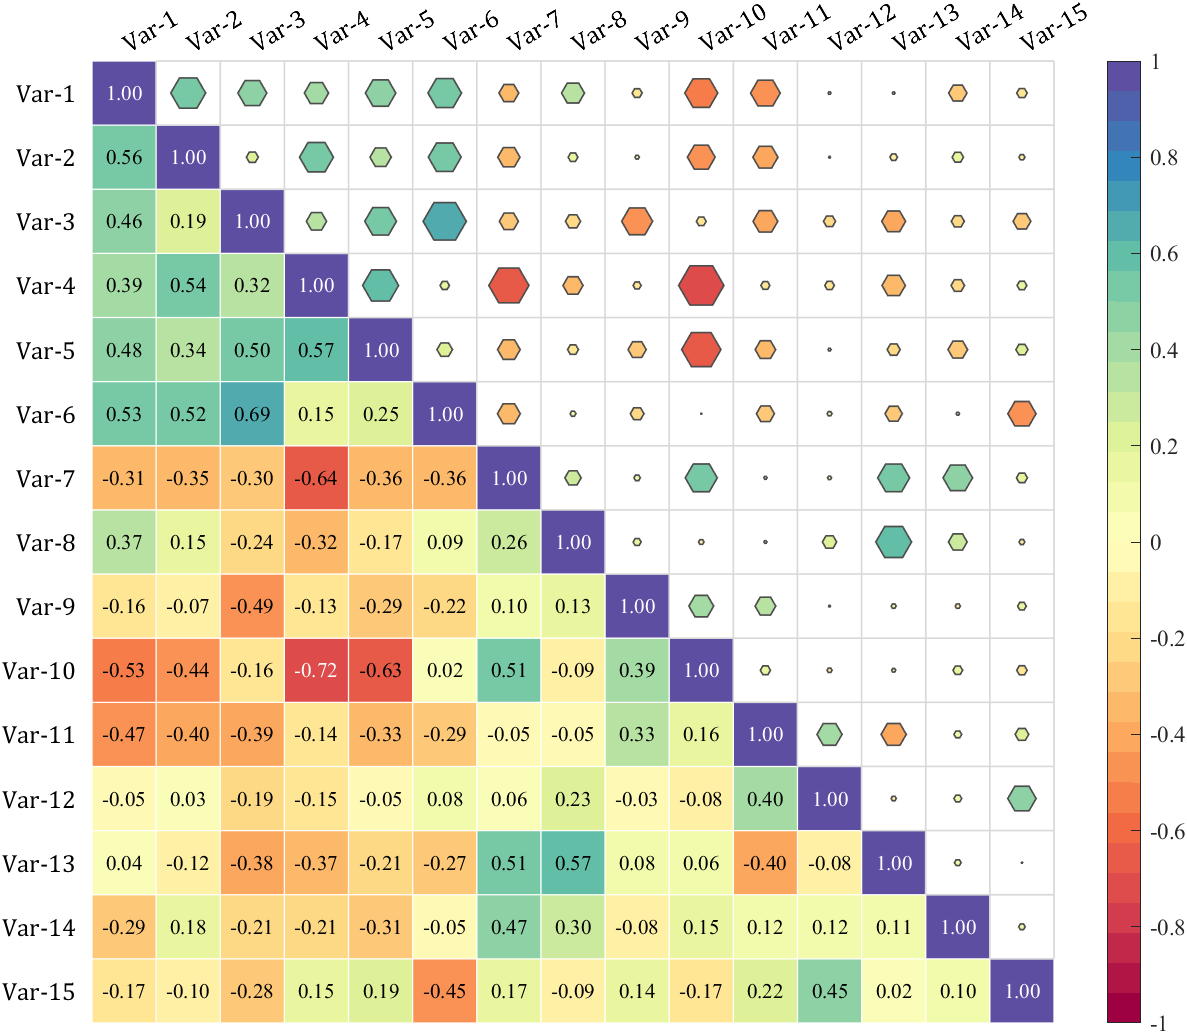
Demo: Merge two triangle heatmaps
% Made up some data casually (随便捏造了点数据)
X = randn(20,15) + [(linspace(-1,2.5,20)').*ones(1, 6), (linspace(.5,-.7,20)').*ones(1, 5), (linspace(.9,-.2,20)').*ones(1, 4)];
% Get the correlation matrix (求相关系数矩阵)
Data = corr(X);
figure()
SHM_m1 = SHeatmap(Data, 'Format','sq').draw().setType('tril');
SHM_m1.setColLabel('Visible','off').setText()
SHM_m2 = SHeatmap(Data, 'Format','hex').draw().setType('triu0');
SHM_m2.setRowLabel('Visible','off').setColLabel('Visible','on') % Show the hidden Var-1 label (显示隐藏的 Var-1 标签)
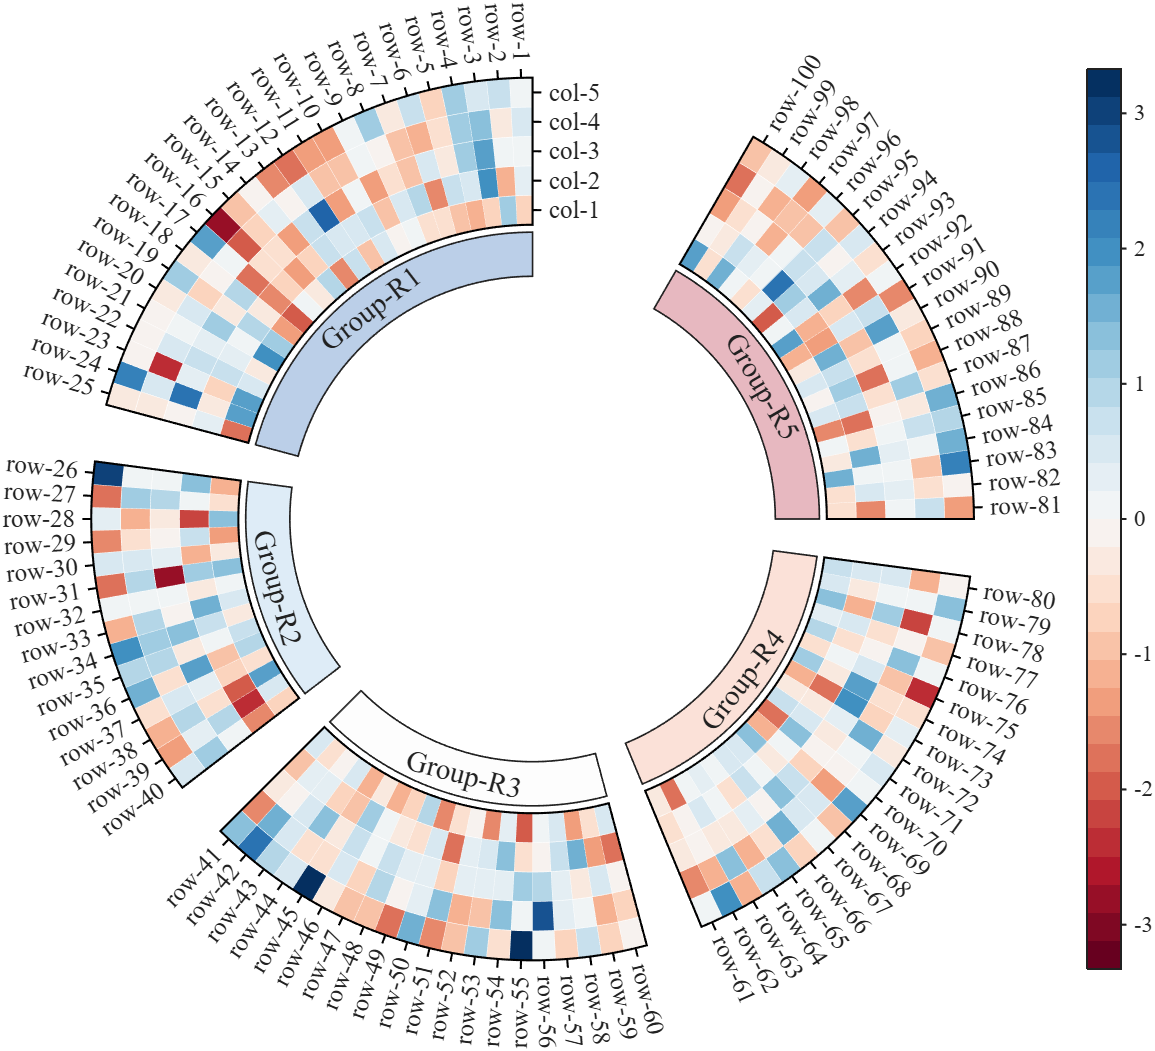
Demo: Circular heatmap with Group Block and GroupSep
% Circular heatmap is currently supported only for
% SHeatmap with 'sq' Format and 'full' Type.
rng(1)
Data = randn(100, 5);
rowName = compose('row-%d', 1:100);
colName = compose('col-%d', 1:5);
rowGroup = [ones(1, 25), 2.*ones(1, 15), 3.*ones(1, 20), 4.*ones(1, 20), 5.*ones(1, 20)];
rowColor = [187,207,232; 222,236,247; 253,253,253; 251,225,216; 231,184,192]./255;
rgnames = {'Group-R1','Group-R2','Group-R3','Group-R4','Group-R5'};
% create figure (图窗创建)
fig = figure('Units','normalized', 'Position',[.1,.05,.5,.72]);
ax = axes('Parent',fig, 'Position',[.1,.1,.75,.75]);
% Draw group block (绘制分组方块)
SCB_L = SClusterBlock(ax, rowGroup, 'Orientation','left', 'ColorList',rowColor, 'Group',rowGroup, 'GroupSep',2.5);
SCB_L.draw(); SCB_L.setXYTLim('XLim',[1.65,1.95], 'YLim',[0, 1], 'TLim',[-3*pi/2, pi/3]);
% Draw circular heatmap (绘制环形热图)
SHM = SHeatmap(ax, Data, 'Format','sq', 'RowGroup',rowGroup, 'GroupSep',2.5);
SHM.TickLength = .3;
SHM.draw();
SHM.setRowName(rowName)
SHM.setColName(colName)
SHM.setRowLabelLocation('right')
SHM.setColLabelLocation('top')
% YLim(1) -> TLim(1), YLim(2) -> TLim(2)
SHM.setXYTLim('XLim',[2, 3], 'YLim',[0, 1], 'TLim',[-3*pi/2, pi/3]);
SHM.Colorbar.Position(1) = SHM.Colorbar.Position(1) + .1;
gHdl = text(ax, SCB_L.X, SCB_L.Y, rgnames, 'FontSize',14, 'FontName','Times New Roman');
setTextPerpRadial(gHdl)
colormap(slanCM(97, 32))
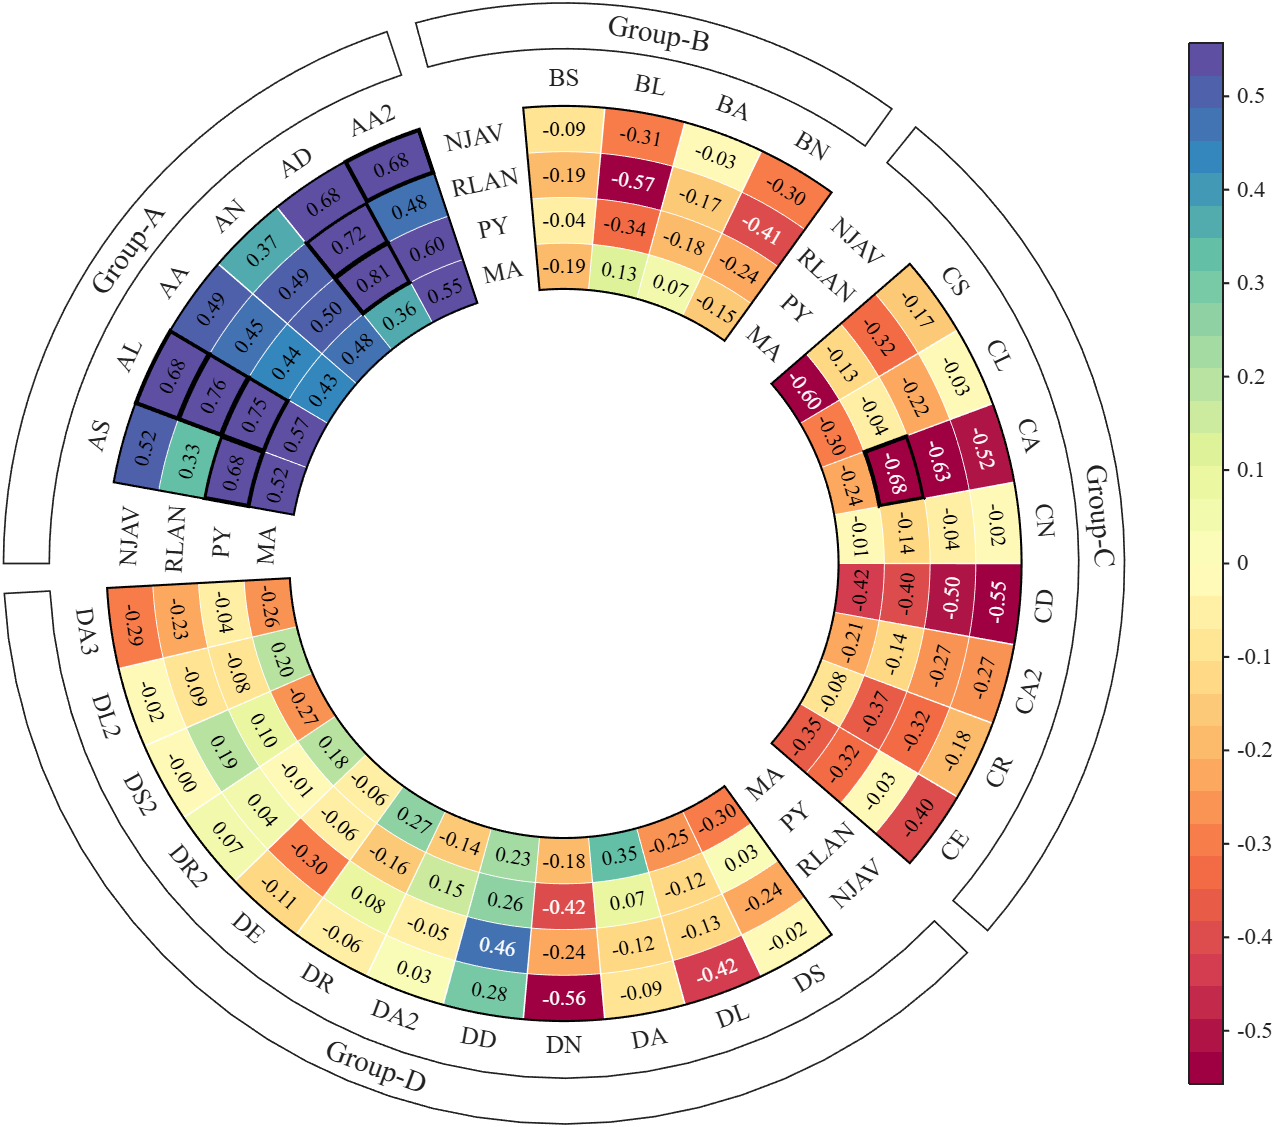
More than 50 examples are incorporated into this tool:
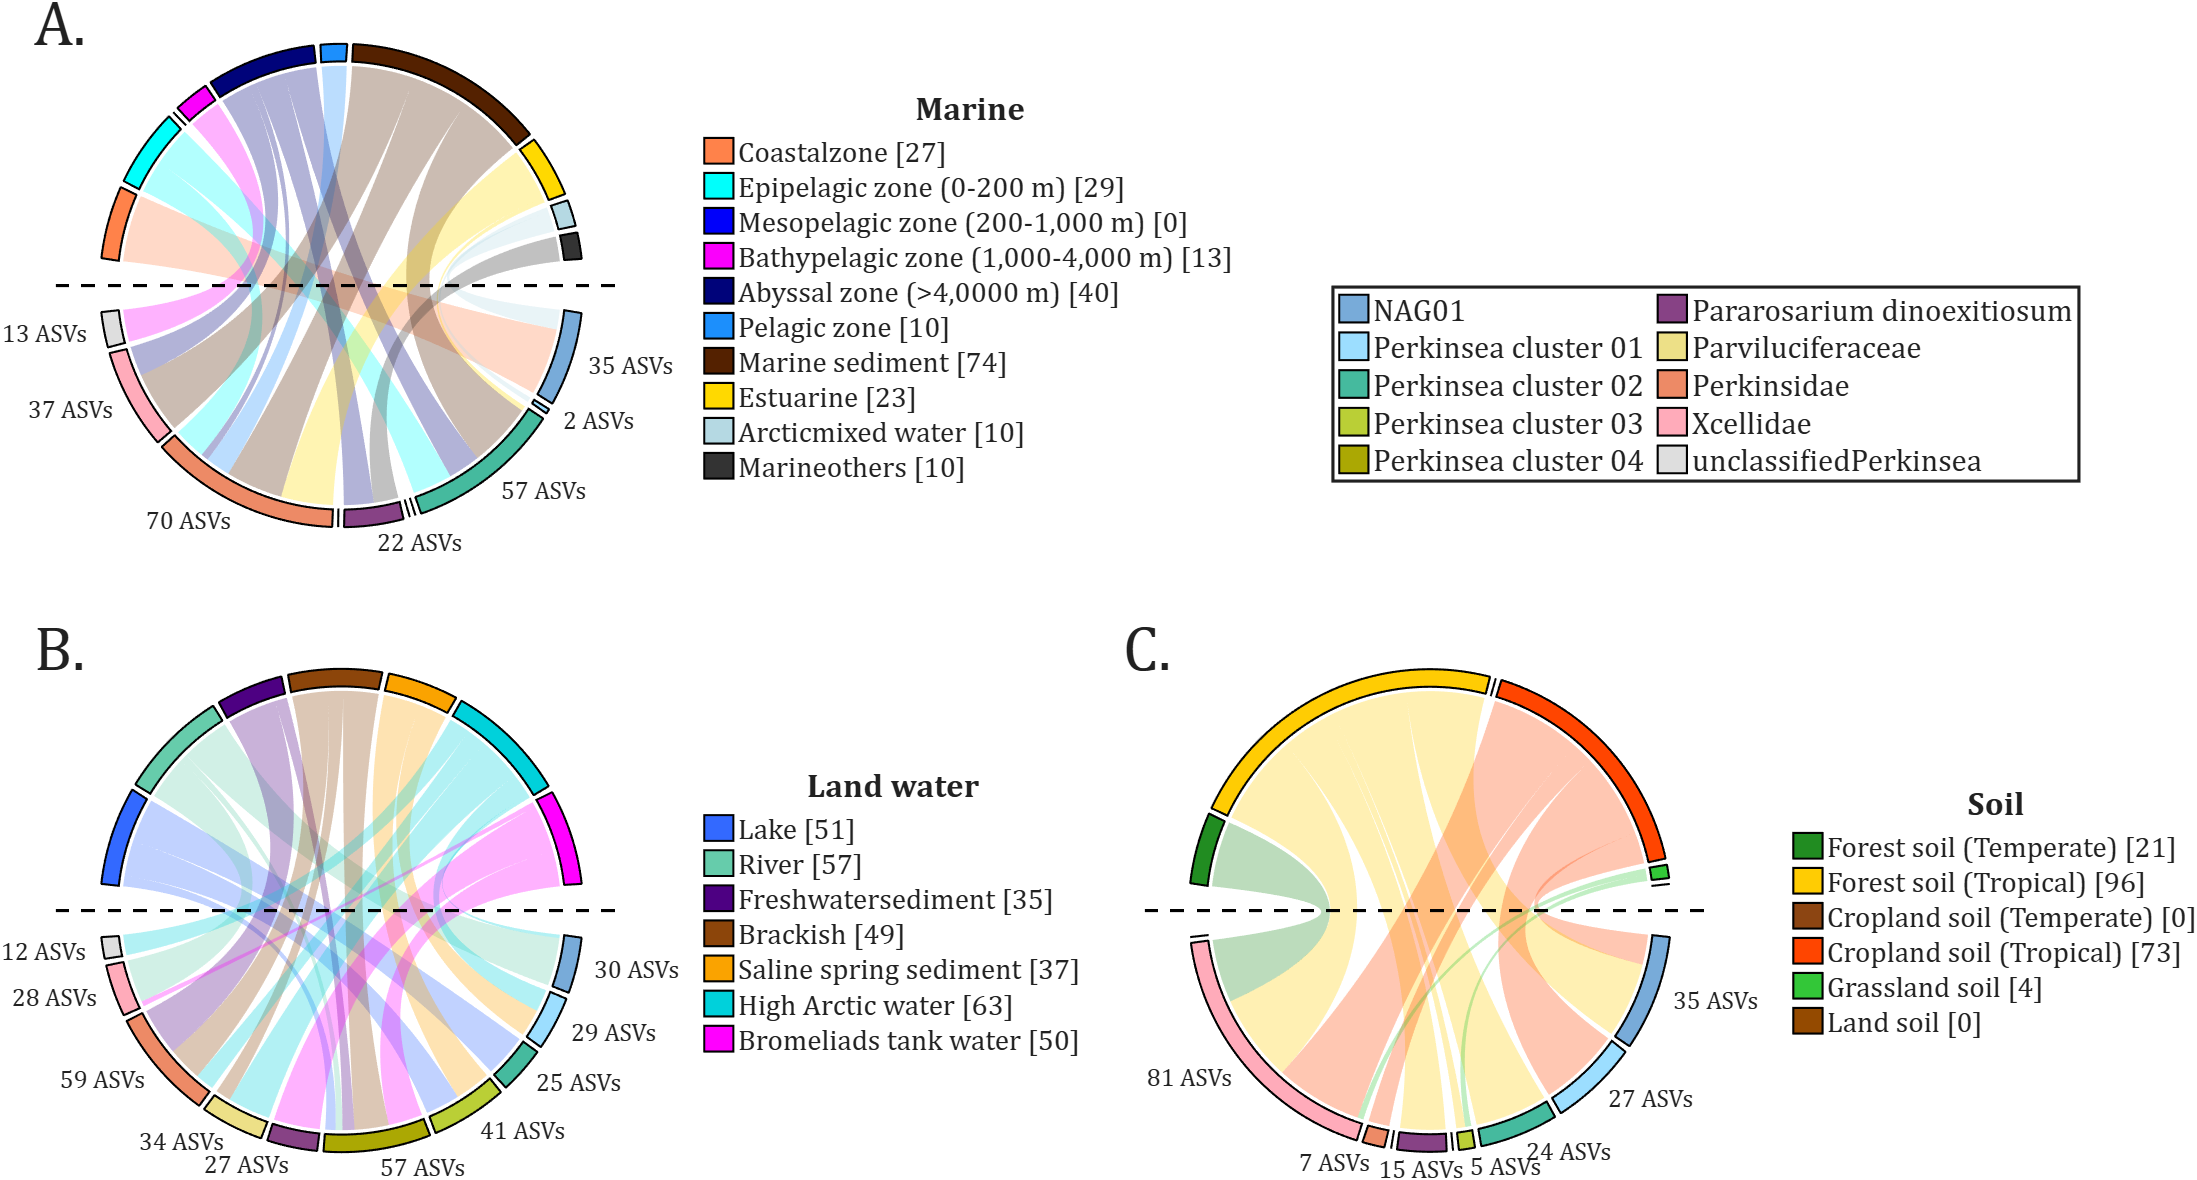
All figures presented in this Discussion were generated using MATLAB.
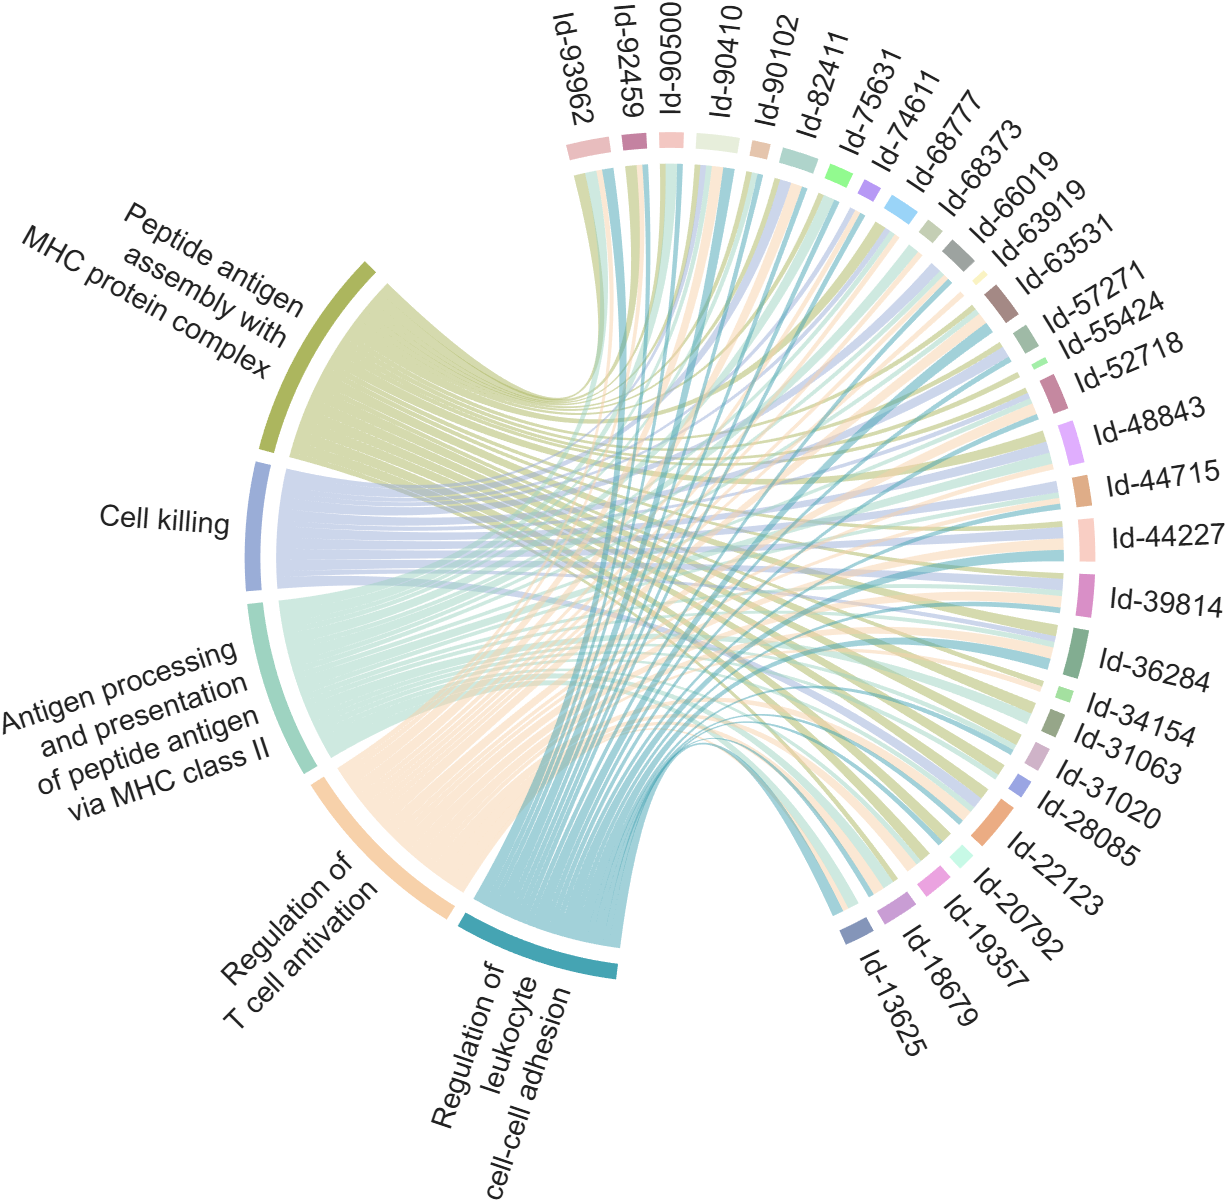
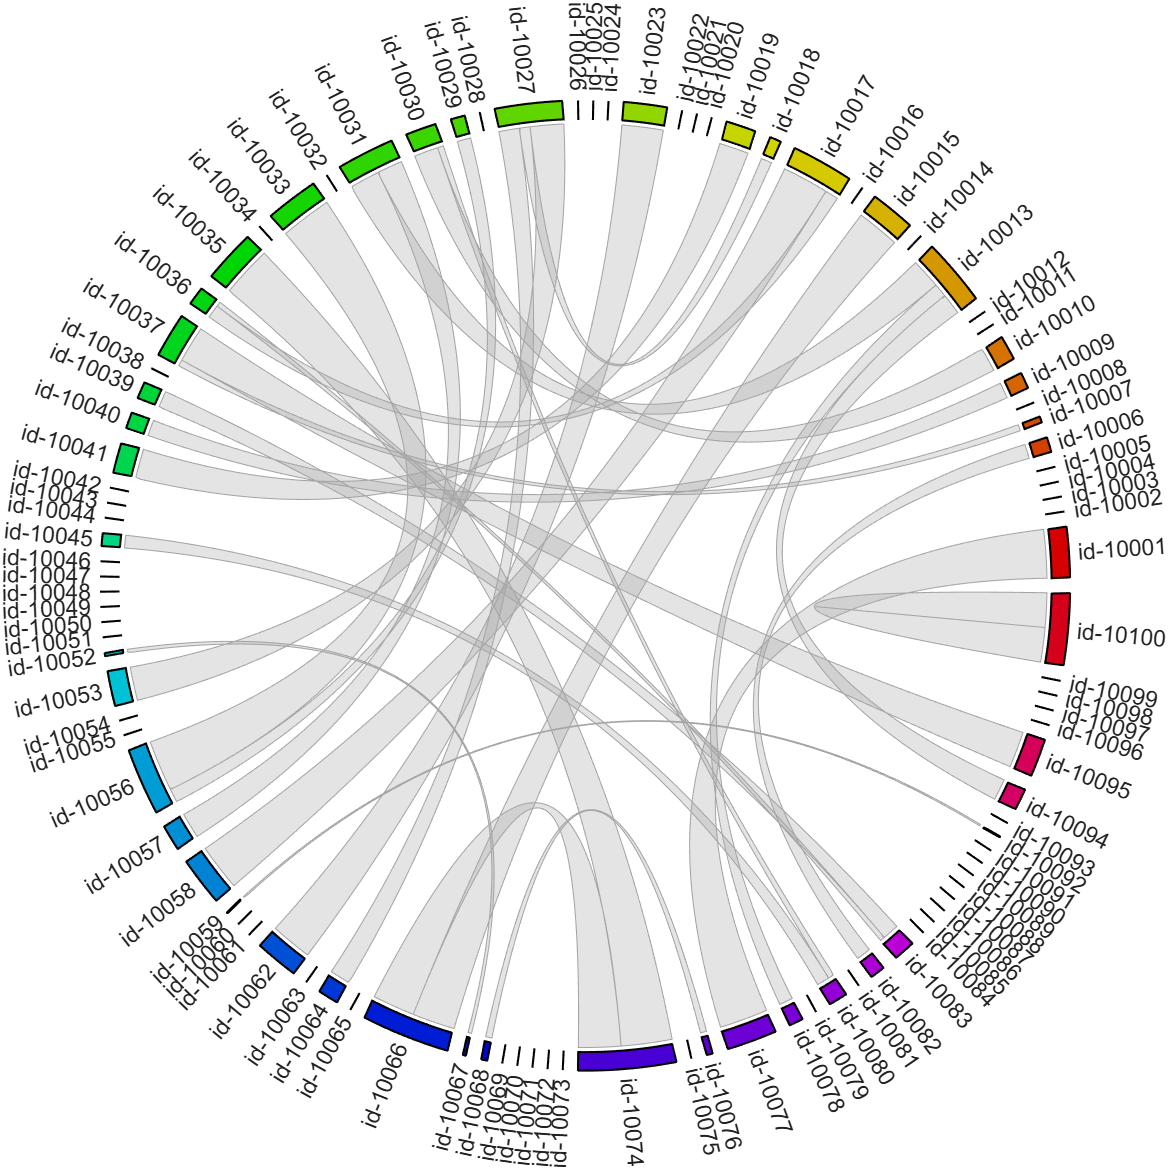
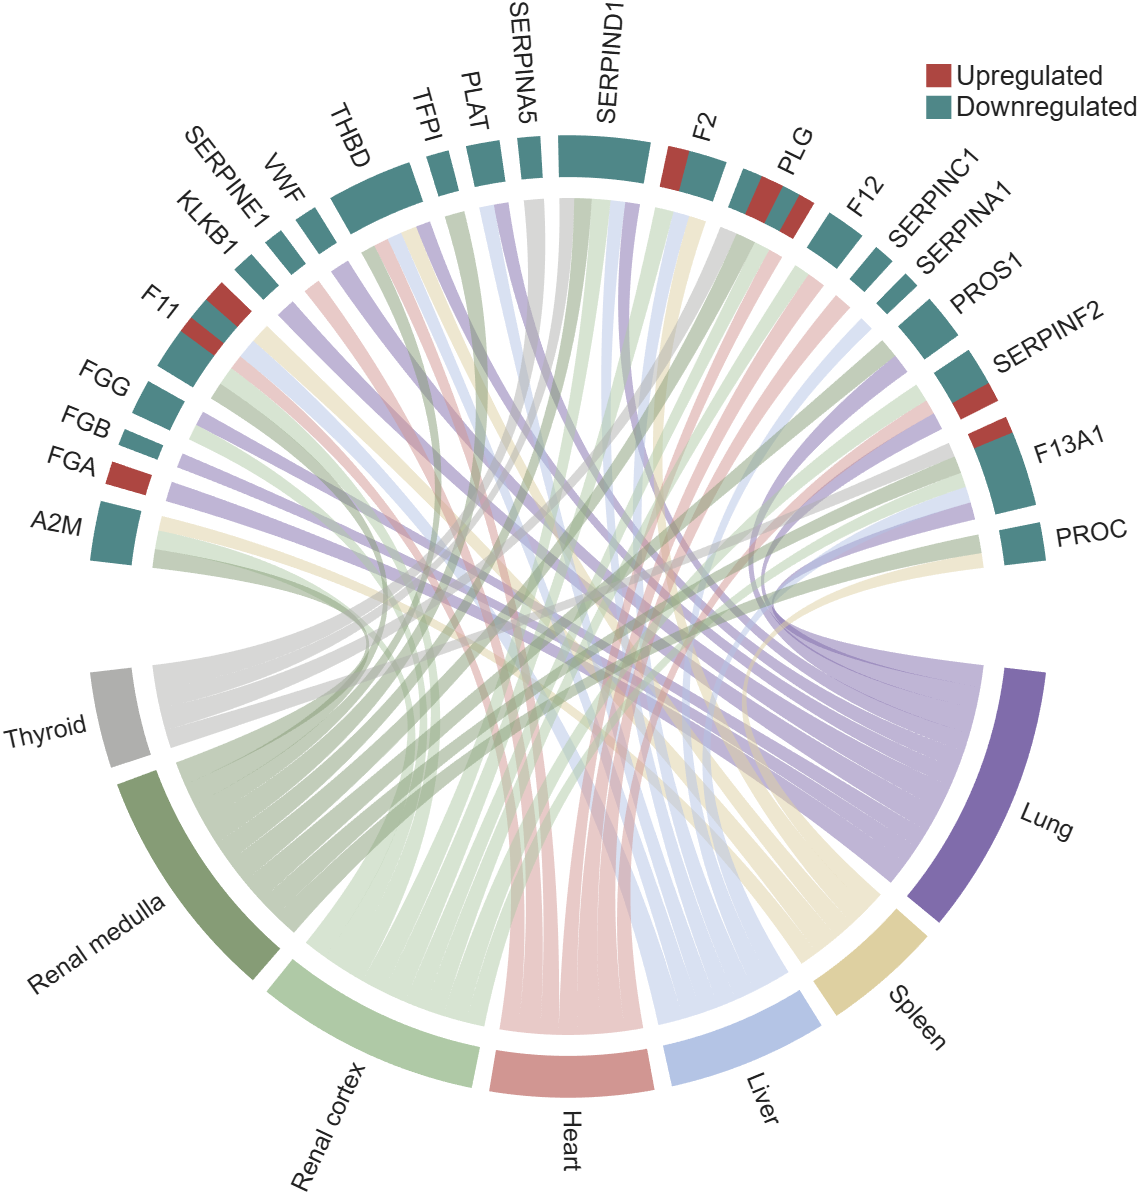
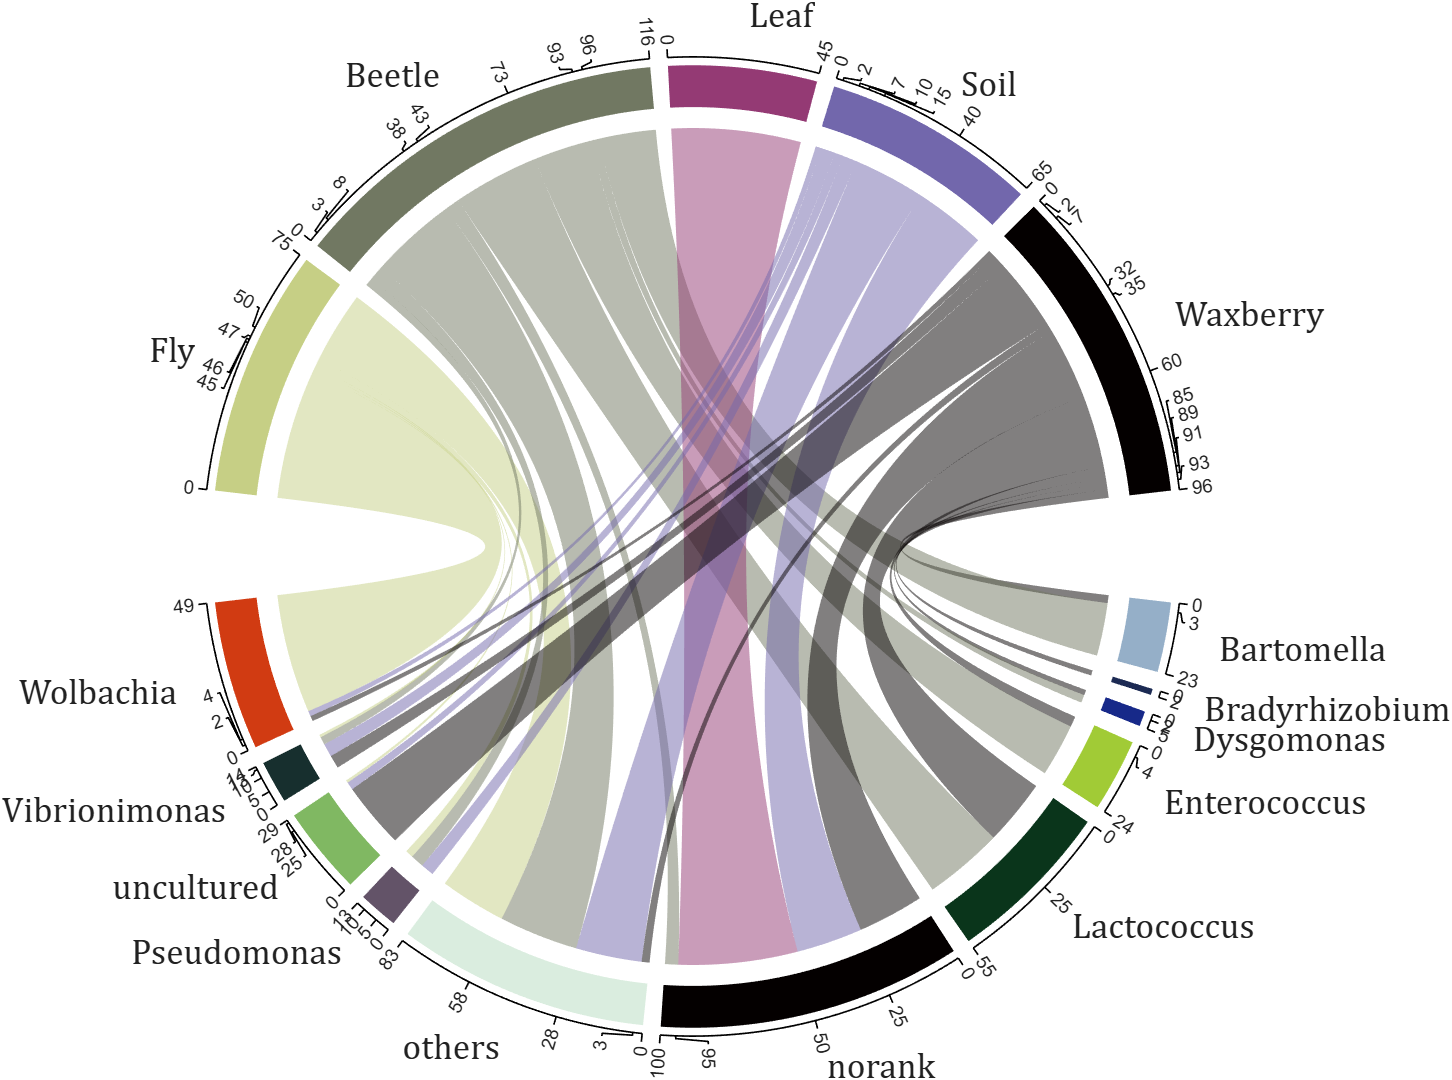
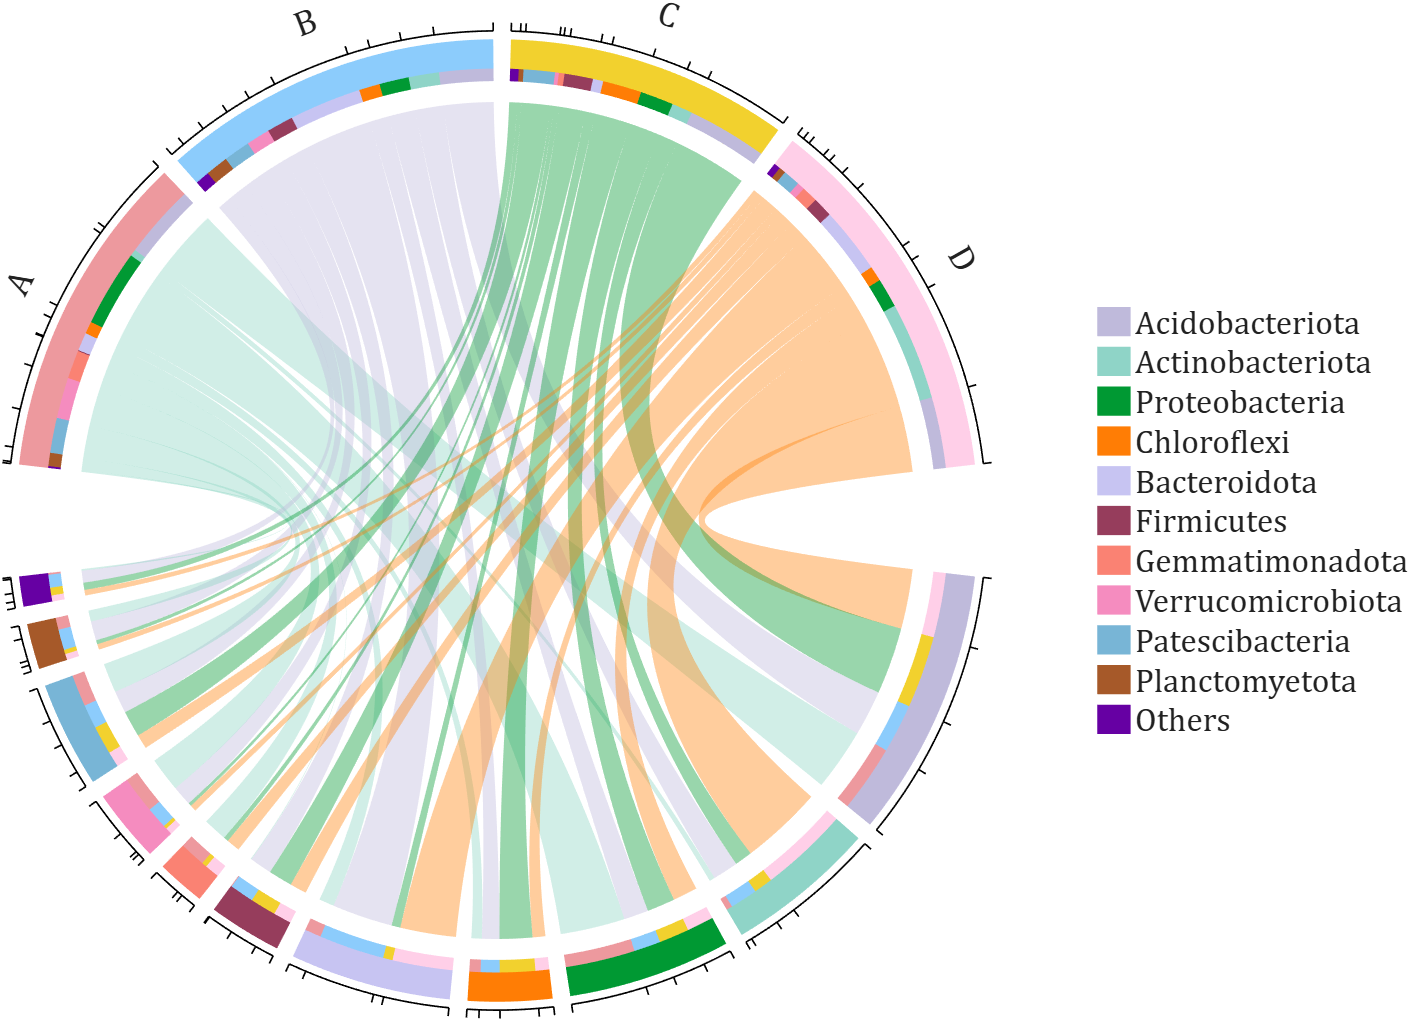
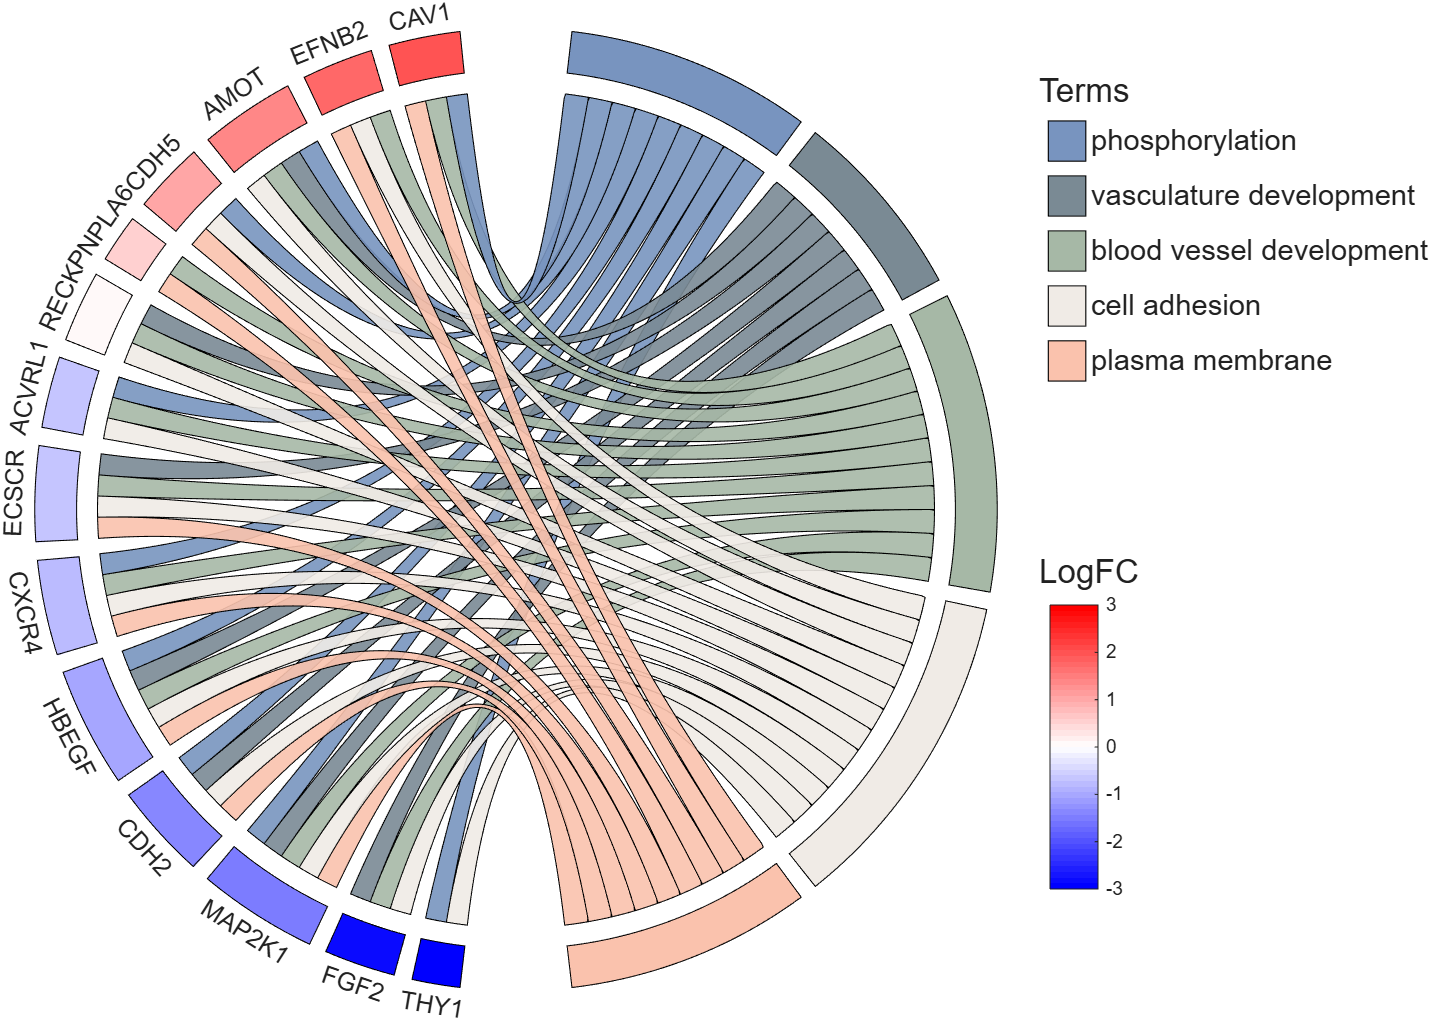
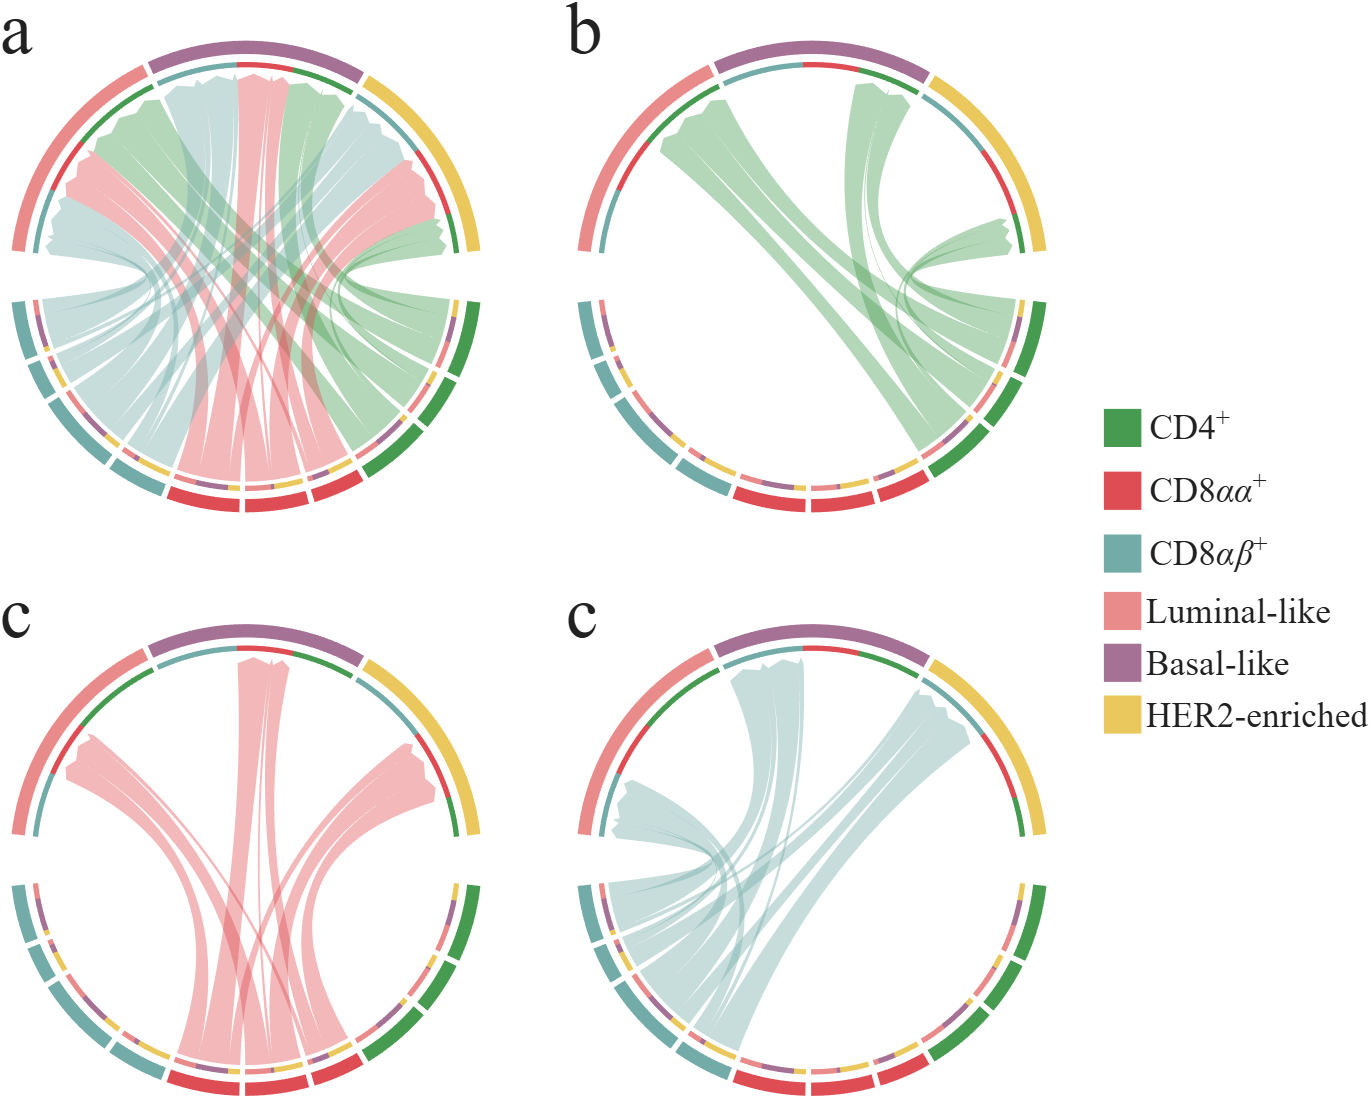
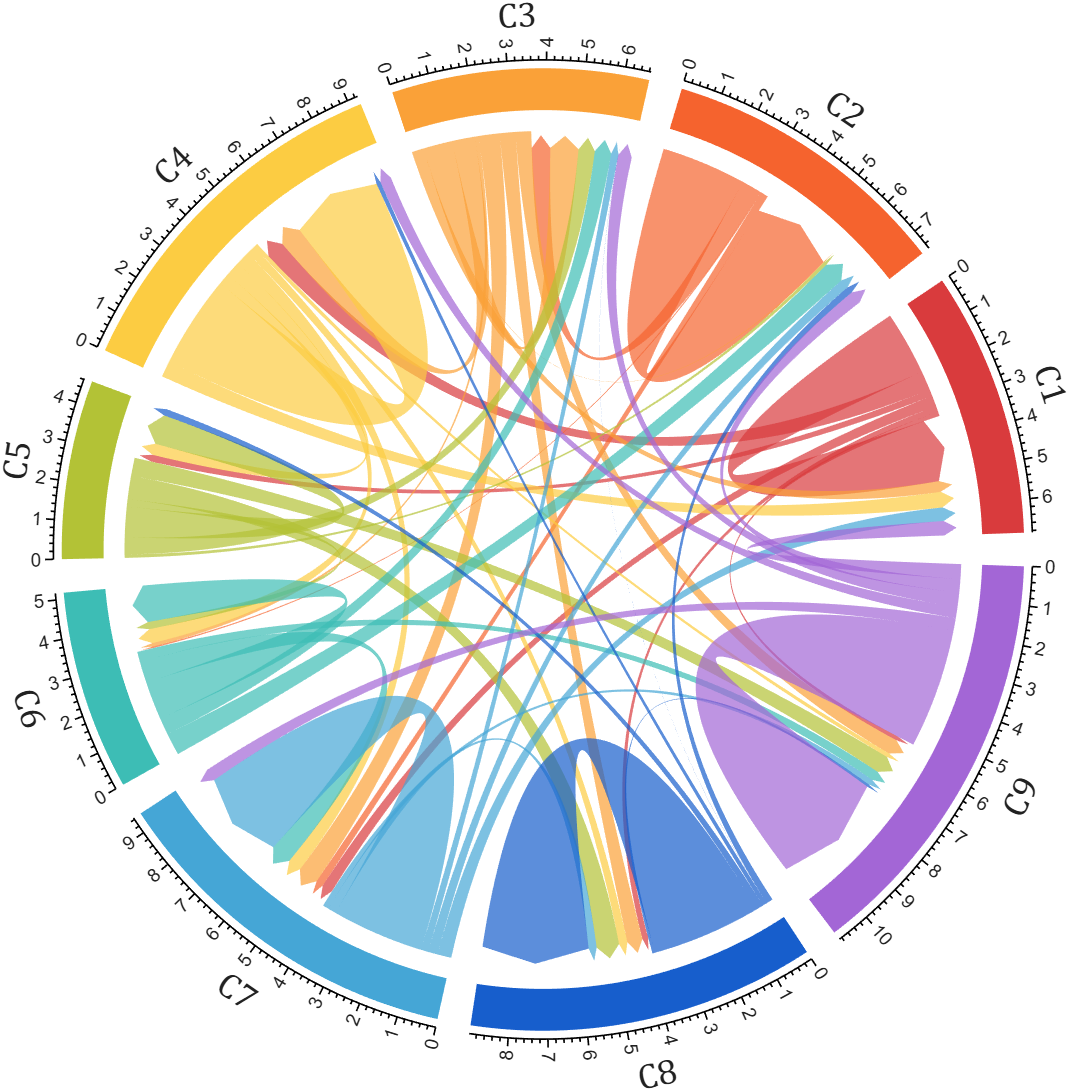
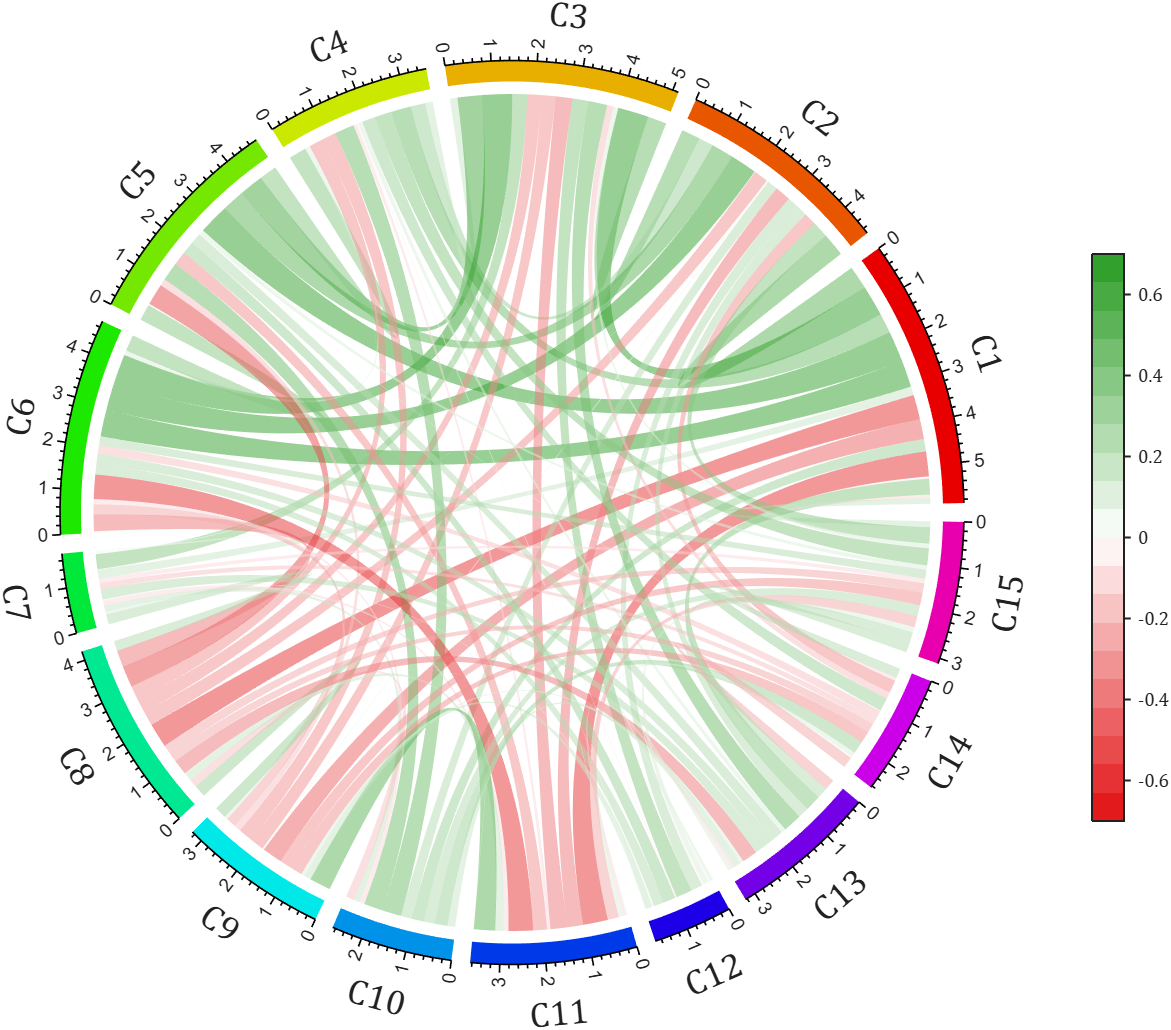
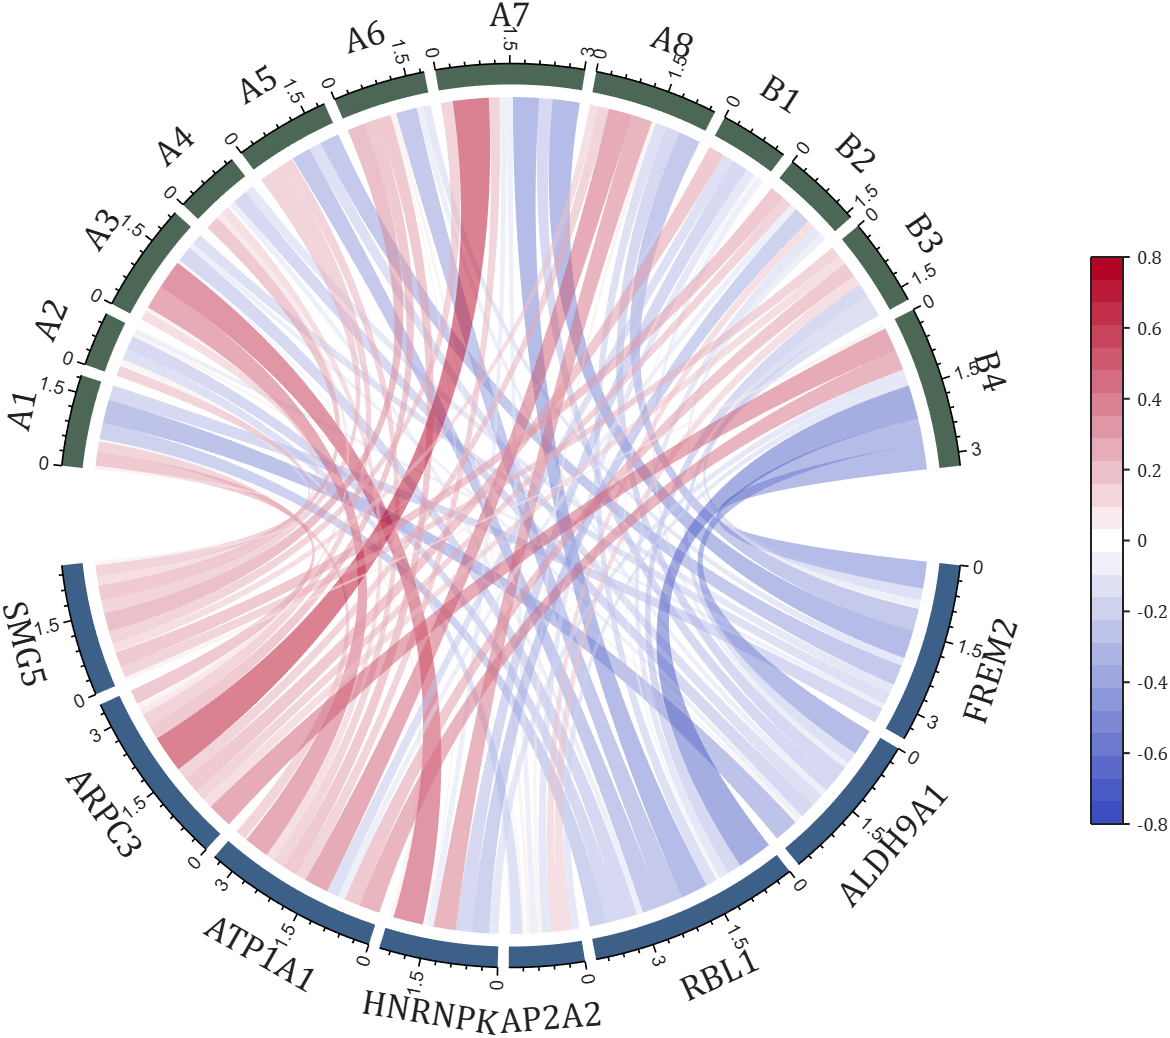
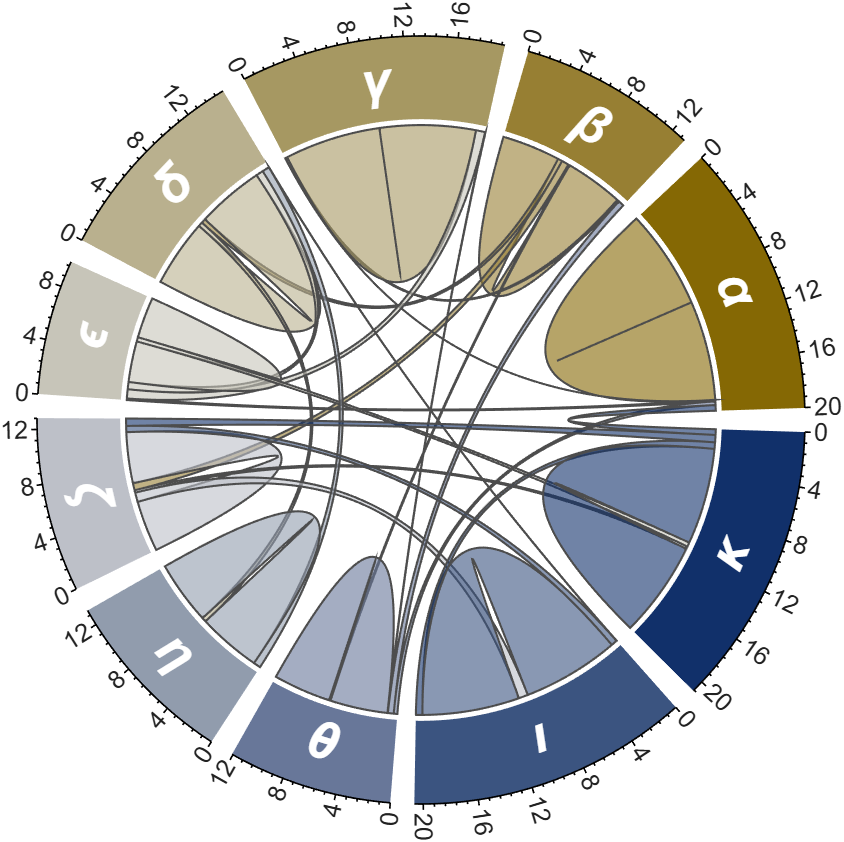
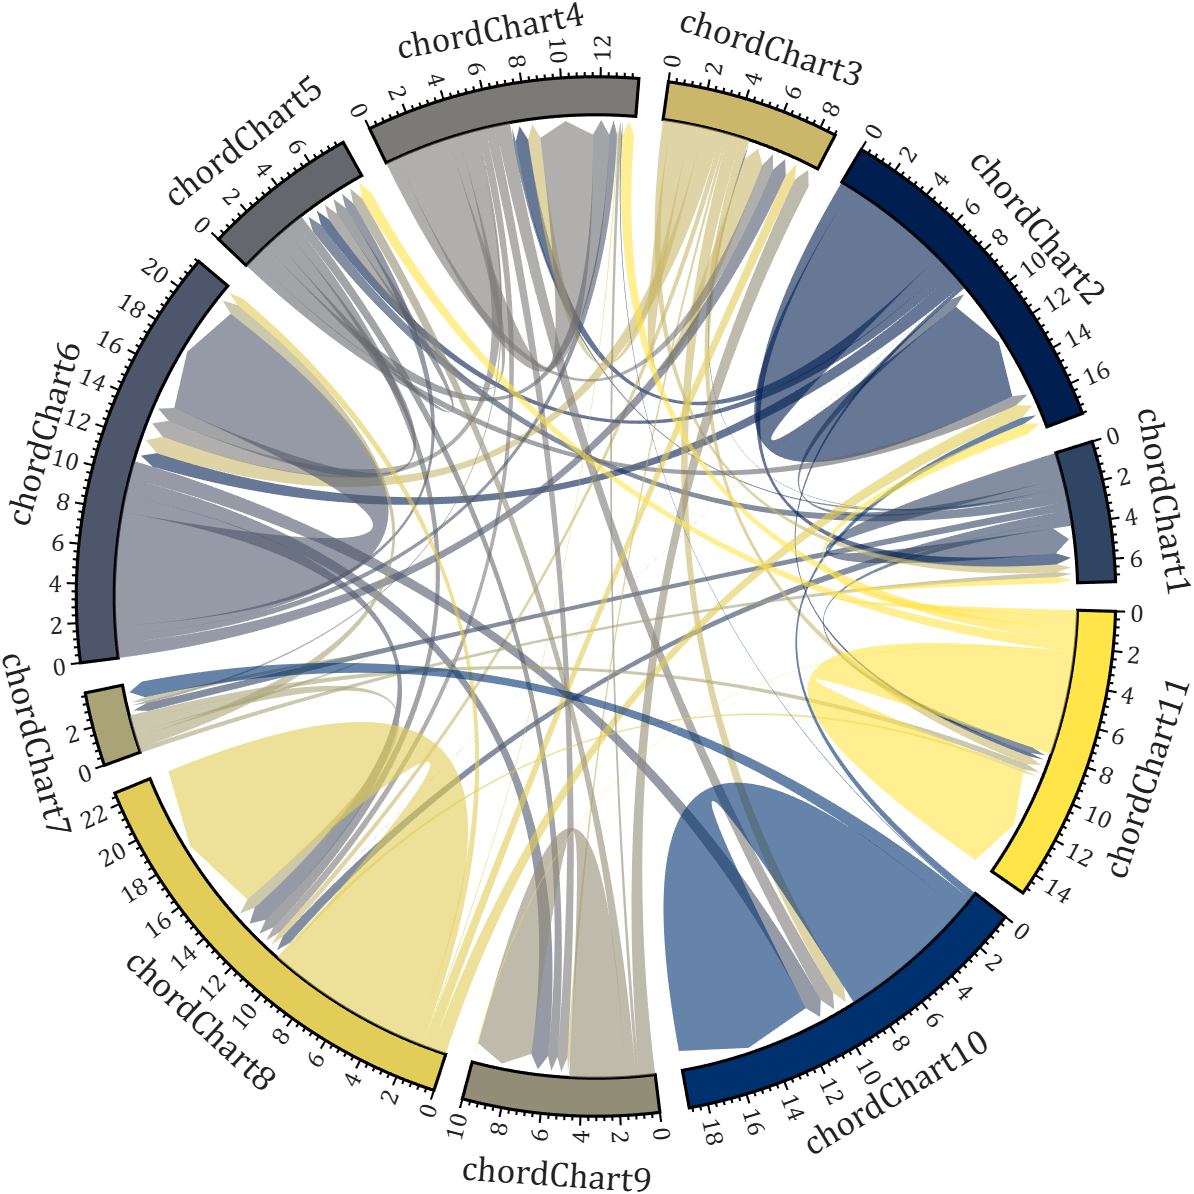
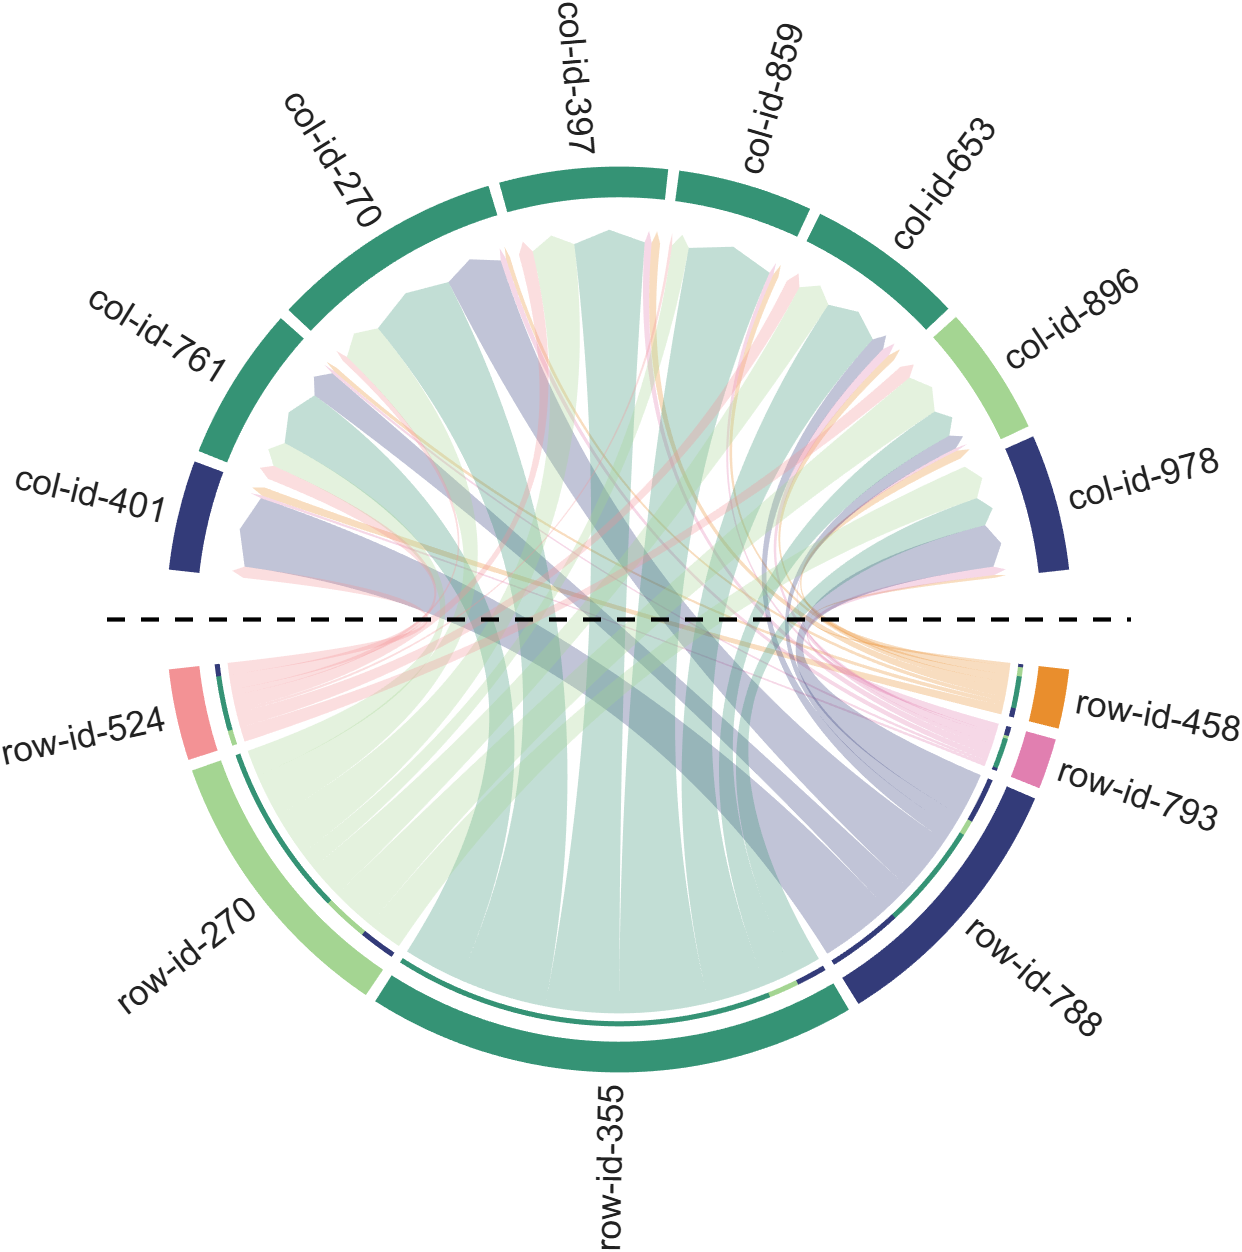
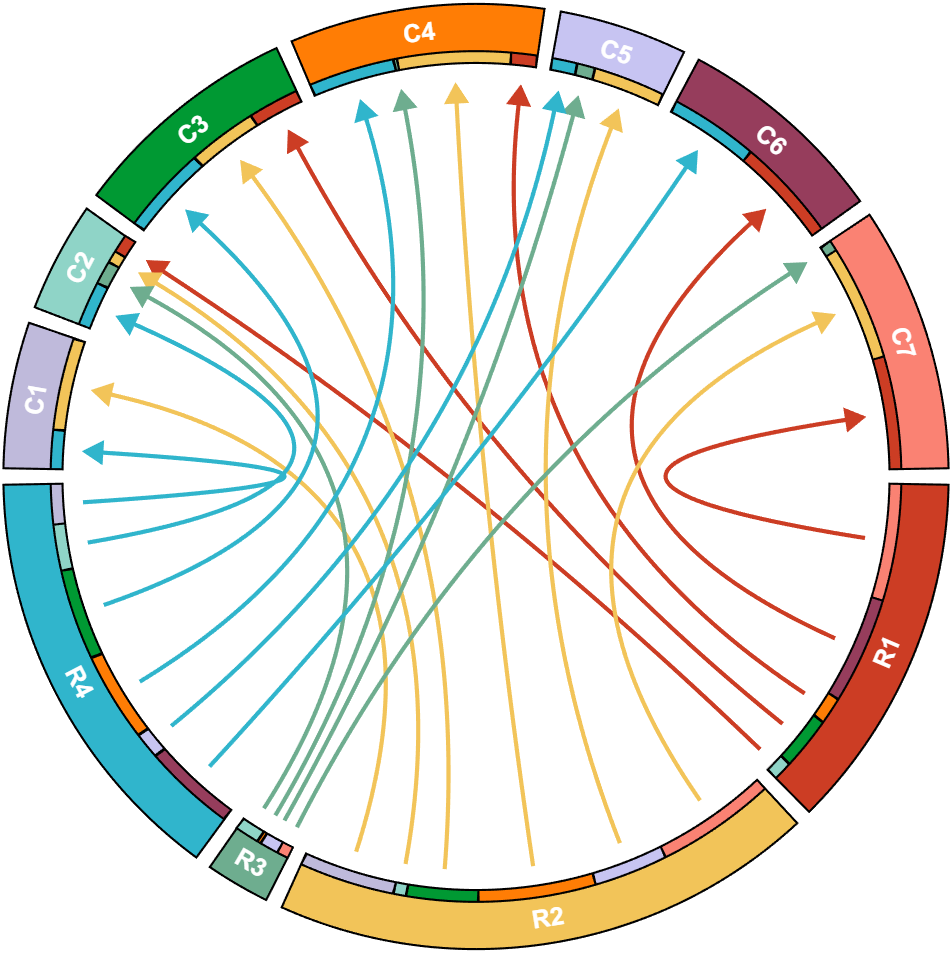
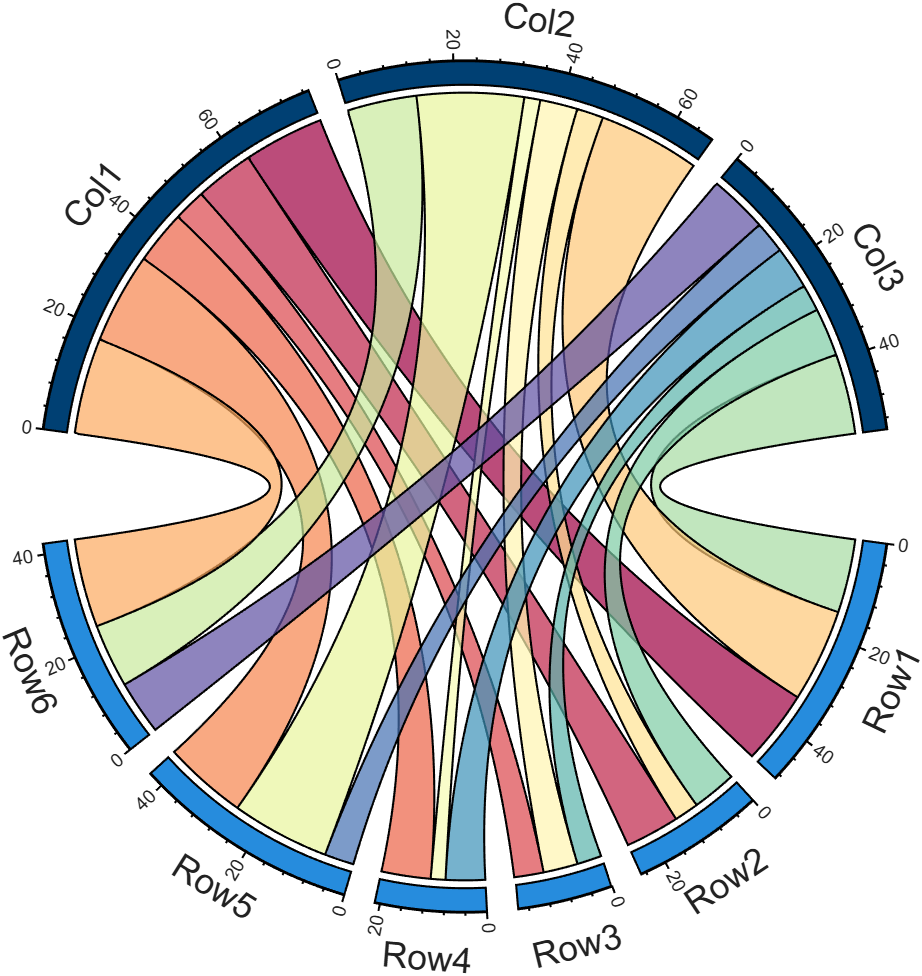
I developed two functions: one for plotting chord diagrams without self-loops, and the other for plotting chord diagrams with self-loops.
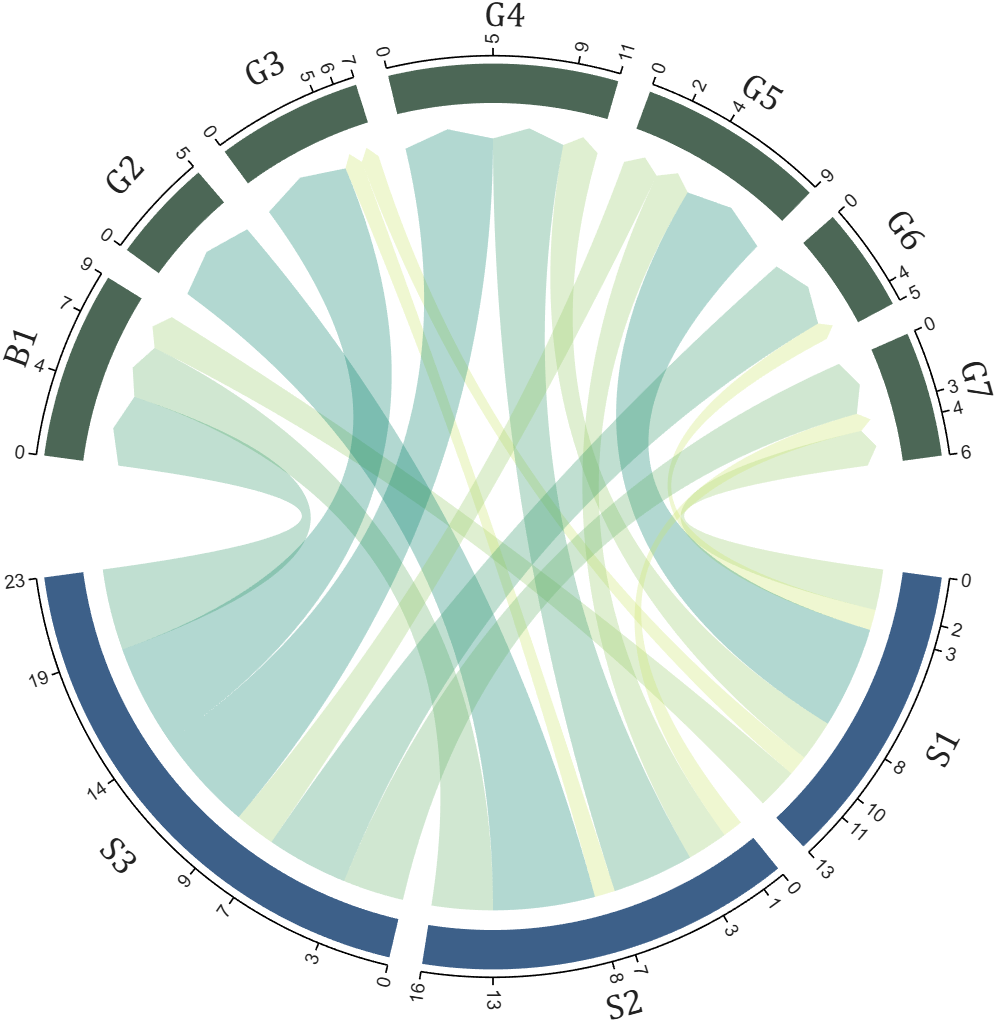
chordChart : basic usage
plotting chord diagrams without self-loops : https://www.mathworks.com/matlabcentral/fileexchange/116550-chordchart-chord-diagram
dataMat = [2 0 1 2 5 1 2;
3 5 1 4 2 0 1;
4 0 5 5 2 4 3];
colName = {'B1','G2','G3','G4','G5','G6','G7'};
rowName = {'S1','S2','S3'};
% Create and render chord diagram object (创建弦图对象并渲染)
CC = chordChart(dataMat, 'RowName',rowName, 'ColName',colName, 'Arrow','on');
CC.LinearMinorTick = 'on';
CC.draw();
% Set Font for labels and show ticks (调整字体并显示刻度)
CC.setFont('FontSize',17, 'FontName','Cambria')
CC.tickState('on')
CC.tickLabelState('on')
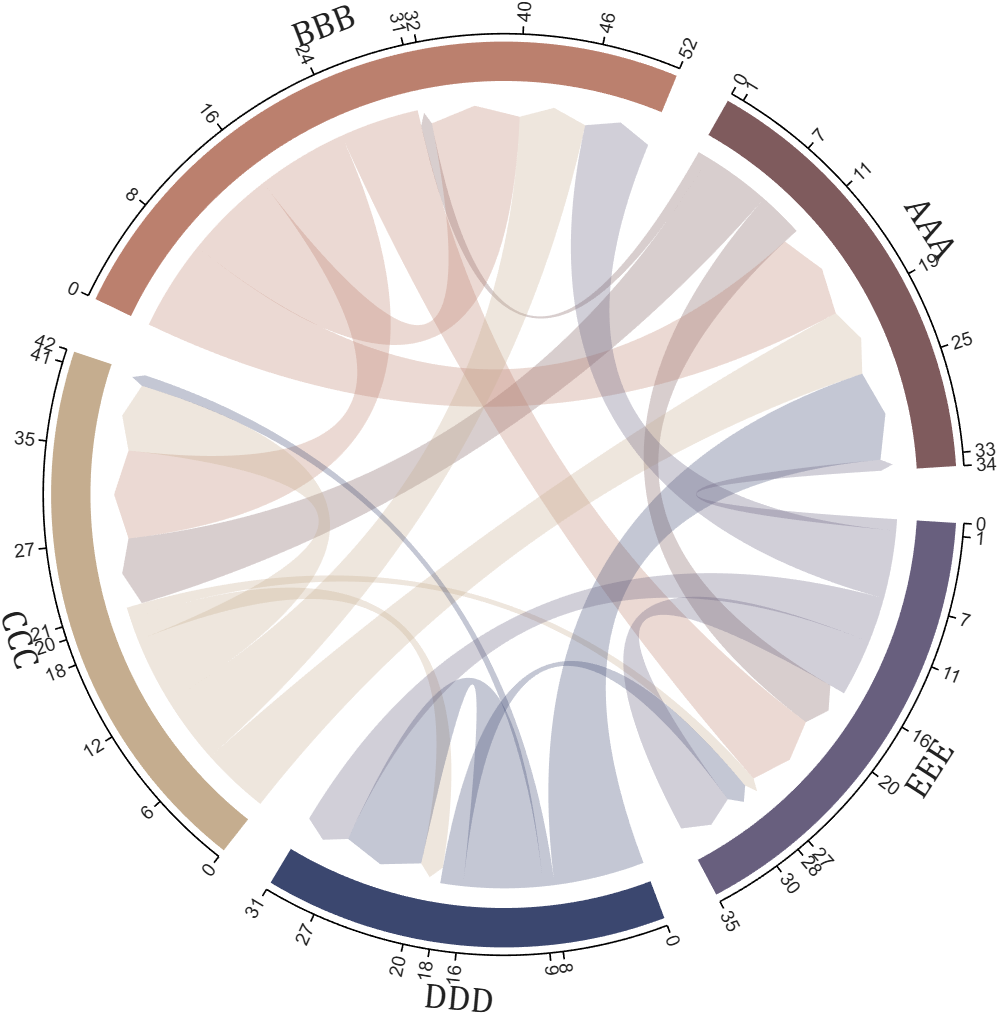
biChordChart : basic usage
plotting chord diagrams with self-loops : https://www.mathworks.com/matlabcentral/fileexchange/121043-bichordchart-bidirectional-chord-diagram
dataMat = randi([0,8], [5,5]);
nameList = {'AAA','BBB','CCC','DDD','EEE'};
% Create bichord chart object and draw (创建并绘制双向弦图对象)
BCC = biChordChart(dataMat, 'Arrow','on', 'Label',nameList);
BCC = BCC.draw();
% Show ticks and tick labels (添加刻度)
BCC.tickState('on')
BCC.tickLabelState('on')
% Set font properties (修改字体,字号及颜色)
BCC.setFont('FontName','Cambria','FontSize',17)
The two File Exchange submissions each provide more than a dozen basic examples. In addition, the GitHub repository listed below provides nearly 40 elaborate customized demonstration cases.

How does MATLAB ThingSpeak Work ?

Hallo zusammen,
Ich habe einen Frage zu meinen Programm. Dies will einfach nicht laufen und ich finde keinen Fehler mehr. Ich habe mein Programm bei Simulink geschriebenen den Code bei Maltab Function. Das Board ist ein Adruino Uni Board. Ein Ultrasonic Sensor soll die Füllstände ich Wäschekörben messen. Dabei wird unter voll oder halbvoll entschieden. Anschließend wird ein Motor angesprochen, der entweder 15 oder 30 Sekunden laufen soll. Überwacht wird der Motor von einem Thermistor (den habe ich hier PT100 genannt) und einen Vibrationsschalter. Dazu soll der Vibrationsschalter über einen Resetknopf zurückgesetzt werden. Ich hoffe ihr könnt mir weiterhelfen.
Vielen Dank:)
if true
% code
end

n= input('Escolhe um número inteiro postivo. ')
primo=true;
i=2;
while i<n
if mod(n,i)==0;
primo=false;
end
i= i+1;
end
if primo && n>1;
disp('É primo')
else
disp('Não é primo')
end
anterior= n-1;
while true
primo=true;
i=2;
while i< anterior
if mod(anterior,i)==0;
primo= false;
end
i= i+1;
end
if primo && anterior>1;
end
anterior= anterior-1;
end
disp(anterior)
seguinte= n+1;
while true;
primo= true;
i=2;
while i<seguinte;
if mod(seguinte,i)==0;
primo=false;
end
i=i+1;
end
if primo && seguinte>1;
end
seguinte= seguinte+1;
end
disp(seguinte)
Any ideas? It is in portuguese if you intend to translate it.
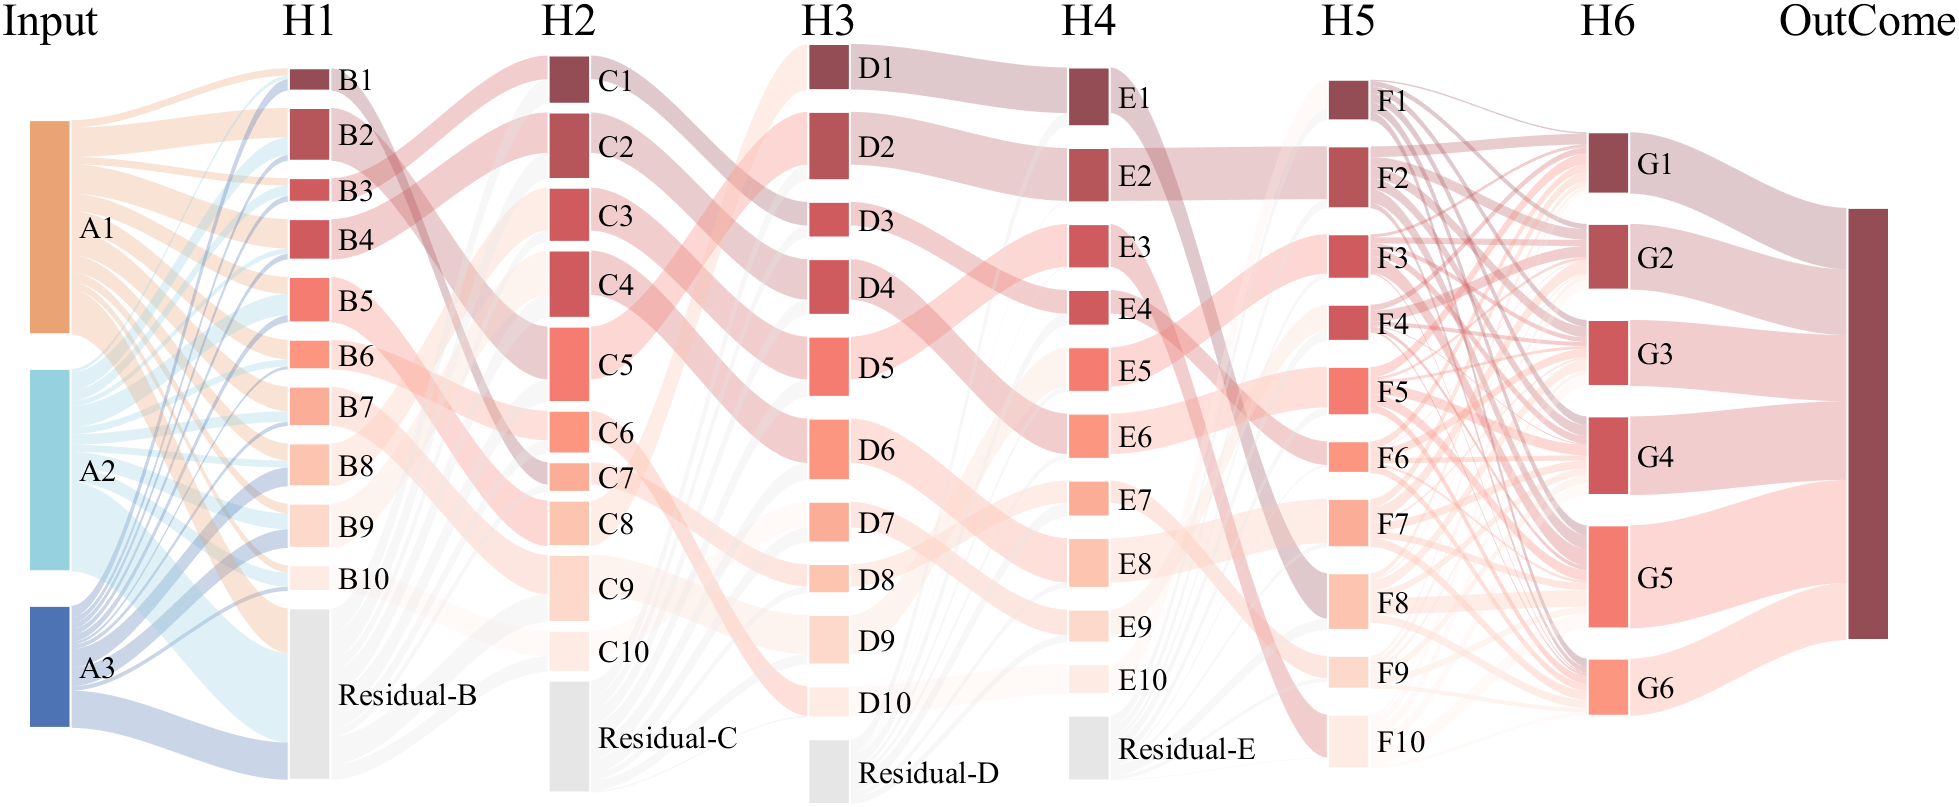
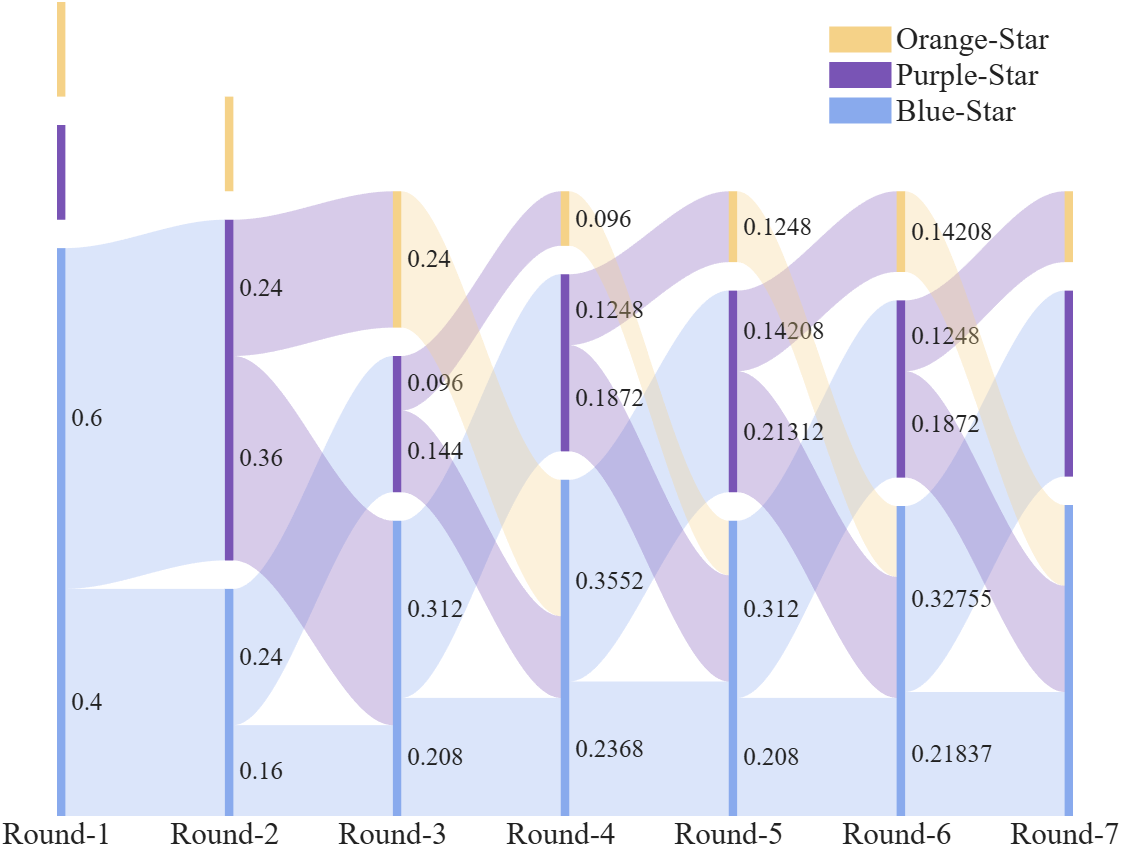
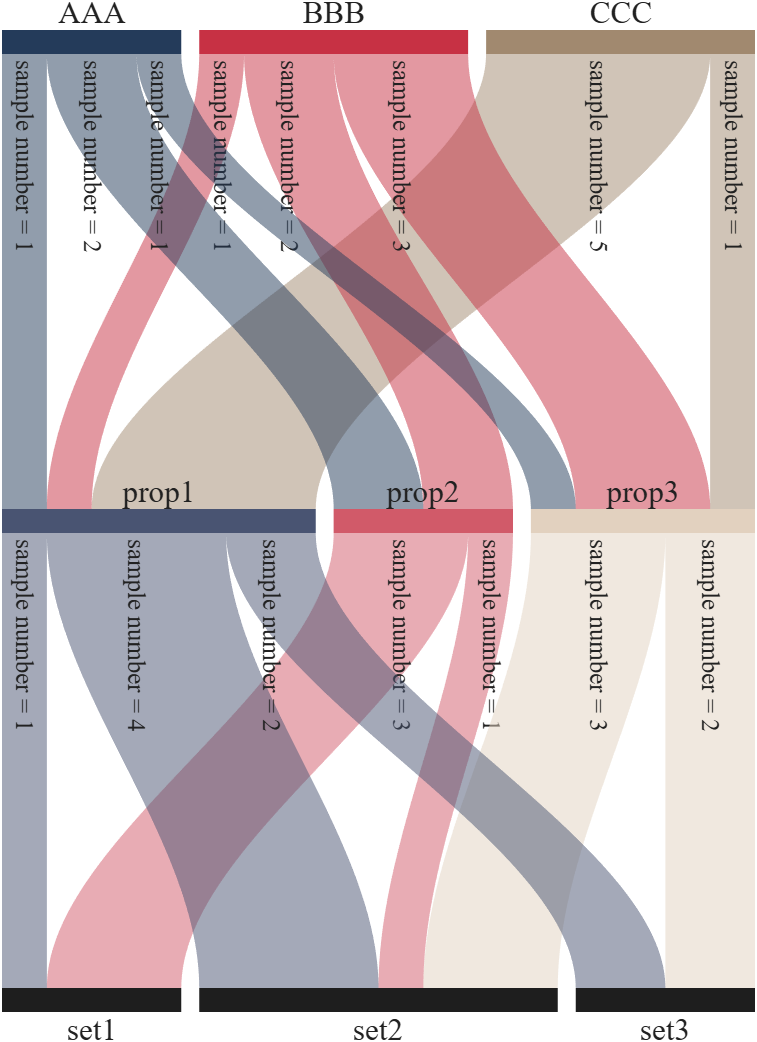
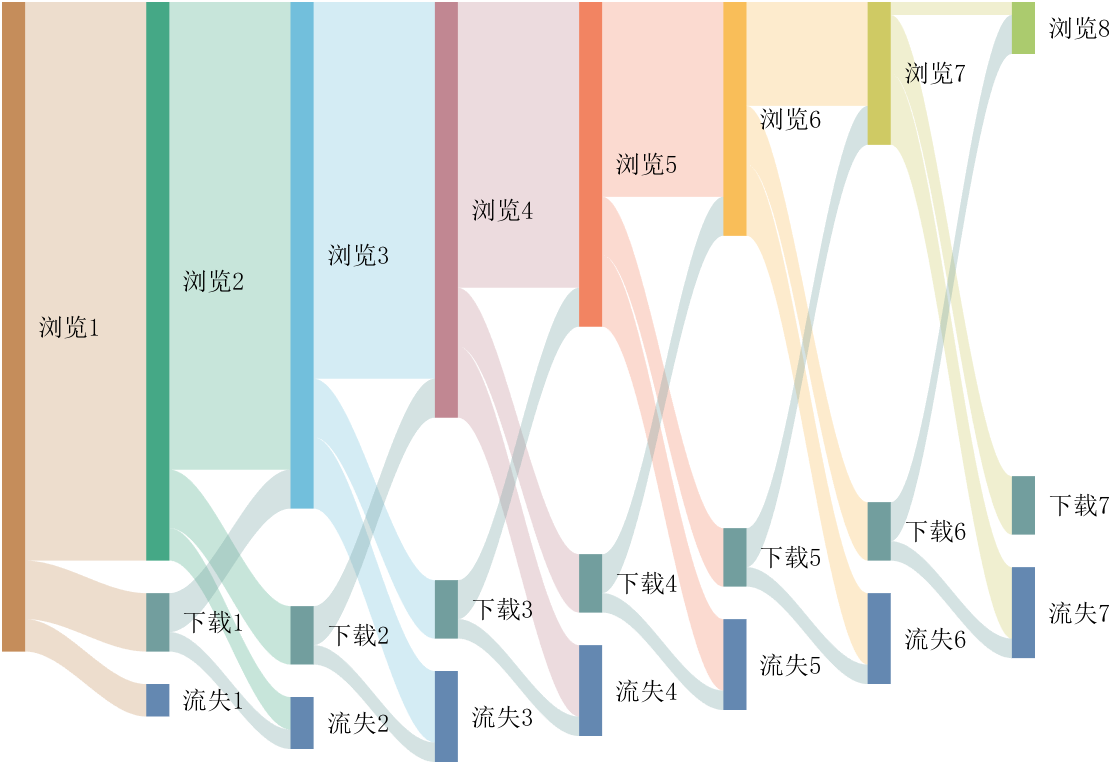
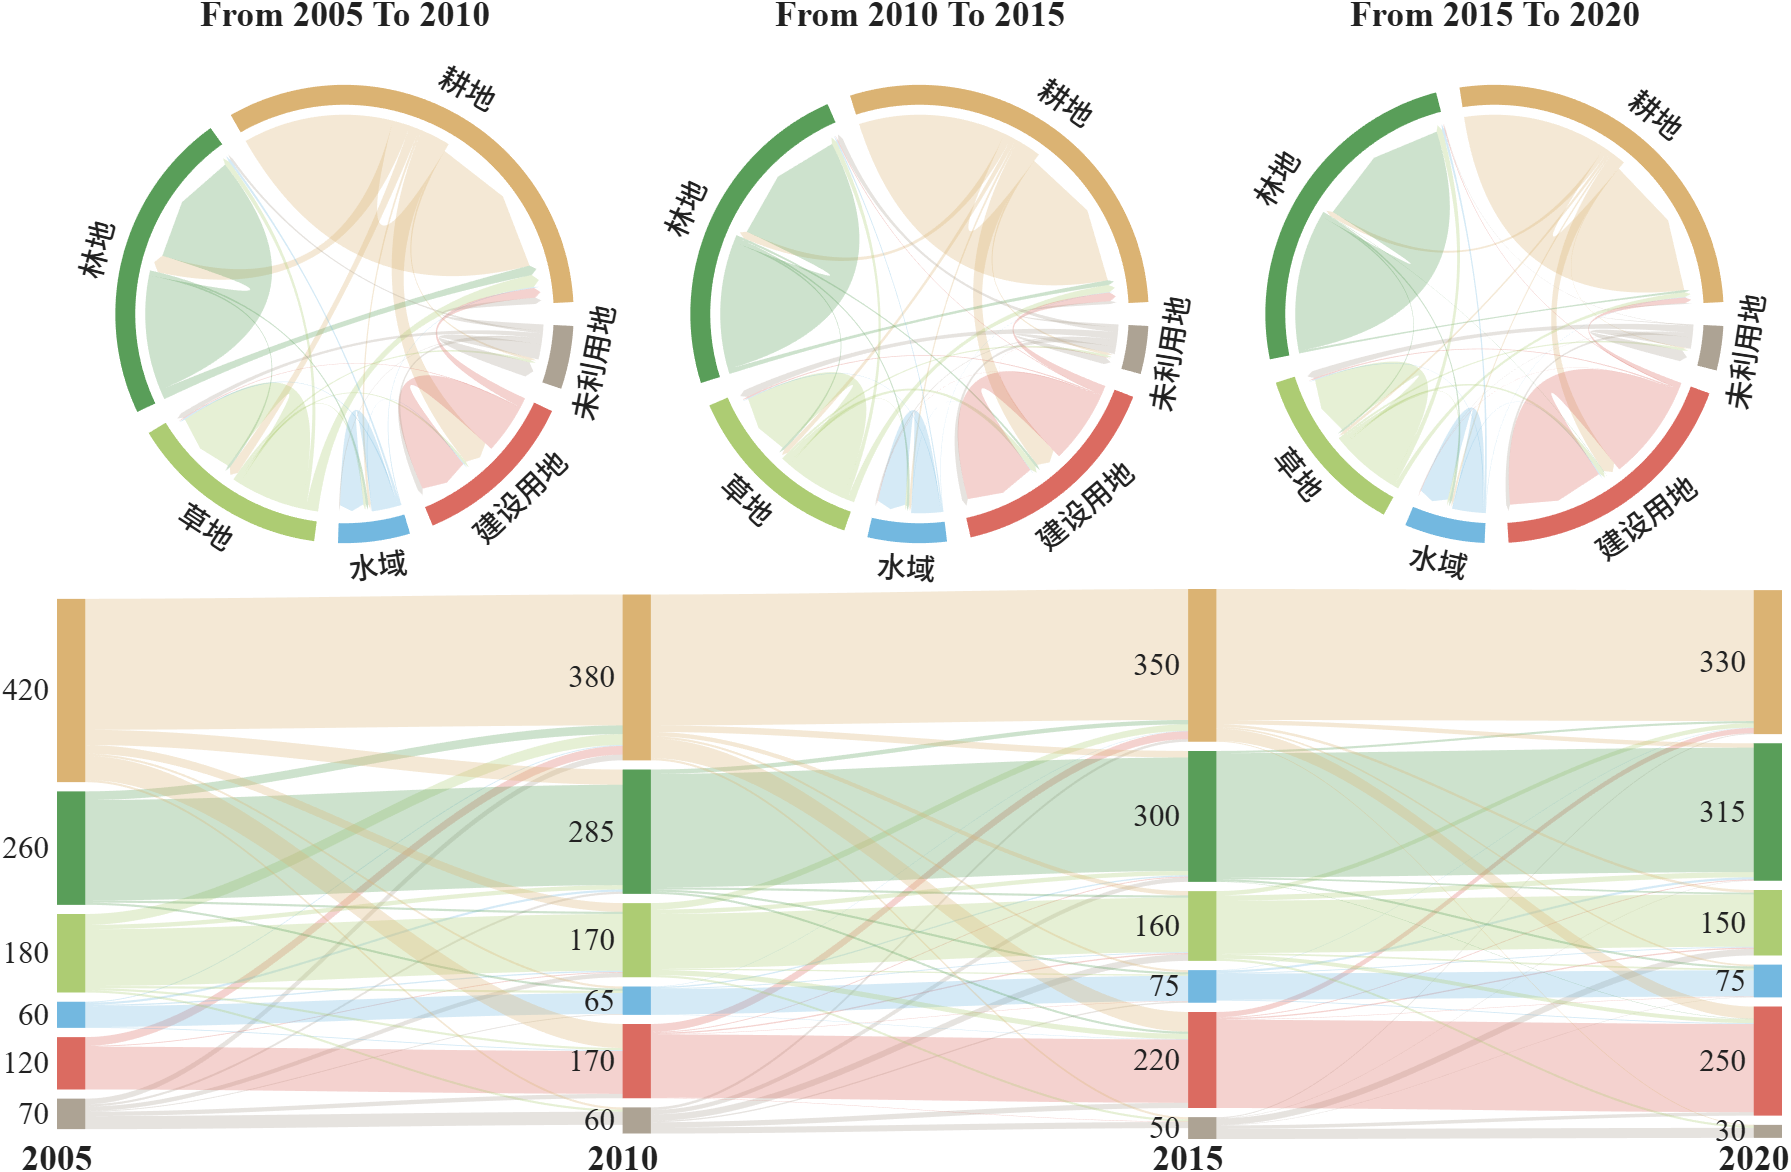
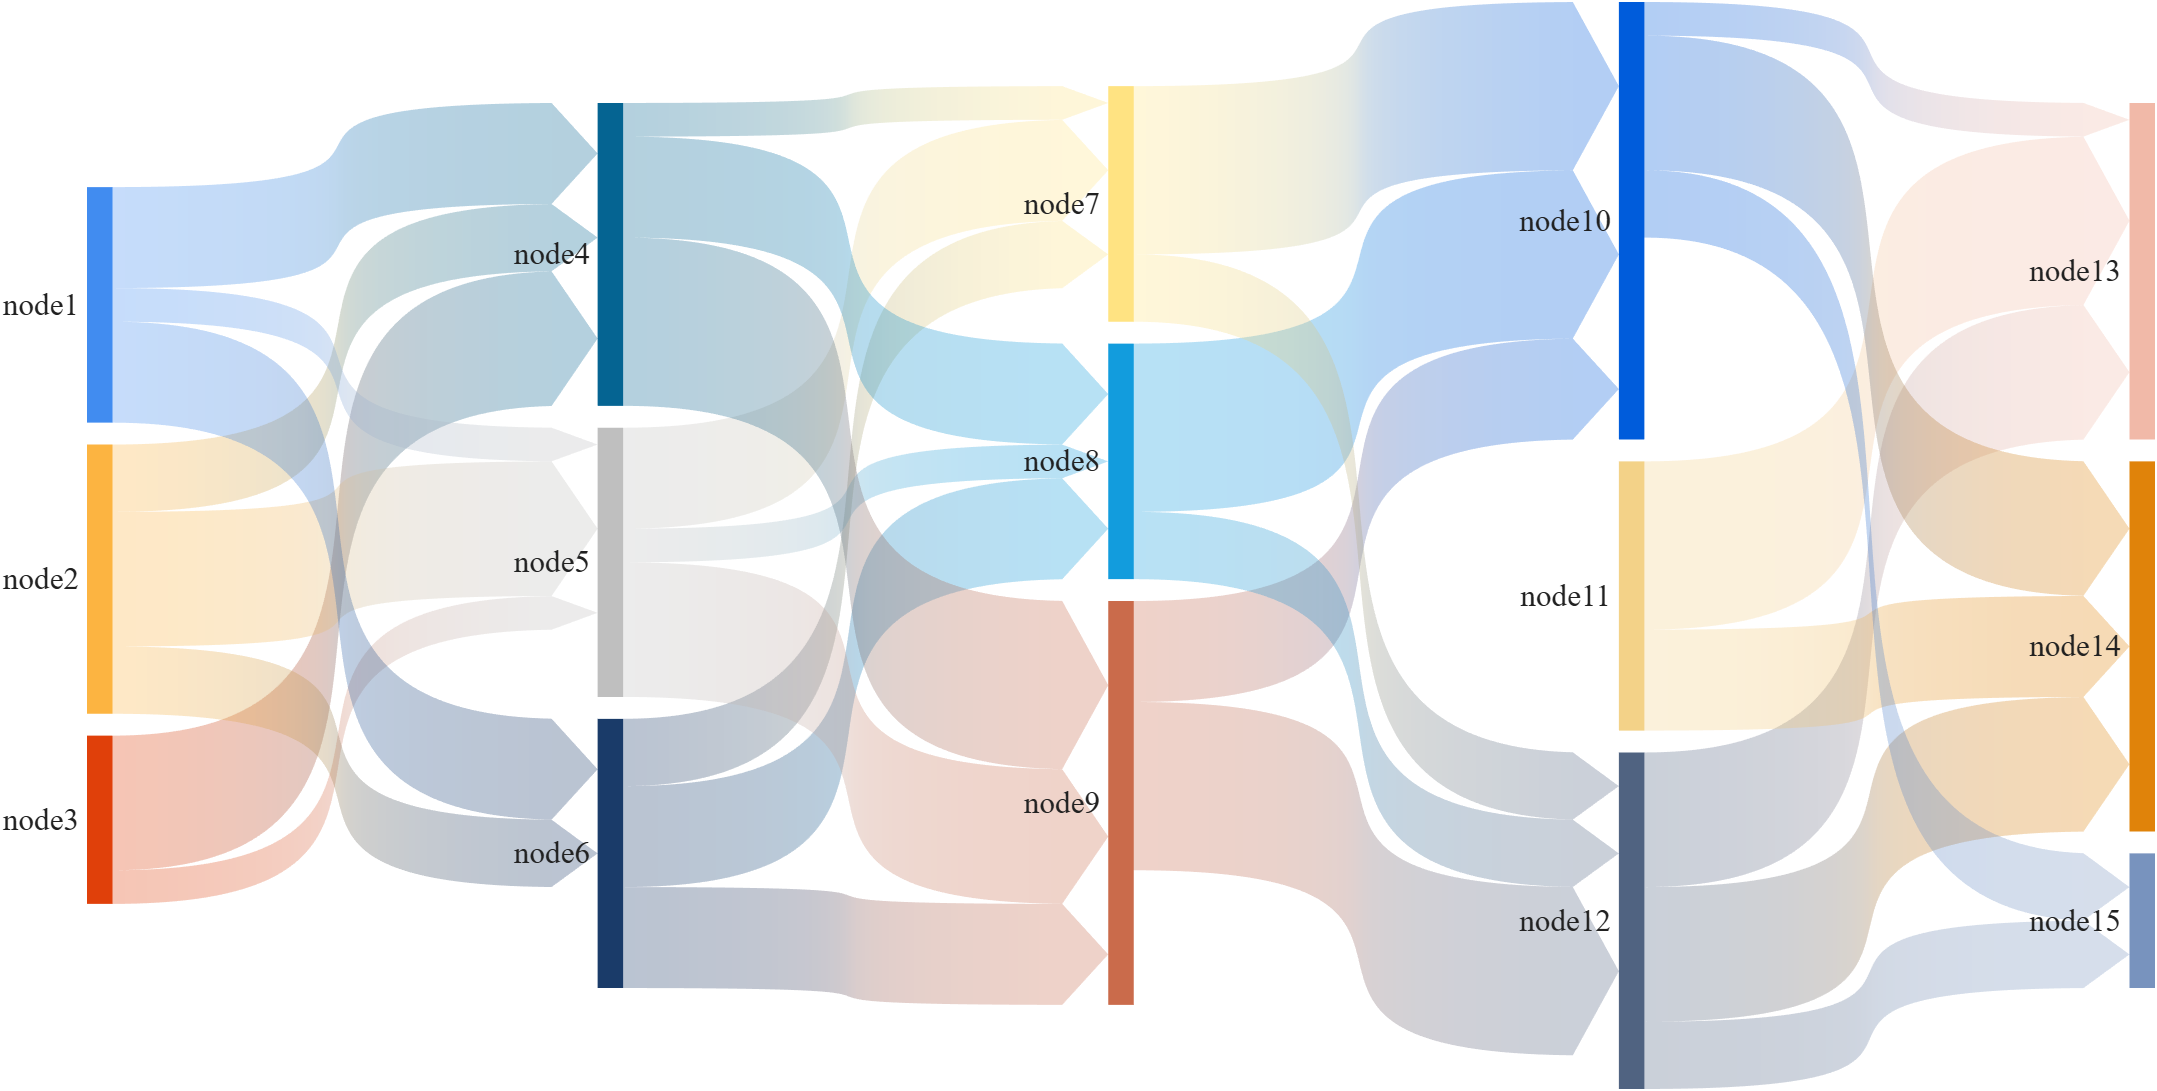
This is a brief introduction and recommendation of a Sankey diagram plotting tool:
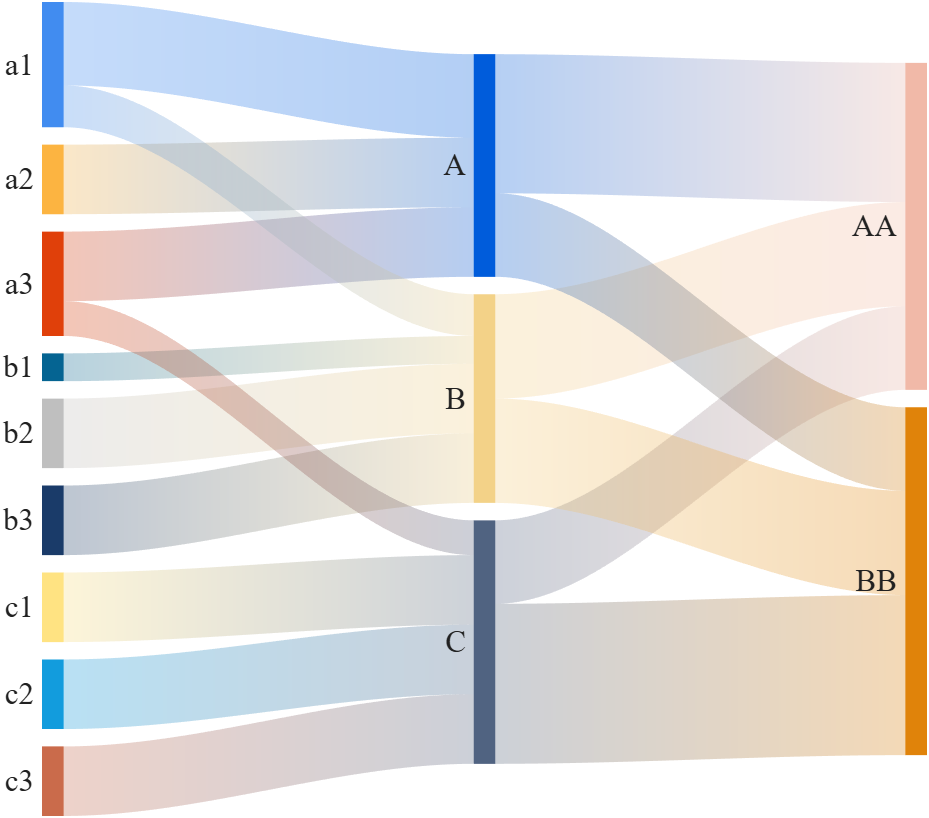
Basic usage - links
links={'a1','A',1.2;'a2','A',1;'a1','B',.6;'a3','A',1; 'a3','C',0.5;
'b1','B',.4; 'b2','B',1;'b3','B',1; 'c1','C',1;
'c2','C',1; 'c3','C',1;'A','AA',2; 'A','BB',1.2;
'B','BB',1.5; 'B','AA',1.5; 'C','BB',2.3; 'C','AA',1.2};
% 创建桑基图对象(Create a Sankey diagram object)
SK=SSankey(links(:,1),links(:,2),links(:,3));
% 开始绘图(Start drawing)
SK.draw()
Basic usage - adjMat
% Define inter-layer adjacency matrices
% 定义层间邻接矩阵
A12 = [1,2,1; 1,2,3; 2,0,1];
A23 = [1,4; 2,1; 0,3];
A34 = [1,5; 2,3];
% Assemble global block matrix (main diagonal = zero, super-diagonal = A12, A23, A34)
% 组装全局分块矩阵(主对角线为零,上对角线为 A12, A23, A34)
adjMat = mergeAdjMat({A12, A23, A34});
SK = SSankey([],[],[], 'AdjMat',adjMat);
SK.draw()
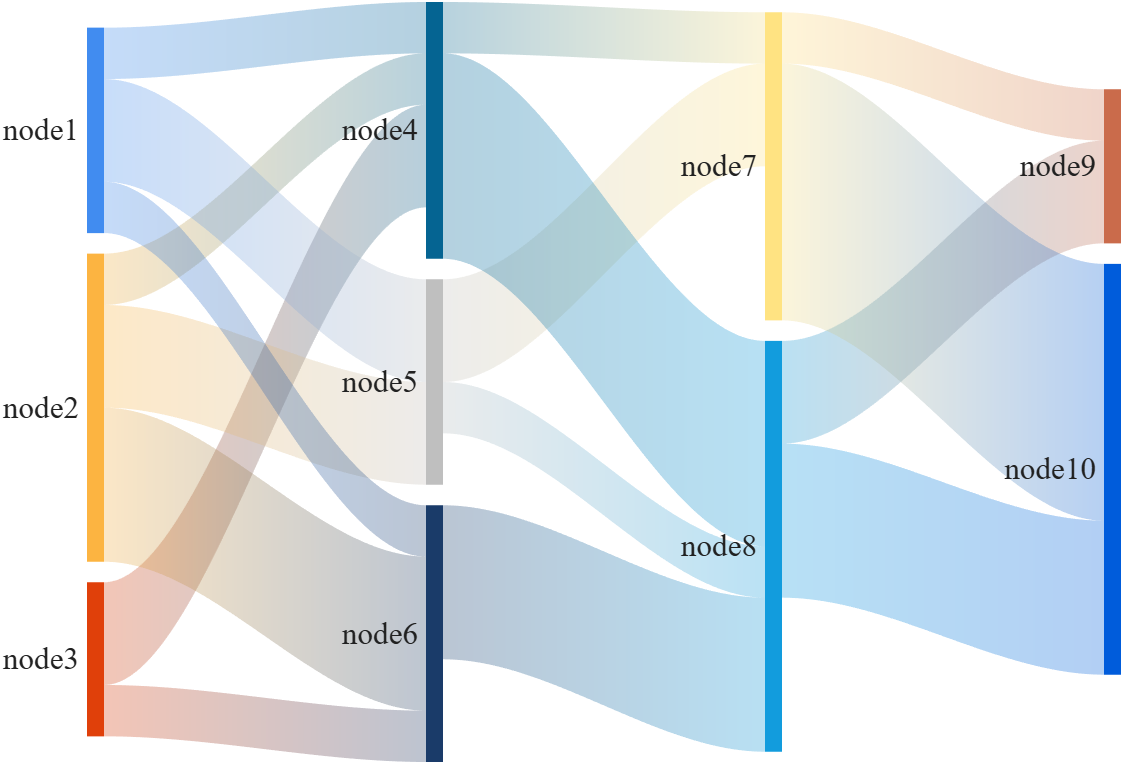
Further usage examples can be found in the demos included in the compressed package:

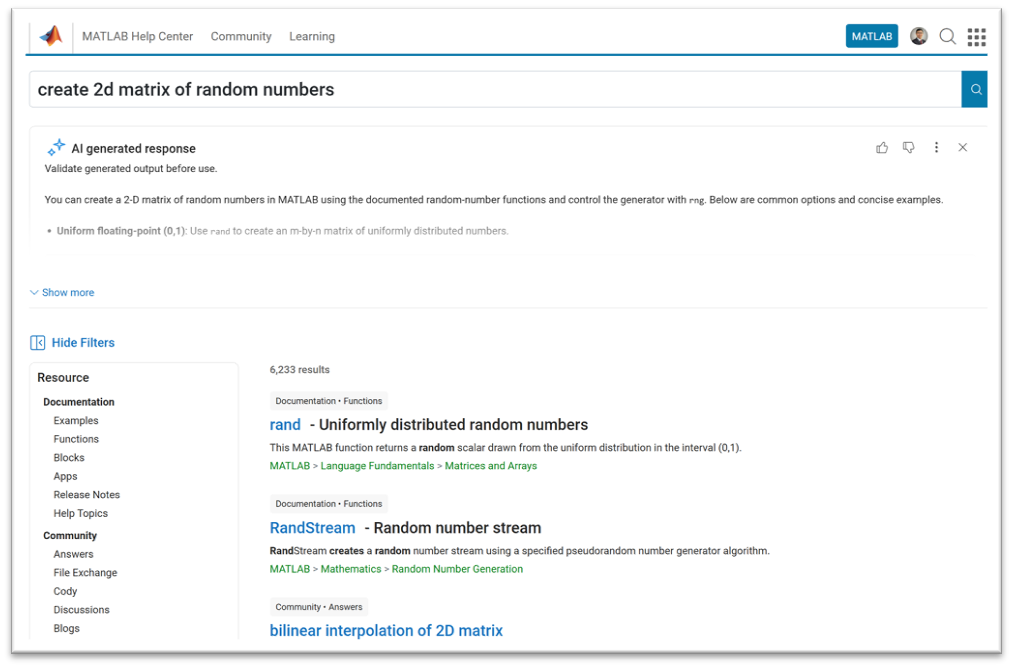
We’re excited to share that our new unified search experience is now live!
Anywhere you see the MATLAB Help Center | Community | Learning header, the search icon will now take you to the same results page. This makes it much easier to find content across different areas in one place—and you’ll also see an AI-powered response at the top to help you get quick answers.
A quick note: search from the homepage, product pages, solutions, and a few other areas will continue to work as they do today.
This update is all about making it easier to discover related content across the site, instead of being limited to one area at a time.
Give it a try and let us know what you think—we’d love your feedback!

I've been confused trying to write (or have an AI write) the .m (Live) text format from scratch for various reasons using .mlx format exported with the IDE as .m (old) and .m (LIve). Of course, one problem is the .m and .m (Live) files have the same name,causing confusion and requiring renaming, but repeatedly, after sussing out and following all conventions for headings and latex etc in .m (LIve), my .m (Live) files would not open as .mlx in the IDE. I think I've found the answer by trial and error and comparison and don't know it is documented. Add at the end
%[appendix]{"version":"1.0"} %--- %[metadata:view] % data: {"layout":"inline"} %---
This seems to trigger the IDE to recognize this is a .m (Live). Woohoo! This is a LOT easier than writing .mlx zip packages from scratch.

Have there been some changes made to the ThinkSpeak graphs? I am unable to change the number of days displayed, nor the number of data points to display. I did have them display 5 days, but now they are showing 14 days even though the setting is 5. I tried logging out and back in, but to no avail. Thanks.

talks about how GeForce has become deprioritized by Nvidia, and
The chatter from the grapevine is that we won't see any new GPUs from Nvidia this
year at all — not one — and that's very rare (in fact it hasn't happened in three
decades). This is because Nvidia needs all the chips it can get — and perhaps more
to the point, all the video RAM — for AI graphics cards which are far more
profitable than consumer models.
Soon, Mathworks will be facing a choice: continue to support only expensive Nvidia AI offerings -- or diversify to support alternative GPUs as well.
By the way: Nvidia AI units cost $US7.8 million dollars. https://www.tomshardware.com/tech-industry/artificial-intelligence/nvidias-memory-costs-soar-485-percent-latest-ai-systems-now-cost-usd7-8-million-to-build-memory-now-comprises-25-percent-of-the-total-cost-rubin-gpus-a-mere-usd50-000-apiece
Which alternative GPUs would you most like to see supported?
- Unfortunately, I hear that Apple provides poor support for information on really using their "silicon" GPUs in any way other than Apple's pre-packaged computation libraries. The Apple attitude is apparently that anything that is not already nailed down by documentation is fair game for changing in the future, and that documenting how the GPUs really work would constitute nailing them down, supposedly "destroying" Apple's creativity. Exception: Apple is known to work with major gaming studios (but only the major ones.)
- The Apple silicon series of GPU does not provide any 64 bit operations, so 64 bit support would require emulating 64 bits in software. Nvidia is famous for internally implementing 64 bit support in terms of 32 bit operations, at 1:32 of the speed -- but on the other hand select Nvidia devices operate 64 bit operations at 1:24 or even 1:8 (a small number of devices) through hardware acceleration units. People who need 64 bit operations have the option of shopping very carefully in Nvidia's line to get faster 64 bit processing.
- OpenCL sounds cool and "open". Unfortunately it turns out that a lot of OpenCL operations are optional, so efficient OpenCL libraries would need to be tuned to the exact hardware series.
- OpenCL is not supported on semi-recent MacOS Intel or Apple Silicon series
- I seem to recall hearing that OpenCL is no longer supported by Nvidia either

I am a bit neurotic about getting things "just right" and I would really like the ability to resize panels on the desktop to predefined default configurations. I know that I can set up the panels by hand and save them, but I'd like to be able to automatically set a 3 column layout to 25%-50%-25% or perhaps 33%-34%-33% This would be somewhat like the snap feature in windows shown here: https://support.microsoft.com/en-us/windows/snap-your-windows-885a9b1e-a983-a3b1-16cd-c531795e6241. This wouldn't have to preclude setting them by hand but it would offer an automated alternative.
If this feature already exists, perhaps someone can point me to it.

Have been using Thingspeak for a few years, suddenly I get this message relating to one of my Matlab analysis scripts, which has run for years:
Error Message:
Unrecognized function or variable 'cusum'. cusum requires Signal Processing Toolbox.
What has changed to cause this error - I've done nothing!
We’re excited to share that Cleve Moler, creator of MATLAB, has been elected to the U.S. National Academy of Sciences—one of the highest honors in science.
This recognition celebrates Cleve’s groundbreaking contributions to numerical computing and his lasting impact on researchers, educators, and engineers around the world. From advancing numerical linear algebra to making powerful computation more accessible through MATLAB, his work has shaped how science and engineering are done today.
Please join us in congratulating Cleve on this well‑deserved honor!
🔗 Learn more about the 2026 NAS election

Hi,
I am trying to use an esp32 board with quectal ec200u LTE Modem to send sensor data to thingspeak. The board can process the sensor data however I am unable to send the data to thingspeak. I have used the same process earlier too however with a different modem from Simcom.
Can someone help me with specific commands for achieving this? I can share the code which i am trying to use.
Regards
Aditya

Good morning everyone. I’m having a problem with ThingSpeak. I’m sending data from an ESP LoRa with the RTC set to the Brasília time zone (GMT-3).
Previously, when I exported the data to CSV, it used the ThingSpeak time, which appeared 3 hours ahead. Now that I’m sending the timestamp from the ESP, the graphs are showing the data 3 hours behind. Is there a way to align the graph times while keeping the Brazilian time zone?

I have been a loyal MATLAB user for 25 years, starting from my university days. While many of my peers migrated to Python, I stayed for the stability, compatibility, and clean environment. However, I am finding the 2025 version exceptionally laggy. Despite running it on an $10k high-end machine, simple tasks like viewing variables and plotting take up to 60 seconds - actions that were near instantaneous in the 2020 version. I want to stay continue with MATLAB, but this performance gap is a major hurdle and irritation. I hope these optimization issues can be addressed quickly.
Hello Community,
Registration is now open for the MathWorks Automotive Conference 2026 North America. Join industry leaders and MathWorks experts to learn about the latest trends in:
- Software-defined vehicles
- Generative AI
- Virtual vehicles
- AI and machine learning
Event details
- Date: April 28, 2026
- Location: Saint John’s Resort, Plymouth, MI
This conference is a great opportunity to connect with MathWorks and industry peers—and to explore what’s next in automotive engineering. We encourage you to register today.
We hope to see you there.
PLEASE, PLEASE, PLEASE... make MATLAB Copilot available as an option with a home license.
Please change the documentation window (https://www.mathworks.com/help/index.html) so I don't have to first click a magnifying glass before I can to get to a text field to enter my search term.

Have you ever wondered what it takes to send live audio from one computer to another? While we use apps like Discord and Zoom every day, the core technology behind real-time voice communication is a fascinating blend of audio processing and networking. Building a simple walkie-talkie is a perfect project for demystifying these concepts, and you can do it all within the powerful environment of MATLAB.
This article will guide you through creating a functional, real-time, push-to-talk walkie-talkie. We won't be building a replacement for a commercial radio, but we will create a powerful educational tool that demonstrates the fundamentals of digital signal processing and network communication.
The Purpose: Why Build This?
The goal isn't just to talk to a colleague across the office; it's to learn by doing. By building this project, you will:
Understand Audio I/O: Learn how MATLAB interacts with your computer’s microphone and speakers.
Grasp Network Communication: See how to send data packets over a local network using the UDP protocol.
Solve Real-Time Challenges: Confront and solve issues like latency, choppy audio, and continuous data streaming.
The Core Components
Our walkie-talkie will consist of two main scripts:
Sender.m: This script will run on the transmitting computer. It listens to the microphone when a key is pressed, sending the audio data in small chunks over the network.
Receiver.m: This script runs on the receiving computer. It continuously listens for incoming data packets and plays them through the speakers as they arrive.
Step 1: Getting Audio In and Out
Before we touch networking, let's make sure we can capture and play audio. MATLAB's built-in audiorecorder and audioplayer objects make this simple.
Problem Encountered: How do you even access the microphone?
Solution: The audiorecorder object gives us straightforward control.
code
% --- Test Audio Capture and Playback ---
Fs = 8000; % Sample rate in Hz
nBits = 16; % Number of bits per sample
nChannels = 1; % Mono audio
% Create a recorder object
recObj = audiorecorder(Fs, nBits, nChannels);
disp('Start speaking for 3 seconds.');
recordblocking(recObj, 3); % Record for 3 seconds
disp('End of Recording.');
% Get the audio data
audioData = getaudiodata(recObj);
% Play it back
playObj = audioplayer(audioData, Fs);
play(playObj);
Running this script confirms that your microphone and speakers are correctly configured and accessible by MATLAB.
Step 2: Sending Voice Over the Network
Now, we need to send the audioData to another computer. For real-time applications like this, the UDP (User Datagram Protocol) is the ideal choice. It’s a "fire-and-forget" protocol that prioritizes speed over perfect reliability. Losing a tiny packet of audio is better than waiting for it to be re-sent, which would cause noticeable delays (latency).
Problem Encountered: How do you send data continuously without overwhelming the network or the receiver?
Solution: We'll send the audio in small, manageable chunks inside a loop. We need to create a UDP Port object to handle the communication.
Here's the basic structure for the Sender.m script:
code
% --- Sender.m ---
% Define network parameters
remoteIP = '192.168.1.101'; % <--- CHANGE THIS to the receiver's IP
remotePort = 3000;
localPort = 3001;
% Create UDP Port object
udpSender = udpport("LocalPort", localPort, "EnablePortSharing", true);
% Configure audio recorder
Fs = 8000;
nBits = 16;
nChannels = 1;
recObj = audiorecorder(Fs, nBits, nChannels);
disp('Press any key to start transmitting. Press Ctrl+C to stop.');
pause; % Wait for user to press a key
% Start the Push-to-Talk loop
disp('Transmitting... (Hold Ctrl+C to exit)');
while true
recordblocking(recObj, 0.1); % Record a 0.1-second chunk
audioChunk = getaudiodata(recObj);
% Send the audio chunk over UDP
write(udpSender, audioChunk, "double", remoteIP, remotePort);
end
And here is the corresponding Receiver.m script:
code
Matlab
% --- Receiver.m ---
% Define network parameters
localPort = 3000;
% Create UDP Port object
udpReceiver = udpport("LocalPort", localPort, "EnablePortSharing", true, "Timeout", 30);
% Configure audio player
Fs = 8000;
playerObj = audioplayer(zeros(Fs*0.1, 1), Fs); % Pre-buffer
disp('Listening for incoming audio...');
% Start the listening loop
while true
% Wait for and receive data
[audioChunk, ~, ~] = read(udpReceiver, Fs*0.1, "double");
if ~isempty(audioChunk)
% Play the received audio chunk
play(playerObj, audioChunk);
else
disp('No data received. Still listening...');
end
end
Step 3: Solving Real-World Hurdles
Running the code above might work, but you'll quickly notice some issues.
Problem 1: Choppy Audio and High Latency
The audio might sound robotic or delayed. This is because of the buffer size and the processing time. Sending tiny chunks frequently can cause overhead, while sending large chunks causes delay.
Solution: The key is to find a balance.
Tune the Chunk Size: The 0.1 second chunk size in the sender (recordblocking(recObj, 0.1)) is a good starting point. Experiment with values between 0.05 and 0.2. Smaller values reduce latency but increase network traffic.
Use a Buffered Player: Instead of creating a new audioplayer for every chunk, we create one at the start and feed it new data. Our receiver code already does this, which is more efficient.
Problem 2: No Real "Push-to-Talk"
Our sender script starts transmitting and doesn't stop. A real walkie-talkie only transmits when a button is held down.
Solution: Simulating this in a script requires a more advanced technique, ideally using a MATLAB App Designer GUI. However, we can create a simple command-window version using a figure's KeyPressFcn.
Here is an improved concept for the Sender that simulates radio push-to-talk, e.g. https://www.retevis.com/blog/ptt-push-to-talk-walkie-talkies-guide
% --- Advanced_Sender.m ---
function PushToTalkSender()
% -- Configuration --
remoteIP = '192.168.1.101'; % <--- CHANGE THIS
remotePort = 3000;
localPort = 3001;
Fs = 8000;
% -- Setup --
udpSender = udpport("LocalPort", localPort);
recObj = audiorecorder(Fs, 16, 1);
% -- GUI for key press detection --
fig = uifigure('Name', 'Push-to-Talk (Hold ''t'')', 'Position', [100 100 300 100]);
fig.KeyPressFcn = @KeyPress;
fig.KeyReleaseFcn = @KeyRelease;
isTransmitting = false; % Flag to control transmission
disp('Focus on the figure window. Hold the ''t'' key to transmit.');
% --- Main Loop ---
while ishandle(fig)
if isTransmitting
% Non-blocking record and send would be ideal,
% but for simplicity we use short blocking chunks.
recordblocking(recObj, 0.1);
audioChunk = getaudiodata(recObj);
write(udpSender, audioChunk, "double", remoteIP, remotePort);
disp('Transmitting...');
else
pause(0.1); % Don't burn CPU when idle
end
drawnow; % Update figure window
end
% --- Callback Functions ---
function KeyPress(~, event)
if strcmp(event.Key, 't')
isTransmitting = true;
end
end
function KeyRelease(~, event)
if strcmp(event.Key, 't')
isTransmitting = false;
disp('Transmission stopped.');
end
end
end
Conclusion and Next Steps
You've now built the foundation of a real-time voice communication tool in MATLAB! You've learned how to capture audio, send it over a network using UDP, and handle some of the fundamental challenges of real-time streaming.
This project is the perfect starting point for more advanced explorations:
Build a Full GUI: Use App Designer to create a user-friendly interface with a proper push-to-talk radio button.
Implement Noise Reduction: Apply a filter (e.g., a simple low-pass or a more advanced spectral subtraction algorithm) to the audioChunk before sending it.
Add Channels: Modify the code to use different UDP ports, allowing users to select a "channel" to talk on.

