Results for
Hello,
I've looked around and I haven't found anything obvious about this, but is it possible to link to species/reactions, graphically, in a non-mass transfer sense? I have areas in my model where it would conceptually make sense to be able to see that species or reactions are linked, but if I link them in the standard way it demands that it be involved in the stoichiometry.
Perhaps some kind of dotted line, or similar?
Thank you, best regards,
Dan
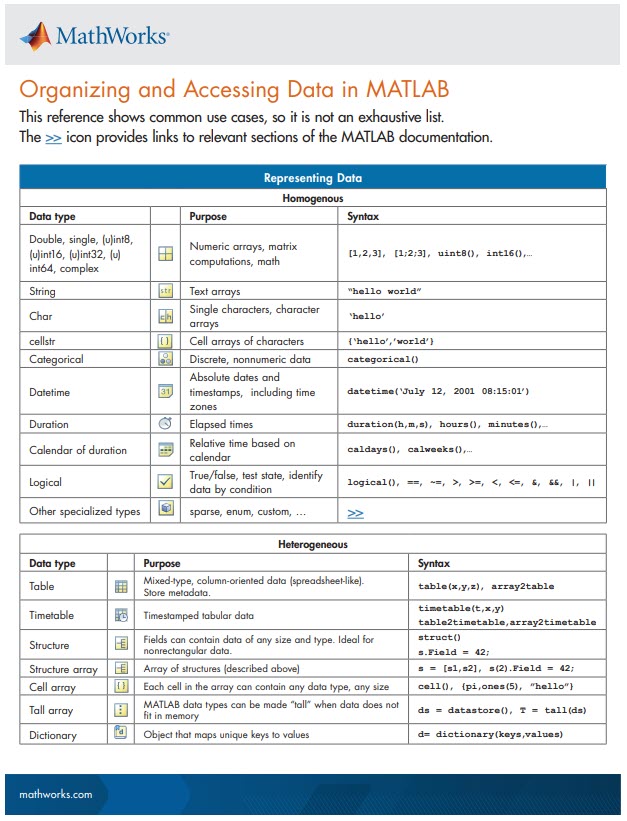
New Cheat Sheet Alert!
Level up your data organization and access skills in MATLAB with our latest cheat sheet! Download the full cheat sheet on MATLAB GitHub for Students here.
I know the latest version of MATLAB R2023b has this feature already, put it should be added to R2023a as well because of its simplicity and convenience.
Basically, I want to make a bar graph that lets me name each column in a basic bar graph:
y=[100 99 100 200 200 300 500 800 1000];
x=["0-4" "5-17" "18-29" "30-39" "40-49" "50-64" "65-74" "75-84" "85+"];
bar(x,y)
However, in R2023a, this isn't a feature. I think it should be added because it helps to present data and ideas more clearly and professionally, which is the purpose of a graph to begin with.
Would it be a good thing to have implicit expansion enabled for cat(), horzcat(), vertcat()? There are often situations where I would like to be able to do things like this:
x=[10;20;30;40];
y=[11;12;13;14];
z=cat(3, 0,1,2);
C=[x,y,z]
with the result,
C(:,:,1) =
10 11 0
20 12 0
30 13 0
40 14 0
C(:,:,2) =
10 11 1
20 12 1
30 13 1
40 14 1
C(:,:,3) =
10 11 2
20 12 2
30 13 2
40 14 2
In the past year, we've witnessed an exponential growth of ChatGPT and other Generative AI tools. AI has quickly become a transformative force across industries, from tech giants to small startups, and even community sites like ours. For instance, Stack Overflow announced its plan to leverage AI tools to draft a question or tag content; Quora built a ChatGPT bot to answer questions; and GitHub is piloting the AI tool for personalized content.

This trend in the community landscape makes me wonder what MATLAB Central community, especially in MATLAB Answers, can do to integrate AI and enhance the community.
Share with us your ideas in the comment session. Ideally one comment per idea, so that others can vote on a secific idea or have deeper discussions about it.
We launched the Discussions area with 6 channels, based on the existing types of content we see today in the MATLAB Central community.
I'm curious which channels you are most interested in participating, or which channels are missing.
Tell us your thoughts here!
Hello all,
I've been trying to shift my workflow more towards simbiology, it has a lot of very interesting features and it makes sense to try and do everything in one place if it works well..! Part of my hesitancy into this was some bad experiences handling units in the past, though this was almost certainly all out of my own ignorance, relatedly:
Getting onto my question.
In this model I have a species traveling around the body via blow flow, think a basic PBPK model. My species are picomolarities, if everything is already in concentrations, why is it necessary to initially divide by the compartment volume? i.e. 1/Pancreas below.

If my model dealt in molar quantities this would make a lot of sense, the division would represent the transition to concentrations. This, however, now necessitates my parameters be in units of liter/minute, which is actually correct, but I'd like clarification on why it's correct, ha!
Perhaps this is more of a modelling question than a simbiology question, but if there are answers I'd love to hear them. Thanks!
Calling all students! New to MATLAB or need helpful resources? Check out our MATLAB GitHub for Students repository! Find MATLAB examples, videos, cheat sheets, and more!

Visit the repository here: MATLAB GitHub for Students
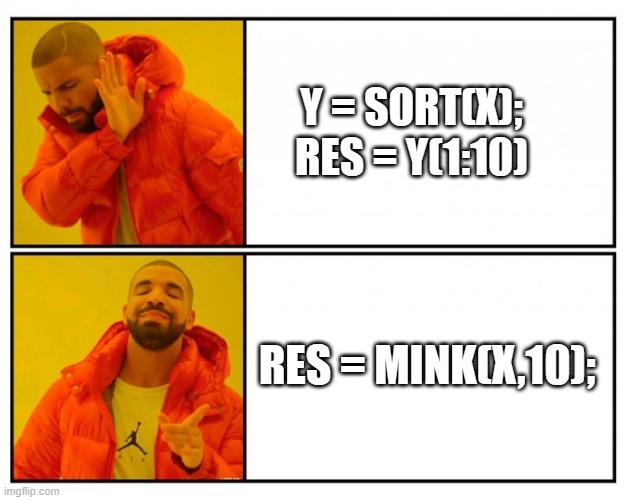
Imagine x is a large vector and you want the smallest 10 elements. How might you do it?
Hi All,
I'm attempting to put a set of simbiology global sensitivity analysis plots into my thesis and I'm running into some issues with the GSA plots. Firstly, the figures are very large, it would be quite beneficial to grab a set of the plots and arrange them myself, is there any documentation on how to mess around with the '1x1 Sobol' produced by sbiosobol? Or just GSA plots in general.
The second problem is that the results appear to be relative to the most sensitive parameter in that run. Is it recommended to have a resonably sensitive 'baseline' parameter in each run? I find it difficult to compare plots when a not so sensitive parameter is being recorded as near '1' for the whole run because it's being stacked against a set of very insensitive parameters. I.e. if i have multiple sets of GSAs due to a large model, how can I easily compare results? If I could do some single run through with every parameter that would be the ideal, I imagine, but then the default plot would be half a mile off the bottom of my screen, haha! Perhaps there is a solution to the first question that might help there?
Thank you for your help,
Dan
Thats the task:
Given a square cell array:
x = {'01', '56'; '234', '789'};
return a single character array:
y = '0123456789'
I wrote a code that passes Test 1 and 2 and one that passes Test 3 but I'm searching a condition so that the code for Test 3 runs when the cell array only contains letters and the one for Test 1 and 2 in every other case. Can somebody help me?
This is my code:
y = []
[a,b]=size(x)
%%TEST 3
delimiter=zeros(1,a)
delimiter(end)=1
delimiter=repmat(delimiter,1,b)
delimiter(end)=''
delimiter=string(delimiter)
y=[]
for i=1:a*b
y = string([y x(i)])
end
y=join(y,delimiter)
y=erase(y,'0')
y=regexprep(y,'1',' ')
%%TEST 1+2
for i=1:a*b
y = string([y x(i)])
y=join(y)
end
y=erase(y,' ' )
That's the question: Given four different positive numbers, a, b, c and d, provided in increasing order: a < b < c < d, find if any three of them comprise sides of a right-angled triangle. Return true if they do, otherwise return false .
I wrote this code but it doesn't pass test 7. I don't really understand why it isn't working. Can somebody help me?
function flag = isTherePythagoreanTriple(a, b, c, d)
a2=a^2
b2=b^2
c2=c^2
d2=d^2
format shortG
if a2+b2==c2
flag=true
else if a2+b2==d2
flag=true
else if a2+c2==d2
flag=true
else if c2+b2==d2
flag=true
else flag=false
end
end
end
end
end
That's the question:
The file cars.mat contains a table named cars with variables Model, MPG, Horsepower, Weight, and Acceleration for several classic cars.
Load the MAT-file. Given an integer N, calculate the output variable mpg.
Output mpg should contain the MPG of the top N lightest cars (by Weight) in a column vector.
I wrote this code and the resulting column vector has the right values but it doesn't pass the tests. What's wrong?
function mpg = sort_cars(N)
load cars.mat
sorted=sortrows(cars,4)
mpg = sorted(1:N,2)
end
Hi all,
I've translated a model from another piece of software (monolix) into simbio programmatically to make use of your very easy global sensitivity analysis system.
It looks a little something like this, for a 'single' line example:
r1 = addreaction(model,'InsI -> InsP');
r1.ReactionRate = 'InsI*kip/vi'; %- is + panc
k1 = addkineticlaw(r1, 'Unknown');
Multiplied about 20 fold, as you can see I have included my volumes within the reaction rates myself (vi). The model functions perfectly and I have corrected the outputs at the end:
[time, x, names] = sbiosimulate(model,csObj,dObj1);
x(:,1) = x(:,1)/vi;
So that they are in concentration, as needed. However, when it comes to sensitivity analysis because I have corrected them post-model it is technically incorrect, it is analysing the absolute quantities. This is quite noticible in the sensitivity to the volumes.
Is there an easy fix to this, I've had to fight dimensionality with units in the past using simbio and I'd be great if there was some way of dividing a compartment output by a volume, for example. It is a functionality that exists in monolix, so I was hopeful it might here!
Thank you for your time.
EDIT:
I think I've worked it out, I had to refactor my model to operate in concentrations, just refitting it now. Now I should just be able to use unitless compartments.
I am trying to simulate model of blood lymphocyte count from a paper using Simbiology. The rate of in or out following circadian rythym is kp(t)=km + kb cos [(t-tpeak)*2pi/24] Where and how do I write the expression ? I dont think I can write in repeated assignment ?
I recently have found that I am no longer able to give my difficulty rating for questions on Cody after sucessfully completing a question. This is obviously not a big deal, I was just wondering if this was an issue on my end or if there was some change that I was not aware of.
The option to rate does not pop up after solving a problem, and the rating in general does not even show up anymore when answering questions (though it is visible from problem groups).
I am currently facing a compatibility issue when attempting to load a SimBiology model created in MATLAB 2021a into MATLAB 2023a. Specifically, the code capture functionality does not seem to be working.
If anyone has encountered a similar situation or has insights on how to capture the code for a SimBiology model created in an older version of MATLAB, I would greatly appreciate your guidance. Are there any alternative methods or specific steps that can be followed to ensure successful code capture?
Thank you in advance for your time and expertise.
This is the 6th installment of the wish-list and bug report thread.
This topic is the follow on to the first Wish-list for MATLAB Answer sections and second MATLAB Answers Wish-list #2 (and bug reports). The third started out as New design of the forum - grey on white and the fourth and fifth also grew so large they are slow to load and navigate.
Same idea as the previous ones: one wish (or bug report) per answer, so that people can vote their wishes.
What should you post where?
Next Gen threads (#1): features that would break compatibility with previous versions, but would be nice to have
@anyone posting a new thread when the last one gets too large (about 50 answers seems a reasonable limit per thread), please update this list in all last threads. (if you don't have editing privileges, just post a comment asking someone to do the edit)
When solving problems over on Cody, I can almost always view all solutions to a problem after submitting a correct solution of my own. Very rarely, however, this is not the case, and I instead get the following message:
This solution is locked. To view this solution, you need to provide a solution of the same size or smaller.
You may solve another problem from Community group to unlock all the solutions to this problem.
If this happens, then again, I can almost always rectify this by submitting a (correct) solution to a different problem (I take it that the Community group is the implicit group of all problems on Cody --- is it?). But sometimes that, too, fails.
So my question is, why? What are the criteria that determine when all solutions are, in fact, unlocked?
Simple question: I noticed there's a Modeling & Simulation Challenge Master badge over on Cody, but I can't find the corresponding group. So: where is it? Does it still exist at all?