Results for
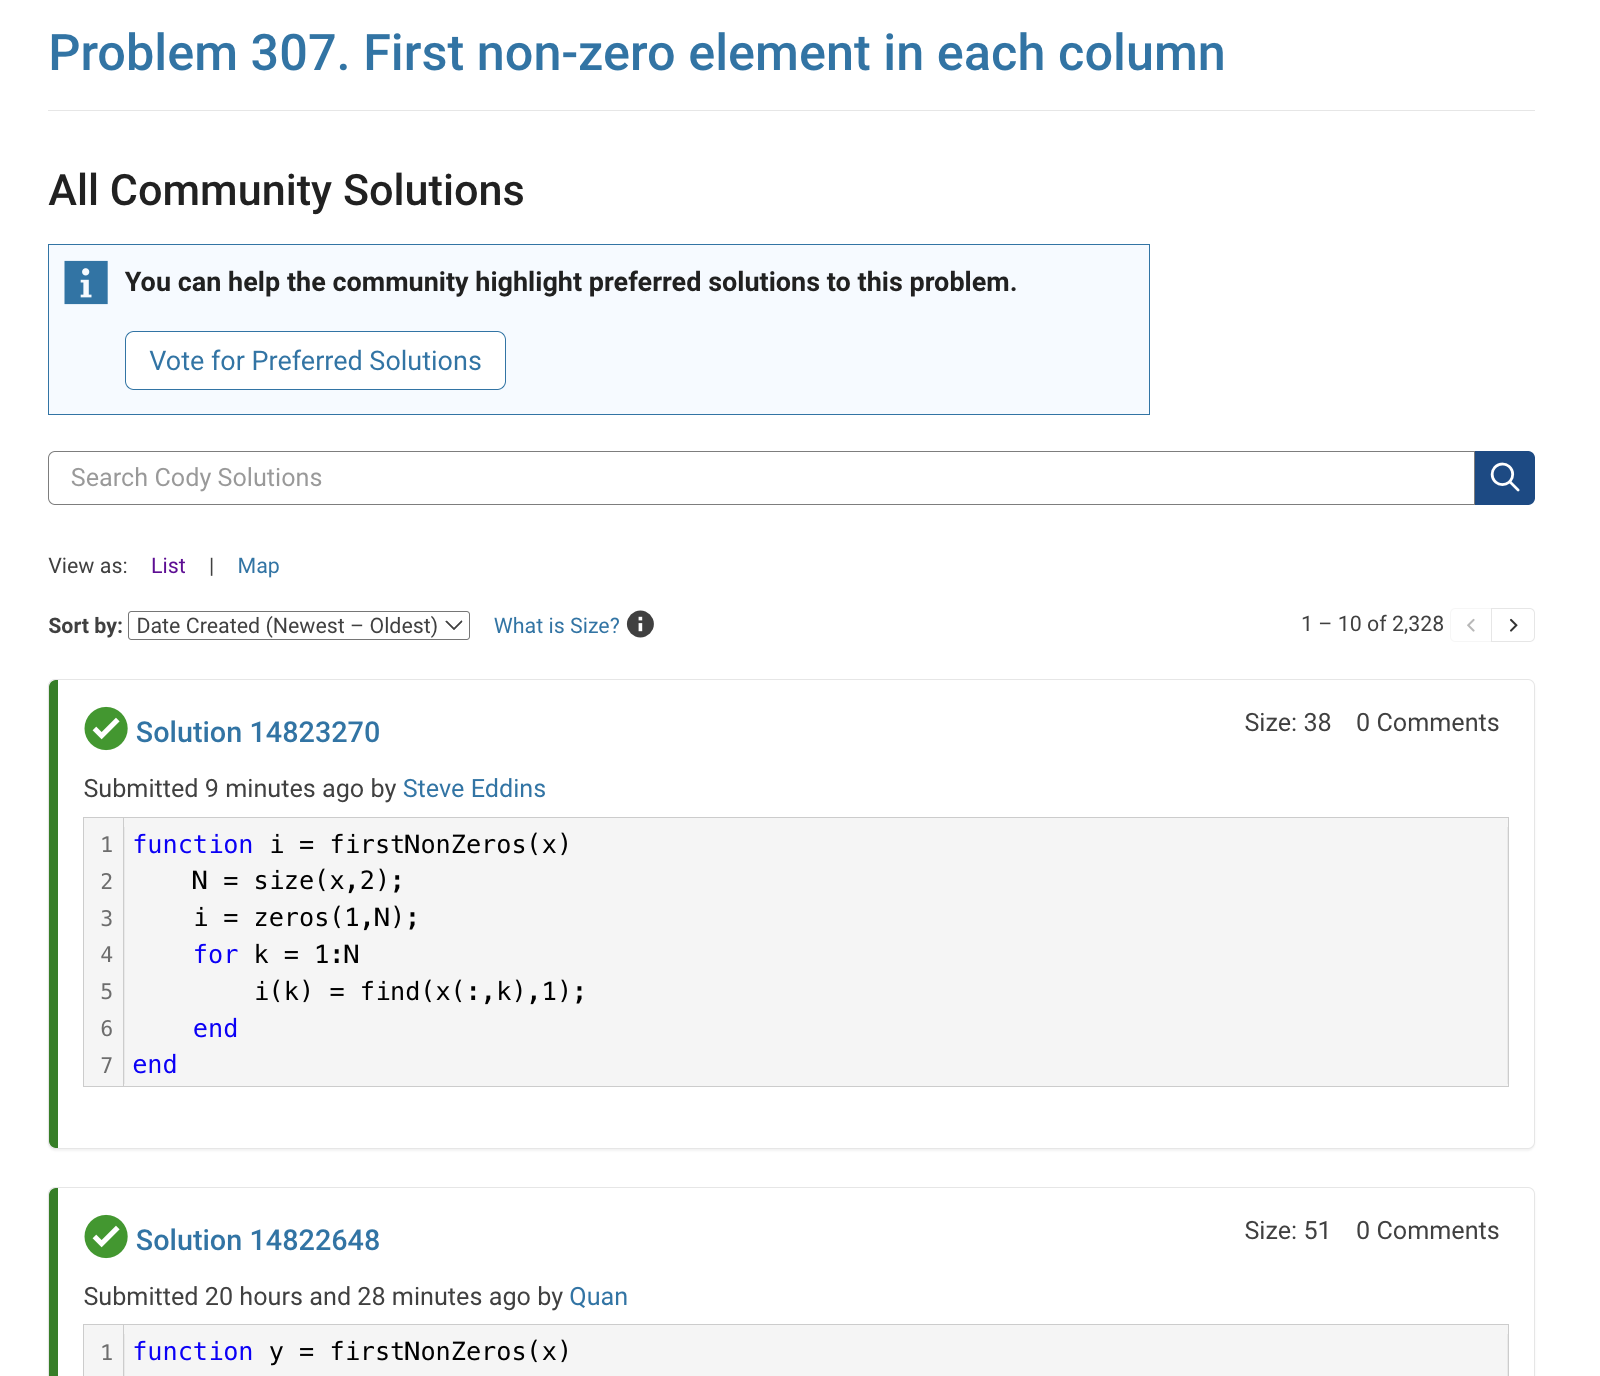
The all-community-solutions view shows the ID of each solution, and you can click on the link to go to the solution.
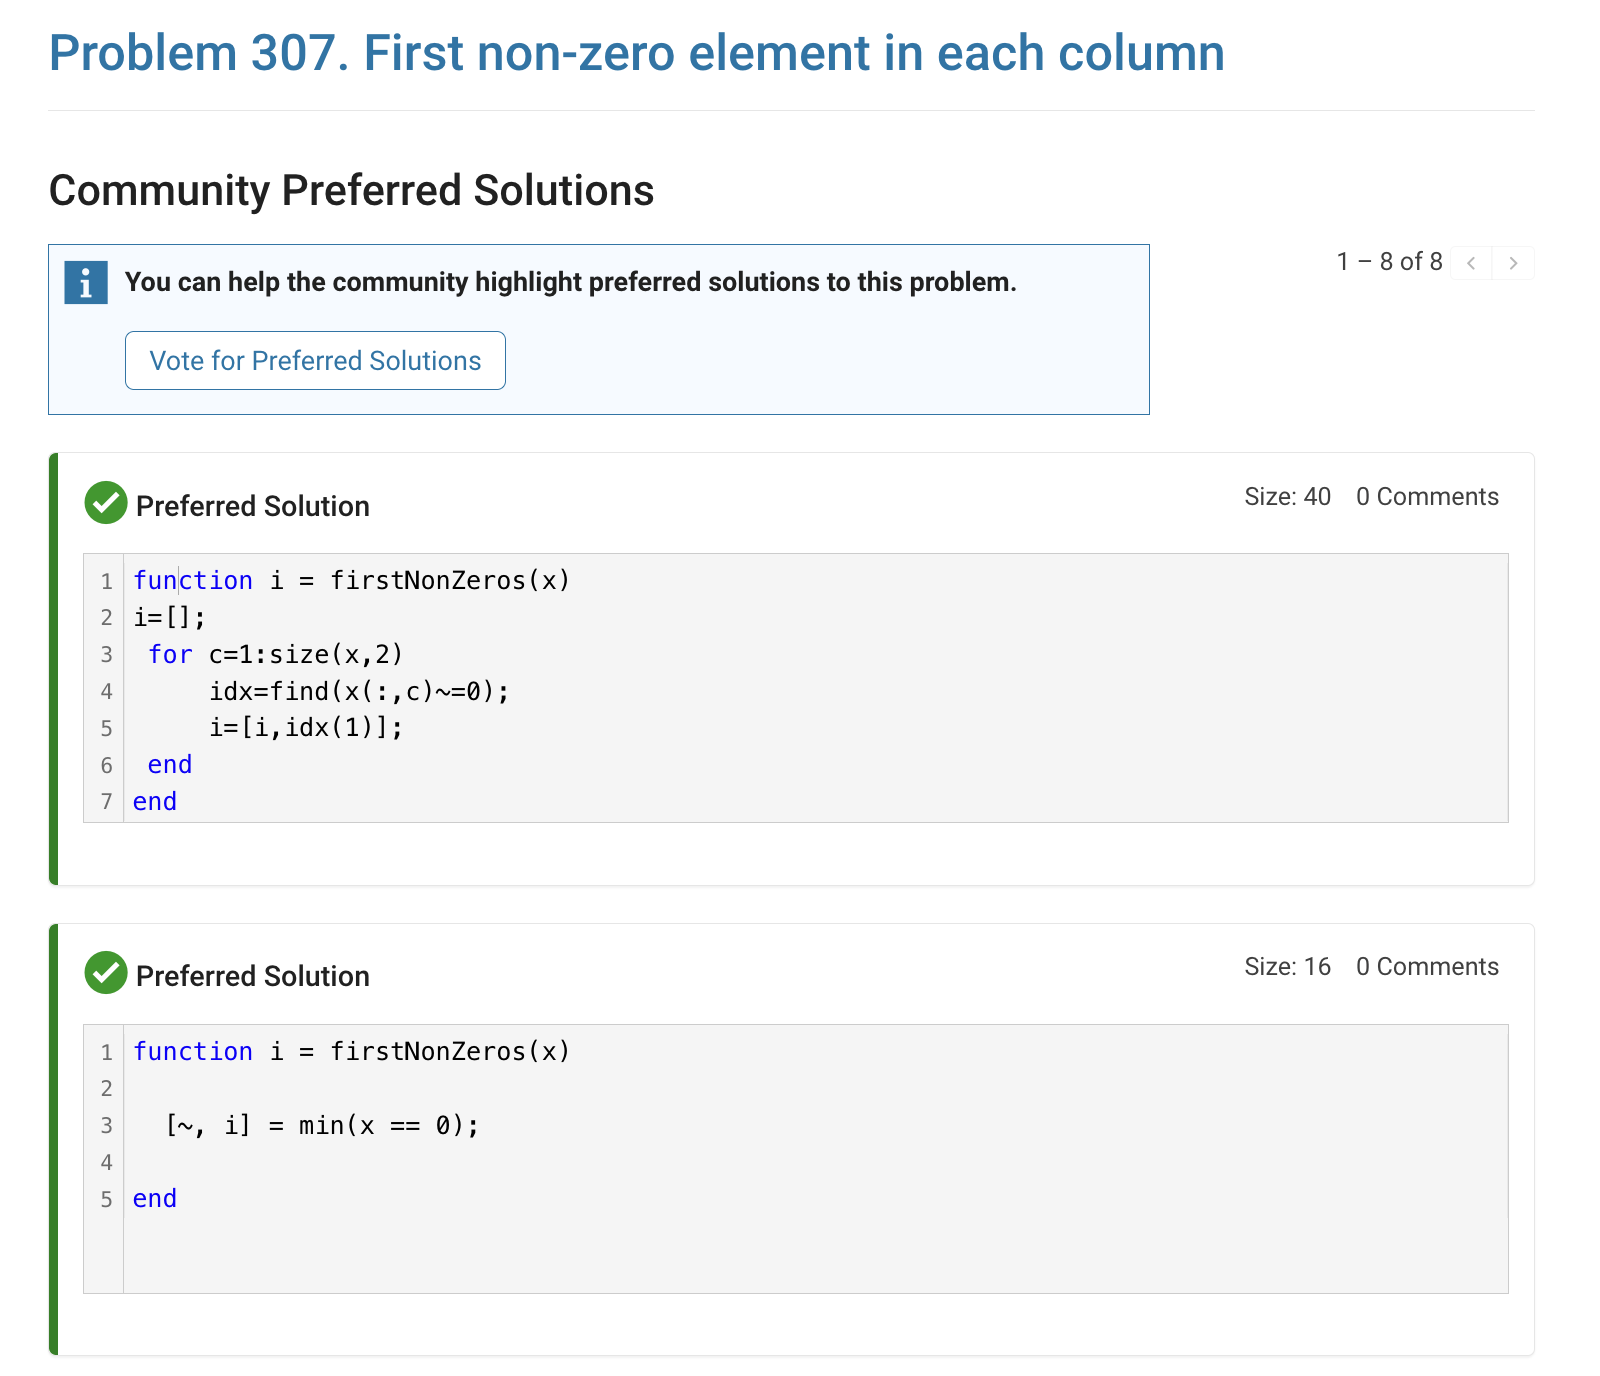
The preferred-community-solutions view does not show the solution IDs and does not link to the solutions. As far as I can tell, there is no way to get from that view to the solutions. If, for example, you want to go to the solution to leave a comment there, you can't.
All-community-solutions view:
Preferred-community-solutions view, with no solution IDs and no links:
Hi cody fellows,
I already solved more than 500 problems -months ago, last july if I remember well- and get this scholar badge, but then it suddenly disappeared a few weeks later. I then solved a few more problems and it reappeared.
Now I observed it disappeared once more a few days ago.
Have you also noticed this erratic behavior of the scholar badge ? Is it normal and / or intentional ? If not, how to explain it ? (deleted problems ?)
Cheers,
Nicolas
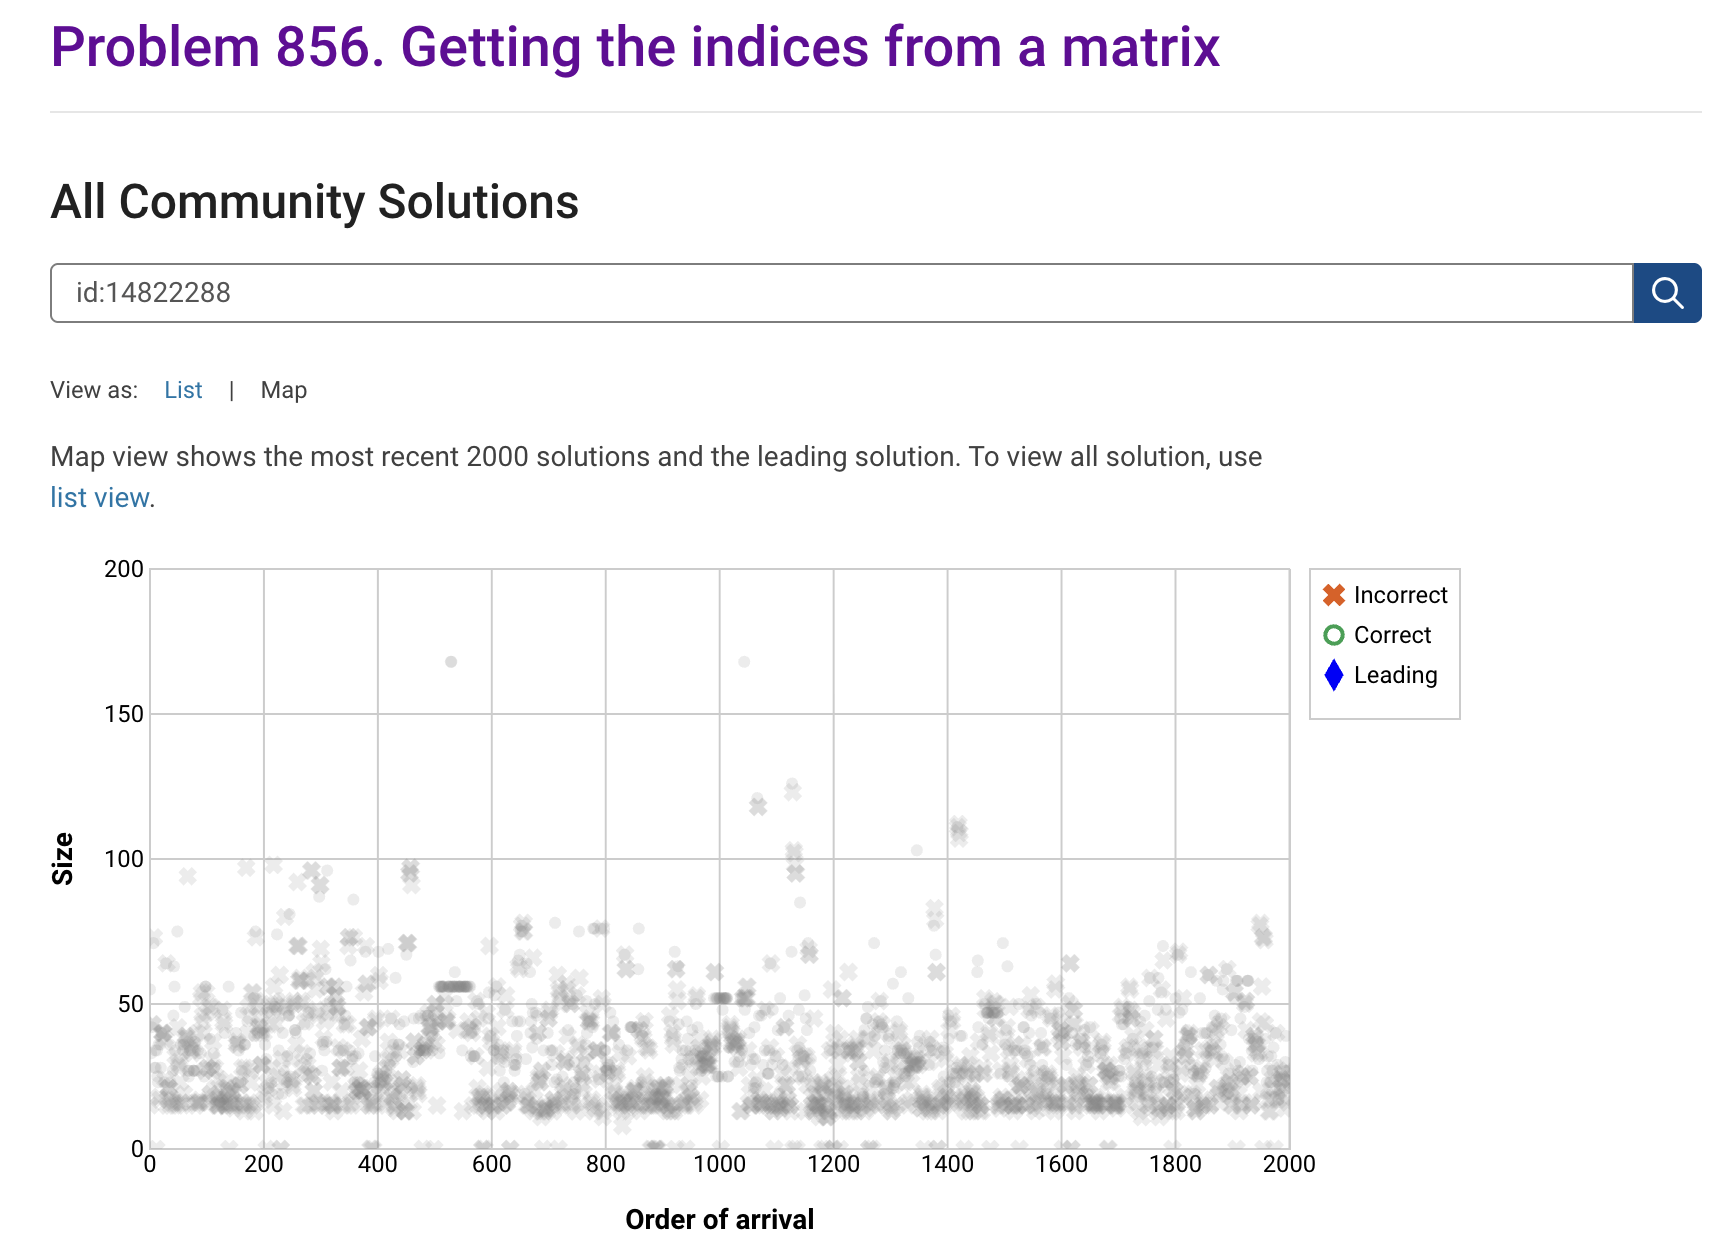
I'm seeing solution maps shown with low-contrast gray colors instead of the correct symbol colors. I have observed this using both Safari and Chrome. Screenshot:
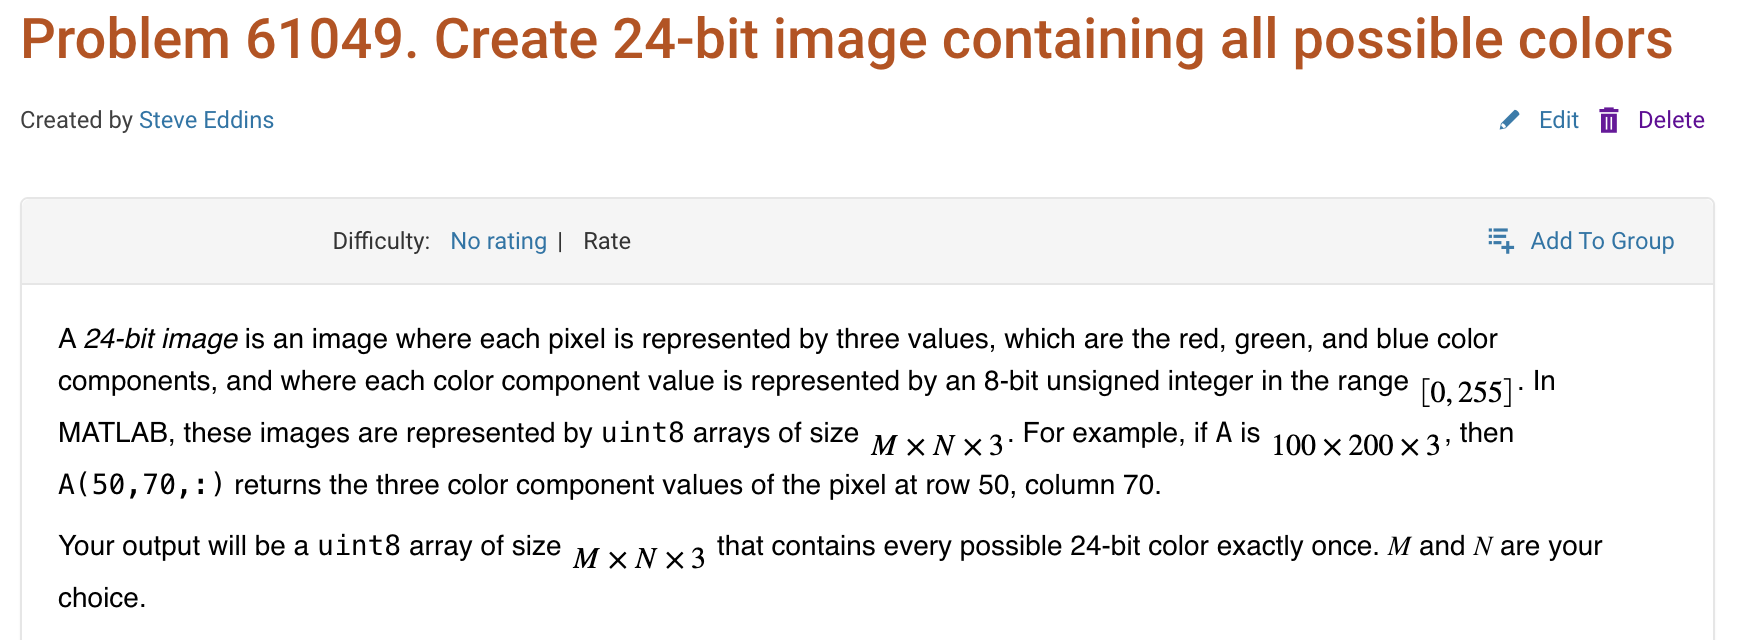
Here is a screenshot of a Cody problem that I just created. The math rendering is poor. (I have since edited the problem to remove the math formatting.)
Excited to be here
Get ready to roll up your sleeves at MATLAB EXPO 2025 – our global online event is back, and this year we’re offering 10 hands-on workshops designed to spark innovation and deepen your skills with MATLAB Online and Simulink Online.
Whether you're exploring AI, modeling batteries, or building carbon trackers, these live workshops are your chance to:
- Work directly in MATLAB and Simulink Online
- Solve real-world challenges with guidance from MathWorks experts
- Connect with peers across industries
- Ask questions and get live feedback
Join the Experience to learn more about each workshop below!
Which workshop are you most excited to attend?!
Day 1:
- Beyond the Labels: Leveraging AI Techniques for Enlightened Product Choices
- A Hands-On Introduction to Reinforcement Learning with MATLAB and Simulink
- Curriculum Development with MATLAB Copilot and Generative AI
- Simscape Battery Workshop
- Generating Tests for your MATLAB code
Day 2:
- Hands-On AI for Smart Appliances: From Sensor Data to Embedded Code
- A Hands-On Introduction to Reduced Order Modeling with MATLAB and Simulink
- Introduction to Research Software and Development with Simulink
- Hack Your Carbon Impact: Build and Publish an Emissions Tracker with MATLAB
- How to Simulate Scalable Cellular and Connectivity Networks: A Hands-On Session
We look forward to Accelerating the Pace of Engineering and Science together!

It’s an honor to deliver the keynote at MATLAB EXPO 2025. I'll explore how AI changes the game in engineered systems, bringing intelligence to every step of the process from design to deployment. This short video captures a glimpse of what I’ll share:
What excites or challenges you about this shift? Drop a comment or start a thread!
I just learned you can access MATLAB Online from the following shortcut in your web browser: https://matlab.new
Thanks @Yann Debray
From his recent blog post: pip & uv in MATLAB Online » Artificial Intelligence - MATLAB & Simulink
Are there any code restrictions for programming Cody solutions? I could not find anything mentioned at https://www.mathworks.com/matlabcentral/content/cody/about.html, other than toolbox functions not being available.
Hey everyone,
I’m currently working with MATLAB R2025b and using the MQTT blocks from the Industrial Communication Toolbox inside Simulink. I’ve run into an issue that’s driving me a bit crazy, and I’m not sure if it’s a bug or if I’m missing something obvious.
Here’s what’s happening:
- I open the MQTT Configure block.
- I fill out all the required fields — Broker address, Port, Client ID, Username, and Password.
- When I click Test Connection, it says “Connection established successfully.” So far so good.
- Then I click Apply, close the dialog, set the topic name, and try to run the simulation.
- At this point, I get the following error:Caused by: Invalid value for 'ClientID', 'Username' or 'Password'.
- When I reopen the MQTT config block, I notice that the Password field is empty again — even though I definitely entered it before and the connection test worked earlier.
It seems like Simulink is somehow not saving the password after hitting Apply, which leads to the authentication error during simulation.
Has anyone else faced this? Is this a bug in R2025b, or do I need to configure something differently to make the password persist?
Would really appreciate any insights, workarounds, or confirmations from anyone who has used MQTT in Simulink recently.
Thanks in advance!
Please share with us how you are using AI in your control design workflows and what you want to hear most in our upcoming talk, 4 Ways to Improve Control Design Workflows with AI.
Arkadiy
Hello Everyone, I’m Vikram Kumar Singh, and I’m excited to be part of this amazing MATLAB community!
I’m deeply interested in learning more from all of you and contributing wherever I can. Recently, I completed a project on modeling and simulation of a Li-ion battery with a Battery Management System (BMS) for fault detection and management.
I’d love to share my learnings and also explore new ideas together with this group. Looking forward to connecting and growing with the community!
Excited for MATLAB EXPO 2025!
I’m a Master’s student in Electrical Engineering at UNSW Sydney, researching EV fleet charging and hybrid energy strategies integrating battery-electric and hydrogen fuel cell vehicles.
LinkedIn link: www.linkedin.com/in/yuanzhe-chen-6b2158351
ResearchGate link: https://www.researchgate.net/profile/Yuanzhe-Chen-9?ev=hdr_xprf
#MATLABEXPO #EV #FCEV #SmartGrid
Inspired by @xingxingcui's post about old MATLAB versions and @유장's post about an old Easter egg, I thought it might be fun to share some MATLAB-Old-Timer Stories™.
Back in the early 90s, MATLAB had been ported to MacOS, but there were some interesting wrinkles. One that kept me earning my money as a computer lab tutor was that MATLAB required file names to follow Windows standards - no spaces or other special characters. But on a Mac, nothing stopped you from naming your script "hello world - 123.m". The problem came when you tried to run it. MATLAB was essentially doing an eval on the script name, assuming the file name would follow Windows (and MATLAB) naming rules.
So now imagine a lab full of students taking a university course. As is common in many universities, the course was given a numeric code. For whatever historical reason, my school at that time was also using numeric codes for the departments. Despite being told the rules for naming scripts, many students would default to something like "26.165 - 1.1" for problem one on HW1 for the intro applied math course 26.165.
No matter what they did in their script, when they ran it, MATLAB would just say "ans = 25.0650".
Nothing brings you more MATLAB-god credibility as a student tutor than walking over to someone's computer, taking one look at their output, saying "rename your file", and walking away like a boss.
It was 2010 when I was a sophomore in university. I chose to learn MATLAB because of a mathematical modeling competition, and the university provided MATLAB 7.0, a very classic release. To get started, I borrowed many MATLAB books from the library and began by learning simple numerical calculations, plotting, and solving equations. Gradually I was drawn in by MATLAB’s powerful capabilities and became interested; I often used it as a big calculator for fun. That version didn’t have MATLAB Live Script; instead it used MATLAB Notebook (M-Book), which allowed MATLAB functions to be used directly within Microsoft Word, and it also had the Symbolic Math Toolbox’s MuPAD interactive environment. These were later gradually replaced by Live Scripts introduced in R2016a. There are many similar examples...
Out of curiosity, I still have screenshots on my computer showing MATLAB 7.0 running compatibly. I’d love to hear your thoughts?


Excited to link and sync to be a part of better learning experience
happy to be here
Excited to link up
What if you had no isprime utility to rely on in MATLAB? How would you identify a number as prime? An easy answer might be something tricky, like that in simpleIsPrime0.
simpleIsPrime0 = @(N) ismember(N,primes(N));
But I’ll also disallow the use of primes here, as it does not really test to see if a number is prime. As well, it would seem horribly inefficient, generating a possibly huge list of primes, merely to learn something about the last member of the list.
Looking for a more serious test for primality, I’ve already shown how to lighten the load by a bit using roughness, to sometimes identify numbers as composite and therefore not prime.
https://www.mathworks.com/matlabcentral/discussions/tips/879745-primes-and-rough-numbers-basic-ideas
But to actually learn if some number is prime, we must do a little more. Yes, this is a common homework problem assigned to students, something we have seen many times on Answers. It can be approached in many ways too, so it is worth looking at the problem in some depth.
The definition of a prime number is a natural number greater than 1, which has only two factors, thus 1 and itself. That makes a simple test for primality of the number N easy. We just try dividing the number by every integer greater than 1, and not exceeding N-1. If any of those trial divides leaves a zero remainder, then N cannot be prime. And of course we can use mod or rem instead of an explicit divide, so we need not worry about floating point trash, as long as the numbers being tested are not too large.
simpleIsPrime1 = @(N) all(mod(N,2:N-1) ~= 0);
Of course, simpleIsPrime1 is not a good code, in the sense that it fails to check if N is an integer, or if N is less than or equal to 1. It is not vectorized, and it has no documentation at all. But it does the job well enough for one simple line of code. There is some virtue in simplicity after all, and it is certainly easy to read. But sometimes, I wish a function handle could include some help comments too! A feature request might be in the offing.
simpleIsPrime1(9931)
simpleIsPrime1(9932)
simpleIsPrime1 works quite nicely, and seems pretty fast. What could be wrong? At some point, the student is given a more difficult problem, to identify if a significantly larger integer is prime. simpleIsPrime1 will then cause a computer to grind to a distressing halt if given a sufficiently large number to test. Or it might even error out, when too large a vector of numbers was generated to test against. For example, I don't think you want to test a number of the order of 2^64 using simpleIsPrime1, as performing on the order of 2^64 divides will be highly time consuming.
uint64(2)^63-25
Is it prime? I’ve not tested it to learn if it is, and simpleIsPrime1 is not the tool to perform that test anyway.
A student might realize the largest possible integer factors of some number N are the numbers N/2 and N itself. But, if N/2 is a factor, then so is 2, and some thought would suggest it is sufficient to test only for factors that do not exceed sqrt(N). This is because if a is a divisor of N, then so is b=N/a. If one of them is larger than sqrt(N), then the other must be smaller. That could lead us to an improved scheme in simpleIsPrime2.
simpleIsPrime2 = @(N) all(mod(N,2:sqrt(N)));
For an integer of the size 2^64, now you only need to perform roughly 2^32 trial divides. Maybe we might consider the subtle improvement found in simpleIsPrime3, which avoids trial divides by the even integers greater than 2.
simpleIsPrime3 = @(N) (N == 2) || (mod(N,2) && all(mod(N,3:2:sqrt(N))));
simpleIsPrime3 needs only an approximate maximum of 2^31 trial divides even for numbers as large as uint64 can represent. While that is large, it is still generally doable on the computers we have today, even if it might be slow.
Sadly, my goals are higher than even the rather lofty limit given by UINT64 numbers. The problem of course is that a trial divide scheme, despite being 100% accurate in its assessment of primality, is a time hog. Even an O(sqrt(N)) scheme is far too slow for numbers with thousands or millions of digits. And even for a number as “small” as 1e100, a direct set of trial divides by all primes less than sqrt(1e100) would still be practically impossible, as there are roughly n/log(n) primes that do not exceed n. For an integer on the order of 1e50,
1e50/log(1e50)
It is practically impossible to perform that many divides on any computer we can make today. Can we do better? Is there some more efficient test for primality? For example, we could write a simple sieve of Eratosthenes to check each prime found not exceeding sqrt(N).
function [TF,SmallPrime] = simpleIsPrime4(N)
% simpleIsPrime3 - Sieve of Eratosthenes to identify if N is prime
% [TF,SmallPrime] = simpleIsPrime3(N)
%
% Returns true if N is prime, as well as the smallest prime factor
% of N when N is composite. If N is prime, then SmallPrime will be N.
Nroot = ceil(sqrt(N)); % ceil caters for floating point issues with the sqrt
TF = true;
SieveList = true(1,Nroot+1); SieveList(1) = false;
SmallPrime = 2;
while TF
% Find the "next" true element in SieveList
while (SmallPrime <= Nroot+1) && ~SieveList(SmallPrime)
SmallPrime = SmallPrime + 1;
end
% When we drop out of this loop, we have found the next
% small prime to check to see if it divides N, OR, we
% have gone past sqrt(N)
if SmallPrime > Nroot
% this is the case where we have now looked at all
% primes not exceeding sqrt(N), and have found none
% that divide N. This is where we will drop out to
% identify N as prime. TF is already true, so we need
% not set TF.
SmallPrime = N;
return
else
if mod(N,SmallPrime) == 0
% smallPrime does divide N, so we are done
TF = false;
return
end
% update SieveList
SieveList(SmallPrime:SmallPrime:Nroot) = false;
end
end
end
simpleIsPrime4 does indeed work reasonably well, though it is sometimes a little slower than is simpleIsPrime3, and everything is hugely faster than simpleIsPrime1.
timeit(@() simpleIsPrime1(111111111))
timeit(@() simpleIsPrime2(111111111))
timeit(@() simpleIsPrime3(111111111))
timeit(@() simpleIsPrime4(111111111))
All of those times will slow to a crawl for much larger numbers of course. And while I might find a way to subtly improve upon these codes, any improvement will be marginal in the end if I try to use any such direct approach to primality. We must look in a different direction completely to find serious gains.
At this point, I want to distinguish between two distinct classes of tests for primality of some large number. One class of test is what I might call an absolute or infallible test, one that is perfectly reliable. These are tests where if X is identified as prime/composite then we can trust the result absolutely. The tests I showed in the form of simpleIsPrime1, simpleIsPrime2, simpleIsPrime3 and aimpleIsprime4, were all 100% accurate, thus they fall into the class of infallible tests.
The second general class of test for primality is what I will call an evidentiary test. Such a test provides evidence, possibly quite strong evidence, that the given number is prime, but in some cases, it might be mistaken. I've already offered a basic example of a weak evidentiary test for primality in the form of roughness. All primes are maximally rough. And therefore, if you can identify X as being rough to some extent, this provides evidence that X is also prime, and the depth of the roughness test influences the strength of the evidence for primality. While this is generally a fairly weak test, it is a test nevertheless, and a good exclusionary test, a good way to avoid more sophisticated but time consuming tests.
These evidentiary tests all have the property that if they do identify X as being composite, then they are always correct. In the context of roughness, if X is not sufficiently rough, then X is also not prime. On the other side of the coin, if you can show X is at least (sqrt(X)+1)-rough, then it is positively prime. (I say this to suggest that some evidentiary tests for primality can be turned into truth telling tests, but that may take more effort than you can afford.) The problem is of course that is literally impossible to verify that degree of roughness for numbers with many thousands of digits.
In my next post, I'll look at the Fermat test for primality, based on Fermat's little theorem.