Results for
I've read thru the API refernce doc and the information in the right-hand side panel on "API Keys" tab and so I 'm pretty sure the answer is "no" but throught it was worth double-checking.
My application for this is that I have several devices, each with their own channel. For security, I'd like them to be able to deduce or calculate the write API key to their channel based on their device serial number (which each device knows) so that I don't have to store the API key in their firmware.
thanks...
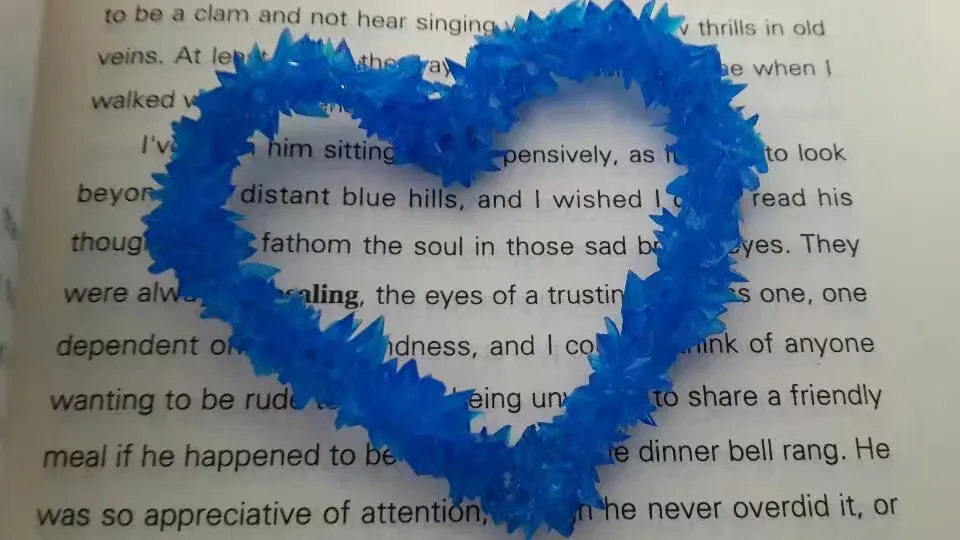
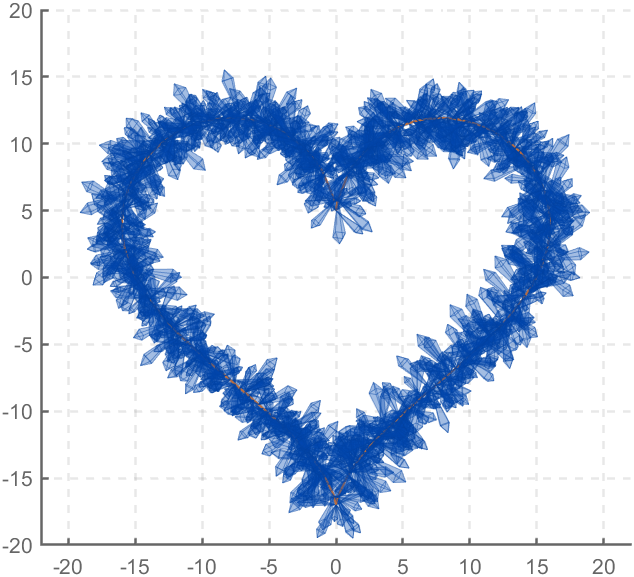
The creativity comes from the copper sulfate crystal heart made in junior high school. Copper sulfate is a triclinic crystal, and the same structure was not used here for convenience in drawing.
Part 1. Coordinate transformation
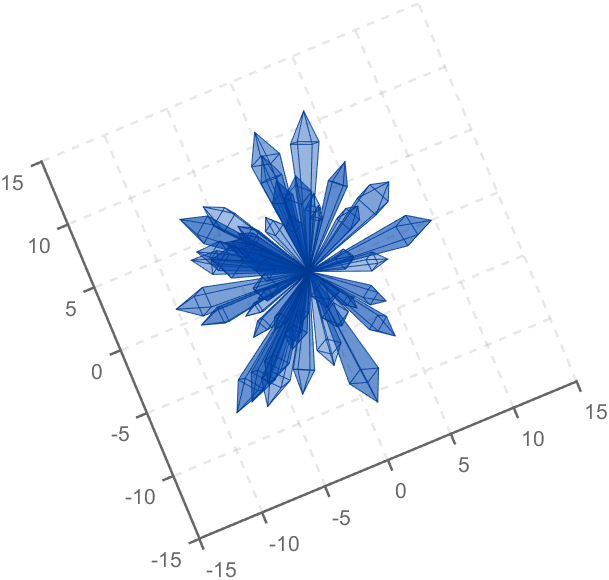
To draw a crystal heart, one must first be able to draw crystal clusters. To draw a crystal cluster, one must first be able to draw a crystal. To draw a crystal, we need this kind of structure:
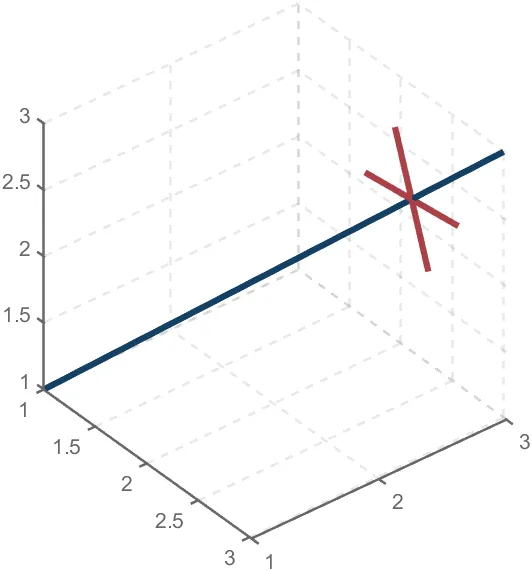
We first need a point with a certain distance from the straight line and a perpendicular point of cutPnt, which is very easy to find, for example, cutPnt=[x0, y0, z0]; The direction of the central axis is V=[x1, y1, z1]; If the distance to the straight line is L, the following points clearly meet the conditions:
v2=[z1,z1,-x1-y1];
v2=v2./norm(v2).*L;
pnt=cutPnt+v2;
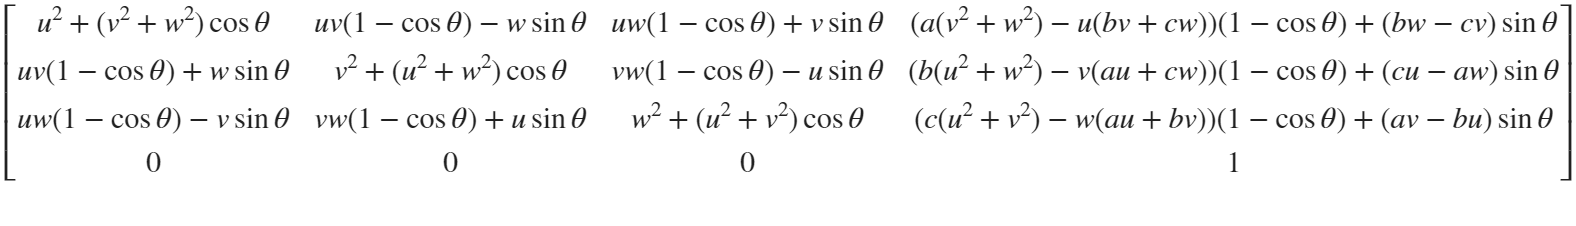
But finding only one point is not enough. We need to find four points, and each point is obtained by rotating the previous point around a straight line by  degrees. Therefore, we need to obtain our point rotation transformation matrix around a straight line
quite complex,right?
rotateMat=[u^2+(v^2+w^2)*cos(theta) , u*v*(1-cos(theta))-w*sin(theta), u*w*(1-cos(theta))+v*sin(theta), (a*(v^2+w^2)-u*(b*v+c*w))*(1-cos(theta))+(b*w-c*v)*sin(theta);
u*v*(1-cos(theta))+w*sin(theta), v^2+(u^2+w^2)*cos(theta) , v*w*(1-cos(theta))-u*sin(theta), (b*(u^2+w^2)-v*(a*u+c*w))*(1-cos(theta))+(c*u-a*w)*sin(theta);
u*w*(1-cos(theta))-v*sin(theta), v*w*(1-cos(theta))+u*sin(theta), w^2+(u^2+v^2)*cos(theta) , (c*(u^2+v^2)-w*(a*u+b*v))*(1-cos(theta))+(a*v-b*u)*sin(theta);
0 , 0 , 0 , 1];
Where [u, v, w] is the directional unit vector, and [a, b, c] is the initial coordinate of the axis:
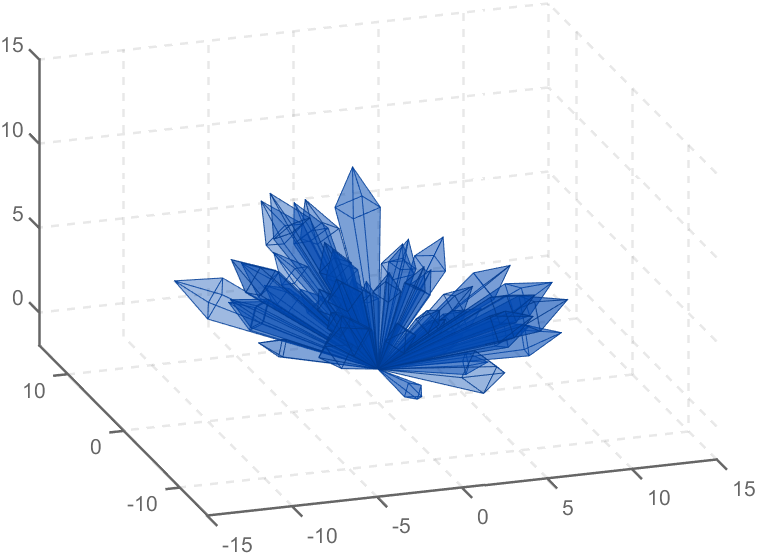
Part 2. Crystal Cluster Drawing
function crystall
hold on
for i=1:50
len=rand(1)*8+5;
tempV=rand(1,3)-0.5;
tempV(3)=abs(tempV(3));
tempV=tempV./norm(tempV).*len;
tempEpnt=tempV;
drawCrystal([0 0 0],tempEpnt,pi/6,0.8,0.1,rand(1).*0.2+0.2)
disp(i)
end
ax=gca;
ax.XLim=[-15,15];
ax.YLim=[-15,15];
ax.ZLim=[-2,15];
grid on
ax.GridLineStyle='--';
ax.LineWidth=1.2;
ax.XColor=[1,1,1].*0.4;
ax.YColor=[1,1,1].*0.4;
ax.ZColor=[1,1,1].*0.4;
ax.DataAspectRatio=[1,1,1];
ax.DataAspectRatioMode='manual';
ax.CameraPosition=[-67.6287 -204.5276 82.7879];
function drawCrystal(Spnt,Epnt,theta,cl,w,alpha)
%plot3([Spnt(1),Epnt(1)],[Spnt(2),Epnt(2)],[Spnt(3),Epnt(3)])
mainV=Epnt-Spnt;
cutPnt=cl.*(mainV)+Spnt;
cutV=[mainV(3),mainV(3),-mainV(1)-mainV(2)];
cutV=cutV./norm(cutV).*w.*norm(mainV);
cornerPnt=cutPnt+cutV;
cornerPnt=rotateAxis(Spnt,Epnt,cornerPnt,theta);
cornerPntSet(1,:)=cornerPnt';
for ii=1:3
cornerPnt=rotateAxis(Spnt,Epnt,cornerPnt,pi/2);
cornerPntSet(ii+1,:)=cornerPnt';
end
F = [1,3,4;1,4,5;1,5,6;1,6,3;...
2,3,4;2,4,5;2,5,6;2,6,3];
V = [Spnt;Epnt;cornerPntSet];
patch('Faces',F,'Vertices',V,'FaceColor',[0 71 177]./255,...
'FaceAlpha',alpha,'EdgeColor',[0 71 177]./255.*0.8,...
'EdgeAlpha',0.6,'LineWidth',0.5,'EdgeLighting',...
'gouraud','SpecularStrength',0.3)
end
function newPnt=rotateAxis(Spnt,Epnt,cornerPnt,theta)
V=Epnt-Spnt;V=V./norm(V);
u=V(1);v=V(2);w=V(3);
a=Spnt(1);b=Spnt(2);c=Spnt(3);
cornerPnt=[cornerPnt(:);1];
rotateMat=[u^2+(v^2+w^2)*cos(theta) , u*v*(1-cos(theta))-w*sin(theta), u*w*(1-cos(theta))+v*sin(theta), (a*(v^2+w^2)-u*(b*v+c*w))*(1-cos(theta))+(b*w-c*v)*sin(theta);
u*v*(1-cos(theta))+w*sin(theta), v^2+(u^2+w^2)*cos(theta) , v*w*(1-cos(theta))-u*sin(theta), (b*(u^2+w^2)-v*(a*u+c*w))*(1-cos(theta))+(c*u-a*w)*sin(theta);
u*w*(1-cos(theta))-v*sin(theta), v*w*(1-cos(theta))+u*sin(theta), w^2+(u^2+v^2)*cos(theta) , (c*(u^2+v^2)-w*(a*u+b*v))*(1-cos(theta))+(a*v-b*u)*sin(theta);
0 , 0 , 0 , 1];
newPnt=rotateMat*cornerPnt;
newPnt(4)=[];
end
end
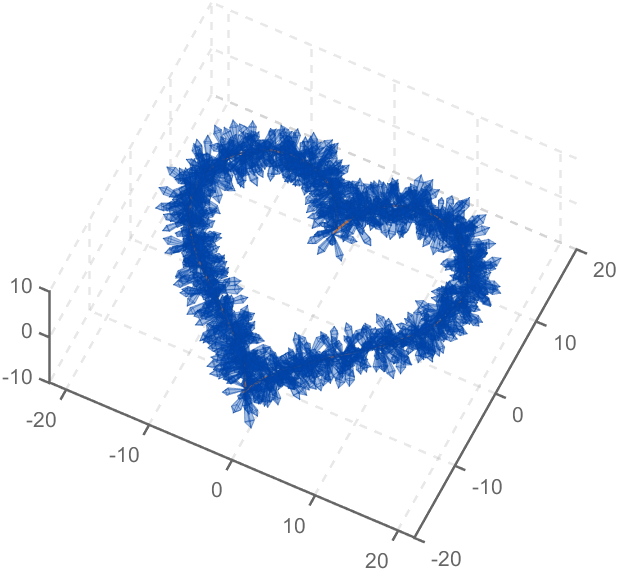
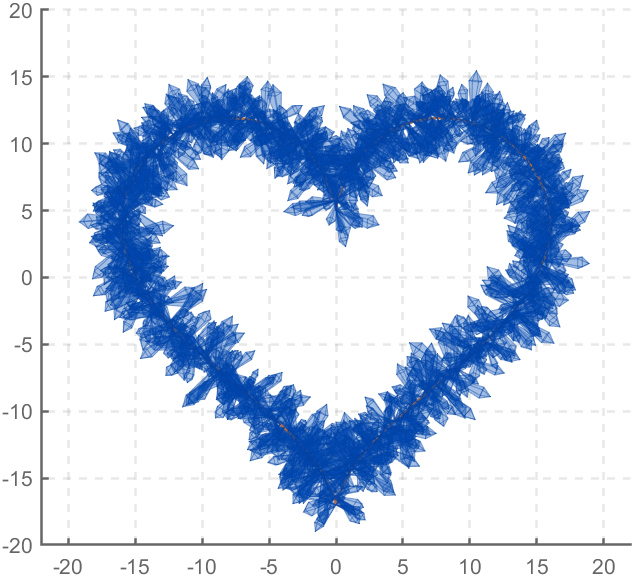
Part 3. Drawing of Crystal Heart
function crystalHeart
clc;clear;close all
hold on
% drawCrystal([1,1,1],[3,3,3],pi/6,0.8,0.14)
sep=pi/8;
t=[0:0.2:sep,sep:0.02:pi-sep,pi-sep:0.2:pi+sep,pi+sep:0.02:2*pi-sep,2*pi-sep:0.2:2*pi];
x=16*sin(t).^3;
y=13*cos(t)-5*cos(2*t)-2*cos(3*t)-cos(4*t);
z=zeros(size(t));
plot3(x,y,z,'Color',[186,110,64]./255,'LineWidth',1)
for i=1:length(t)
for j=1:6
len=rand(1)*2.5+1.5;
tempV=rand(1,3)-0.5;
tempV=tempV./norm(tempV).*len;
tempSpnt=[x(i),y(i),z(i)];
tempEpnt=tempV+tempSpnt;
drawCrystal(tempSpnt,tempEpnt,pi/6,0.8,0.14)
disp([i,j])
end
end
ax=gca;
ax.XLim=[-22,22];
ax.YLim=[-20,20];
ax.ZLim=[-10,10];
grid on
ax.GridLineStyle='--';
ax.LineWidth=1.2;
ax.XColor=[1,1,1].*0.4;
ax.YColor=[1,1,1].*0.4;
ax.ZColor=[1,1,1].*0.4;
ax.DataAspectRatio=[1,1,1];
ax.DataAspectRatioMode='manual';
function drawCrystal(Spnt,Epnt,theta,cl,w)
%plot3([Spnt(1),Epnt(1)],[Spnt(2),Epnt(2)],[Spnt(3),Epnt(3)])
mainV=Epnt-Spnt;
cutPnt=cl.*(mainV)+Spnt;
cutV=[mainV(3),mainV(3),-mainV(1)-mainV(2)];
cutV=cutV./norm(cutV).*w.*norm(mainV);
cornerPnt=cutPnt+cutV;
cornerPnt=rotateAxis(Spnt,Epnt,cornerPnt,theta);
cornerPntSet(1,:)=cornerPnt';
for ii=1:3
cornerPnt=rotateAxis(Spnt,Epnt,cornerPnt,pi/2);
cornerPntSet(ii+1,:)=cornerPnt';
end
F = [1,3,4;1,4,5;1,5,6;1,6,3;...
2,3,4;2,4,5;2,5,6;2,6,3];
V = [Spnt;Epnt;cornerPntSet];
patch('Faces',F,'Vertices',V,'FaceColor',[0 71 177]./255,...
'FaceAlpha',0.2,'EdgeColor',[0 71 177]./255.*0.9,...
'EdgeAlpha',0.25,'LineWidth',0.01,'EdgeLighting',...
'gouraud','SpecularStrength',0.3)
end
function newPnt=rotateAxis(Spnt,Epnt,cornerPnt,theta)
V=Epnt-Spnt;V=V./norm(V);
u=V(1);v=V(2);w=V(3);
a=Spnt(1);b=Spnt(2);c=Spnt(3);
cornerPnt=[cornerPnt(:);1];
rotateMat=[u^2+(v^2+w^2)*cos(theta) , u*v*(1-cos(theta))-w*sin(theta), u*w*(1-cos(theta))+v*sin(theta), (a*(v^2+w^2)-u*(b*v+c*w))*(1-cos(theta))+(b*w-c*v)*sin(theta);
u*v*(1-cos(theta))+w*sin(theta), v^2+(u^2+w^2)*cos(theta) , v*w*(1-cos(theta))-u*sin(theta), (b*(u^2+w^2)-v*(a*u+c*w))*(1-cos(theta))+(c*u-a*w)*sin(theta);
u*w*(1-cos(theta))-v*sin(theta), v*w*(1-cos(theta))+u*sin(theta), w^2+(u^2+v^2)*cos(theta) , (c*(u^2+v^2)-w*(a*u+b*v))*(1-cos(theta))+(a*v-b*u)*sin(theta);
0 , 0 , 0 , 1];
newPnt=rotateMat*cornerPnt;
newPnt(4)=[];
end
end
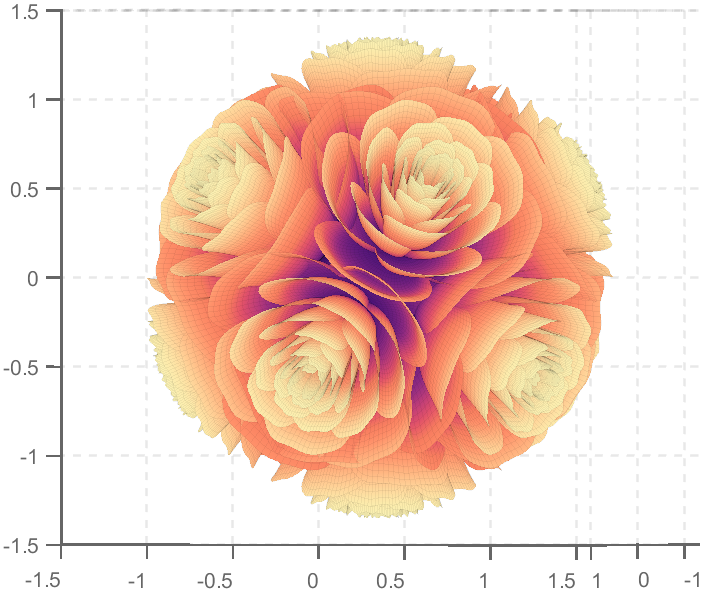
So, how to draw a roseball just like this ?
To begin with, we need to know how to draw a single rose in MATLAB:
function drawrose
set(gca,'CameraPosition',[2 2 2])
hold on
grid on
[x,t]=meshgrid((0:24)./24,(0:0.5:575)./575.*20.*pi+4*pi);
p=(pi/2)*exp(-t./(8*pi));
change=sin(15*t)/150;
u=1-(1-mod(3.6*t,2*pi)./pi).^4./2+change;
y=2*(x.^2-x).^2.*sin(p);
r=u.*(x.*sin(p)+y.*cos(p));
h=u.*(x.*cos(p)-y.*sin(p));
surface(r.*cos(t),r.*sin(t),h,'EdgeAlpha',0.1,...
'EdgeColor',[0 0 0],'FaceColor','interp')
end
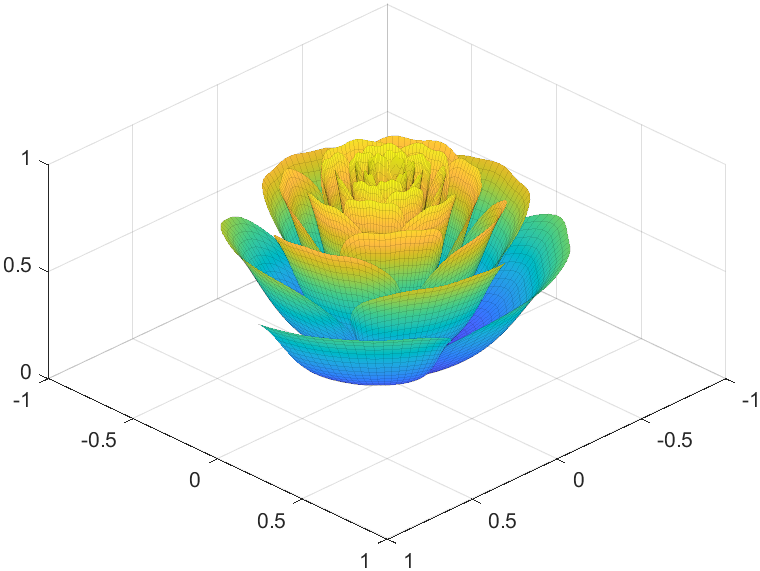
Tts pretty easy, Now we are trying to dye it the desired color:
function drawrose
set(gca,'CameraPosition',[2 2 2])
hold on
grid on
[x,t]=meshgrid((0:24)./24,(0:0.5:575)./575.*20.*pi+4*pi);
p=(pi/2)*exp(-t./(8*pi));
change=sin(15*t)/150;
u=1-(1-mod(3.6*t,2*pi)./pi).^4./2+change;
y=2*(x.^2-x).^2.*sin(p);
r=u.*(x.*sin(p)+y.*cos(p));
h=u.*(x.*cos(p)-y.*sin(p));
map=[0.9176 0.9412 1.0000
0.8353 0.8706 0.9922
0.8196 0.8627 0.9804
0.7020 0.7569 0.9412
0.5176 0.5882 0.9255
0.3686 0.4824 0.9412
0.3059 0.4000 0.9333
0.2275 0.3176 0.8353
0.1216 0.2275 0.6471];
Xi=1:size(map,1);Xq=linspace(1,size(map,1),100);
map=[interp1(Xi,map(:,1),Xq,'linear')',...
interp1(Xi,map(:,2),Xq,'linear')',...
interp1(Xi,map(:,3),Xq,'linear')'];
surface(r.*cos(t),r.*sin(t),h,'EdgeAlpha',0.1,...
'EdgeColor',[0 0 0],'FaceColor','interp')
colormap(map)
end
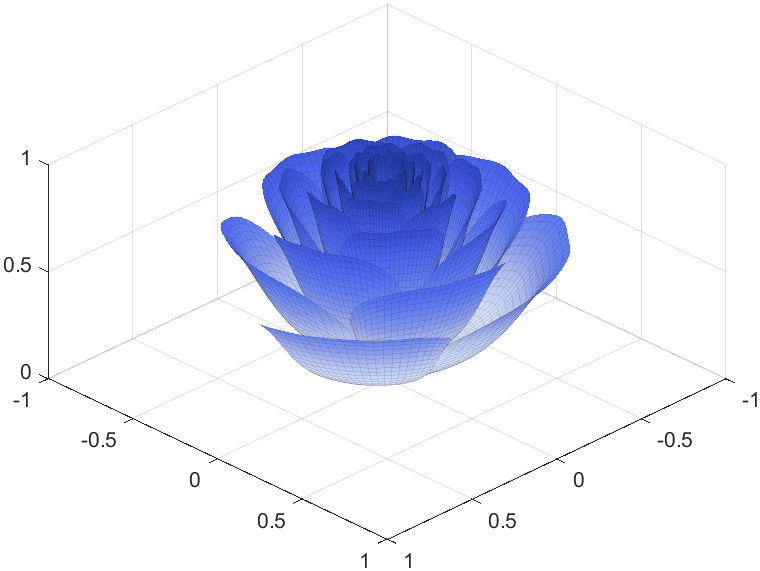
I try to take colors from real roses and interpolate them to make them more realistic
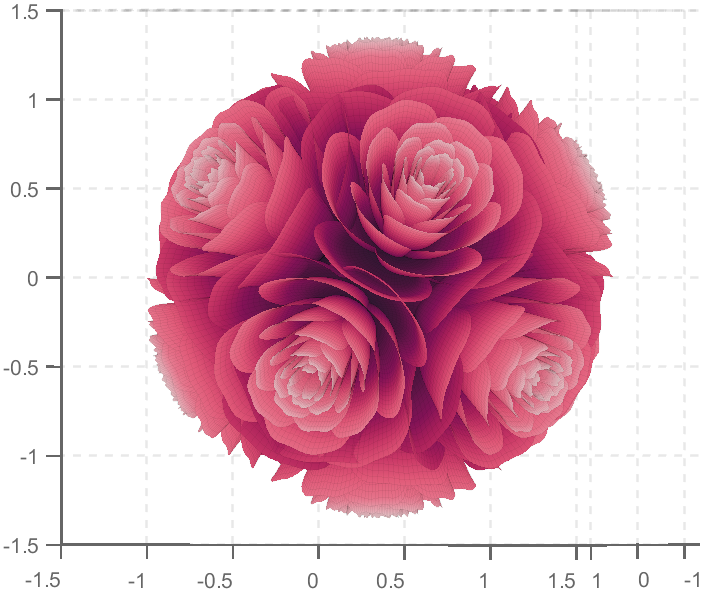
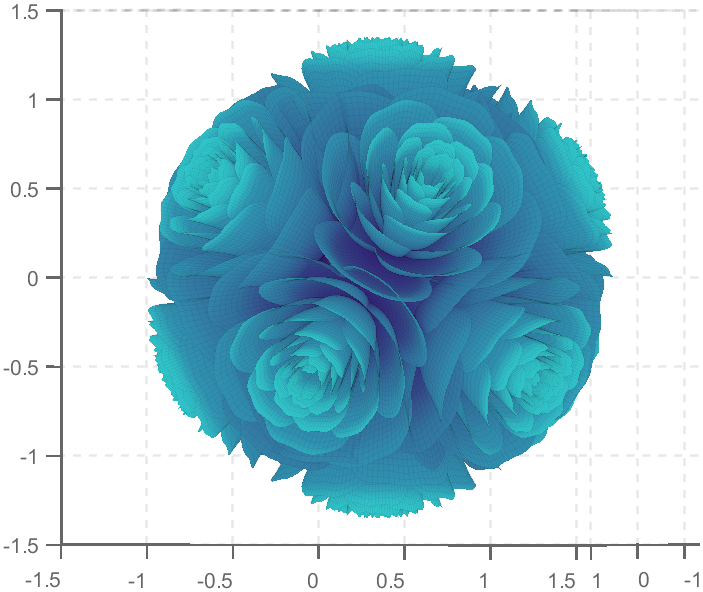
Then, how can I put these colorful flowers on to a ball ?
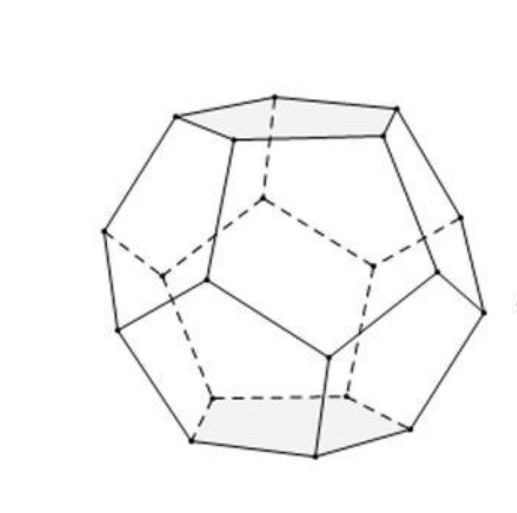
We need to place the drawn flowers on each face of the polyhedron sphere through coordinate transformation. Here, we use a regular dodecahedron:
Move the flower using the following rotation formula:
We place a flower on each plane, which means that the angle between every two flowers is  degrees. We can place each flower at the appropriate angle through multiple x-axis rotations and multiple z-axis rotations. The code is as follows:
function roseBall(colorList)
%曲面数据计算
%==========================================================================
[x,t]=meshgrid((0:24)./24,(0:0.5:575)./575.*20.*pi+4*pi);
p=(pi/2)*exp(-t./(8*pi));
change=sin(15*t)/150;
u=1-(1-mod(3.6*t,2*pi)./pi).^4./2+change;
y=2*(x.^2-x).^2.*sin(p);
r=u.*(x.*sin(p)+y.*cos(p));
h=u.*(x.*cos(p)-y.*sin(p));
%颜色映射表
%==========================================================================
hMap=(h-min(min(h)))./(max(max(h))-min(min(h)));
col=size(hMap,2);
if nargin<1
colorList=[0.0200 0.0400 0.3900
0 0.0900 0.5800
0 0.1300 0.6400
0.0200 0.0600 0.6900
0 0.0800 0.7900
0.0100 0.1800 0.8500
0 0.1300 0.9600
0.0100 0.2600 0.9900
0 0.3500 0.9900
0.0700 0.6200 1.0000
0.1700 0.6900 1.0000];
end
colorFunc=colorFuncFactory(colorList);
dataMap=colorFunc(hMap');
colorMap(:,:,1)=dataMap(:,1:col);
colorMap(:,:,2)=dataMap(:,col+1:2*col);
colorMap(:,:,3)=dataMap(:,2*col+1:3*col);
function colorFunc=colorFuncFactory(colorList)
xx=(0:size(colorList,1)-1)./(size(colorList,1)-1);
y1=colorList(:,1);y2=colorList(:,2);y3=colorList(:,3);
colorFunc=@(X)[interp1(xx,y1,X,'linear')',interp1(xx,y2,X,'linear')',interp1(xx,y3,X,'linear')'];
end
%曲面旋转及绘制
%==========================================================================
surface(r.*cos(t),r.*sin(t),h+0.35,'EdgeAlpha',0.05,...
'EdgeColor',[0 0 0],'FaceColor','interp','CData',colorMap)
hold on
surface(r.*cos(t),r.*sin(t),-h-0.35,'EdgeAlpha',0.05,...
'EdgeColor',[0 0 0],'FaceColor','interp','CData',colorMap)
Xset=r.*cos(t);
Yset=r.*sin(t);
Zset=h+0.35;
yaw_z=72*pi/180;
roll_x=pi-acos(-1/sqrt(5));
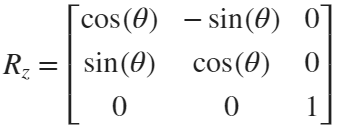
R_z_2=[cos(yaw_z),-sin(yaw_z),0;
sin(yaw_z),cos(yaw_z),0;
0,0,1];
R_z_1=[cos(yaw_z/2),-sin(yaw_z/2),0;
sin(yaw_z/2),cos(yaw_z/2),0;
0,0,1];
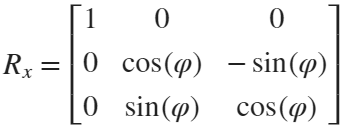
R_x_2=[1,0,0;
0,cos(roll_x),-sin(roll_x);
0,sin(roll_x),cos(roll_x)];
[nX,nY,nZ]=rotateXYZ(Xset,Yset,Zset,R_x_2);
surface(nX,nY,nZ,'EdgeAlpha',0.05,...
'EdgeColor',[0 0 0],'FaceColor','interp','CData',colorMap)
for k=1:4
[nX,nY,nZ]=rotateXYZ(nX,nY,nZ,R_z_2);
surface(nX,nY,nZ,'EdgeAlpha',0.05,...
'EdgeColor',[0 0 0],'FaceColor','interp','CData',colorMap)
end
[nX,nY,nZ]=rotateXYZ(nX,nY,nZ,R_z_1);
for k=1:5
[nX,nY,nZ]=rotateXYZ(nX,nY,nZ,R_z_2);
surface(nX,nY,-nZ,'EdgeAlpha',0.05,...
'EdgeColor',[0 0 0],'FaceColor','interp','CData',colorMap)
end
%--------------------------------------------------------------------------
function [nX,nY,nZ]=rotateXYZ(X,Y,Z,R)
nX=zeros(size(X));
nY=zeros(size(Y));
nZ=zeros(size(Z));
for i=1:size(X,1)
for j=1:size(X,2)
v=[X(i,j);Y(i,j);Z(i,j)];
nv=R*v;
nX(i,j)=nv(1);
nY(i,j)=nv(2);
nZ(i,j)=nv(3);
end
end
end
%axes属性调整
%==========================================================================
ax=gca;
grid on
ax.GridLineStyle='--';
ax.LineWidth=1.2;
ax.XColor=[1,1,1].*0.4;
ax.YColor=[1,1,1].*0.4;
ax.ZColor=[1,1,1].*0.4;
ax.DataAspectRatio=[1,1,1];
ax.DataAspectRatioMode='manual';
ax.CameraPosition=[-6.5914 -24.1625 -0.0384];
end

TRY DIFFERENT COLORS !!
colorList1=[0.2000 0.0800 0.4300
0.2000 0.1300 0.4600
0.2000 0.2100 0.5000
0.2000 0.2800 0.5300
0.2000 0.3700 0.5800
0.1900 0.4500 0.6200
0.2000 0.4800 0.6400
0.1900 0.5400 0.6700
0.1900 0.5700 0.6900
0.1900 0.7500 0.7800
0.1900 0.8000 0.8100
];
colorList2=[0.1300 0.1000 0.1600
0.2000 0.0900 0.2000
0.2800 0.0800 0.2300
0.4200 0.0800 0.3000
0.5100 0.0700 0.3400
0.6600 0.1200 0.3500
0.7900 0.2200 0.4000
0.8800 0.3500 0.4700
0.9000 0.4500 0.5400
0.8900 0.7800 0.7900
];
colorList3=[0.3200 0.3100 0.7600
0.3800 0.3400 0.7600
0.5300 0.4200 0.7500
0.6400 0.4900 0.7300
0.7200 0.5500 0.7200
0.7900 0.6100 0.7100
0.9100 0.7100 0.6800
0.9800 0.7600 0.6700
];
colorList4=[0.2100 0.0900 0.3800
0.2900 0.0700 0.4700
0.4000 0.1100 0.4900
0.5500 0.1600 0.5100
0.7500 0.2400 0.4700
0.8900 0.3200 0.4100
0.9700 0.4900 0.3700
1.0000 0.5600 0.4100
1.0000 0.6900 0.4900
1.0000 0.8200 0.5900
0.9900 0.9200 0.6700
0.9800 0.9500 0.7100];
Let us consider how to draw a Happy Sheep. A Happy Sheep was introduced in the MATLAB Mini Hack contest: Happy Sheep!
In this contest there was the strict limitation on the code length. So the code of the Happy Sheep is very compact and is only 280 characters long. We will analyze the process of drawing the Happy Sheep in MATLAB step by step. The explanations of the even more compact version of the code of the same sheep are given below.
So, how to draw a sheep? It is very easy. We could notice that usually a sheep is covered by crimped wool. Therefore, a sheep could be painted using several geometrical curves of similar types. Of course, then it will be an abstract model of the real sheep. Let us select two mathematical curves, which are the most appropriate for our goal. They are an ellipse for smooth parts of the sheep and an ellipse combined with a rose for woolen parts of the sheep.
Let us recall the mathematical formulas of these curves. A parametric representation of the standard ellipse is the following:
Also we will use the following parametric representation of the rose (rhodonea) curve:
This curve was named by the mathematician Guido Grandi.
Let us combine them in one curve and add possible shifts:
Now if we would like to create an ellipse, we will set  and
and  . If we would like to create a rose, we will set
  and
and  . If we would like to shift our curve, we will set
  and
and  to the required values. Of course, we could set all non-zero parameters to combine both chosen curves and use the shifts.
Let us describe how to create these curves using the MATLAB code. To make the code more compact, it is possible to program both formulas for the combined curve in one line using the anonymous function. We could make the code more compact using the function handles for sine and cosine functions. Then the MATLAB code for an example of the ellipse curve will be the following.
% Handles
s=@sin;
c=@cos;
% Ellipse + Polar Rose
F=@(t,a,f) a(1)*f(t)+s(a(2)*t).*f(t)+a(3);
% Angles
t=0:.1:7;
% Parameters
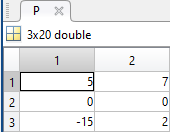
E = [5 7;0 0;0 0];
% Painting
figure;
plot(F(t,E(:,1),c),F(t,E(:,2),s),'LineWidth',10);
axis equal
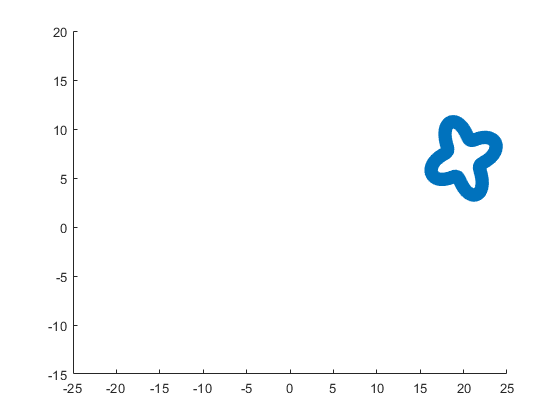
The parameter t varies from 0 to 7, which is the nearest integer greater than  , with the step 0.1. The result of this code is the following ellipse curve with
  and
and  .
.
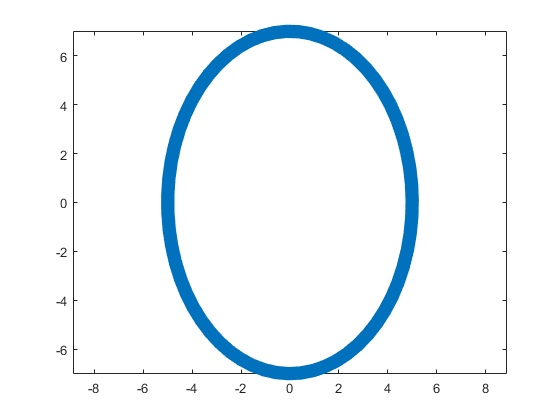
This ellipse is described by the following parametric equations:
The MATLAB code for an example of the rose curve will be the following.
% Handles
s=@sin;
c=@cos;
% Ellipse + Polar Rose
F=@(t,a,f) a(1)*f(t)+s(a(2)*t).*f(t)+a(3);
% Angles
t=0:.1:7;
% Parameters
R = [0 0;4 4;0 0];
% Painting
figure;
plot(F(t,R(:,1),c),F(t,R(:,2),s),'LineWidth',10);
axis equal
The result of this code is the following rose curve with  and
and  .
.
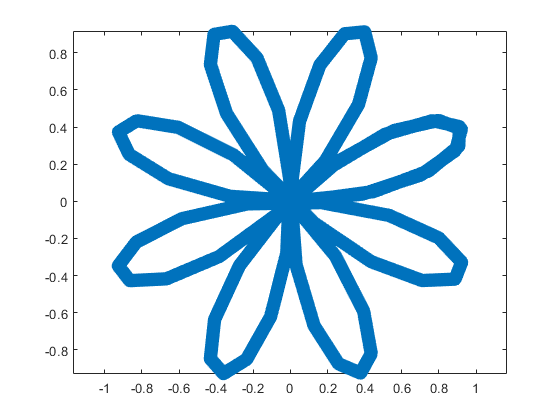
This rose is described by the following parametric equations:
Obviously, now we are ready to draw main parts of our sheep! As we reproduce an abstract model of the sheep, let us select the following main parts for the representation: head, eyes, hoofs, body, crown, and tail. We will use ellipses for the first three parts in this list and ellipses combined with roses for the last three ones.
First let us describe drawing of each part independently.
The following MATLAB code will be used to do this.
% Handles
s=@sin;
c=@cos;
% Ellipse + Polar Rose
F=@(t,a,f) a(1)*f(t)+s(a(2)*t).*f(t)+a(3);
% Angles
t=0:.1:7;
% Parameters
Head = 1;
Eyes = 2:3;
Hoofs = 4:7;
Body = 8;
Crown = 9;
Tail = 10;
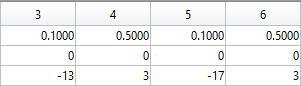
G=-13;
P=[5 7 repmat([.1 .5],1,6) 6 4 14 9 3 3;zeros(1,14) 8 8 12 12 4 4;...
-15 2 G 3 -17 3 -3 G 0 G 9 G 12 G -15 12 4 3 20 7];
% Painting
figure;
hold;
for i=Head
plot(F(t,P(:,2*i-1),c),F(t,P(:,2*i),s),'LineWidth',10);
end
axis([-25 25 -15 20]);
figure;
hold;
for i=Eyes
plot(F(t,P(:,2*i-1),c),F(t,P(:,2*i),s),'LineWidth',10);
end
axis([-25 25 -15 20]);
figure;
hold;
for i=Hoofs
plot(F(t,P(:,2*i-1),c),F(t,P(:,2*i),s),'LineWidth',10);
end
axis([-25 25 -15 20]);
figure;
hold;
for i=Body
plot(F(t,P(:,2*i-1),c),F(t,P(:,2*i),s),'LineWidth',10);
end
axis([-25 25 -15 20]);
figure;
hold;
for i=Crown
plot(F(t,P(:,2*i-1),c),F(t,P(:,2*i),s),'LineWidth',10);
end
axis([-25 25 -15 20]);
figure;
hold;
for i=Tail
plot(F(t,P(:,2*i-1),c),F(t,P(:,2*i),s),'LineWidth',10);
end
axis([-25 25 -15 20]);
The parameters  ,
,  ,
,  ,
,  ,
,  , and
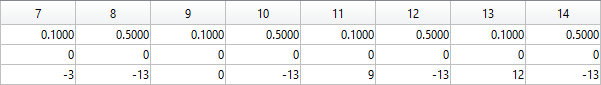
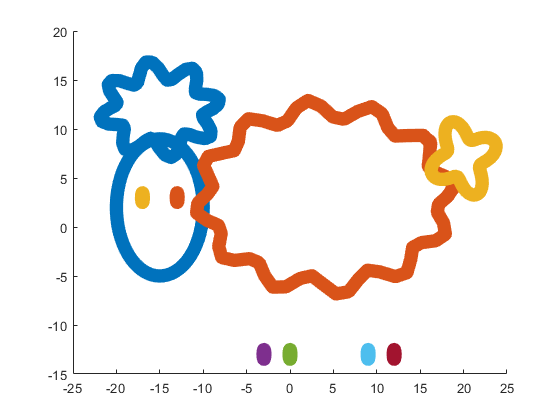
, and  are written in the different submatrices of the matrix P. The code generates the following curves to illustrate the different parts of our sheep.
The following ellipse describes the head of the sheep.
The following submatrix of the matrix P represents its parameters.
The parametric equations of the head are the following:
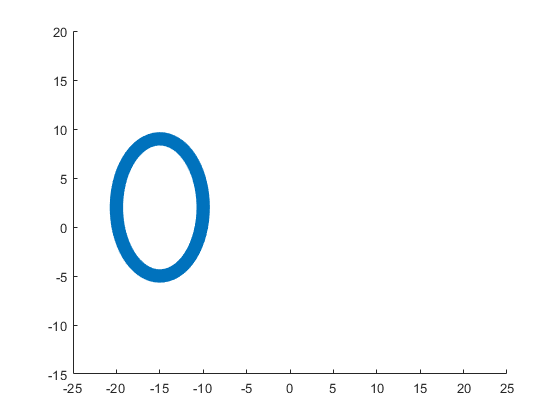
The following ellipses describe the eyes of the sheep.
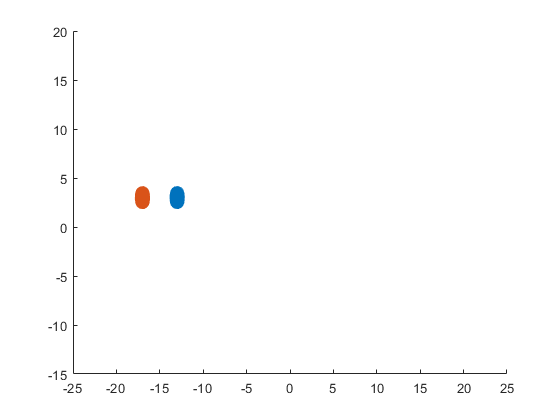
The following submatrices of the matrix P represent their parameters.
The parametric equations of the left and right eyes correspondingly are the following:
The following ellipses describe the hoofs of the sheep.
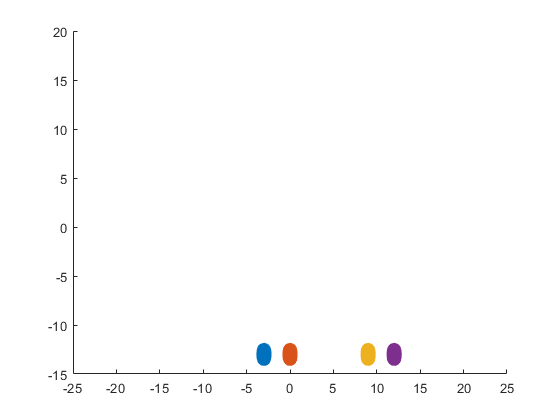
The following submatrices of the matrix P represent their parameters.
The parametric equations of the right front, left front, right hind, and left hind hoofs correspondingly are the following:
The following ellipse combined with the rose describes the crown of the sheep.
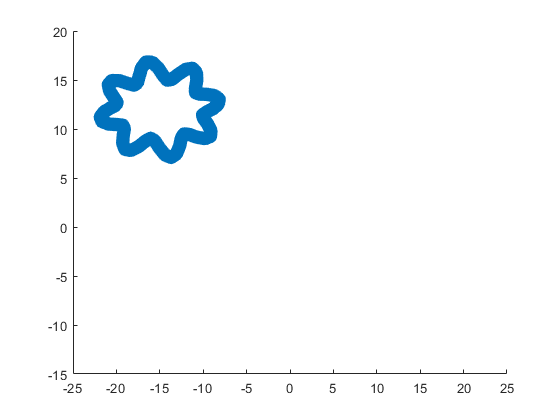
The following submatrix of the matrix P represents its parameters.
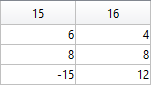
The parametric equations of the crown are the following:
The following ellipse combined with the rose describes the body of the sheep.
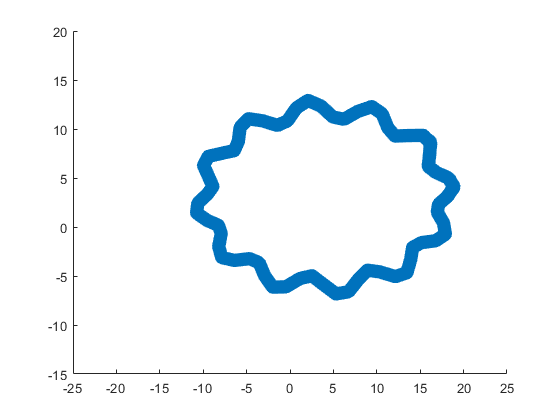
The following submatrix of the matrix P represents its parameters.
The parametric equations of the body are the following:
The following ellipse combined with the rose describes the tail of the sheep.
The following submatrix of the matrix P represents its parameters.
The parametric equations of the tail are the following:
Now all the parts of our sheep should be put together! It is very easy because all the parts are described by the same equations with different parameters.
The following code helps us to accomplish this goal and ultimately draw a Happy Sheep in MATLAB!
% Happy Sheep!
% By Victoria A. Sablina
% Handles
s=@sin;
c=@cos;
% Ellipse + Rose
F=@(t,a,f) a(1)*f(t)+s(a(2)*t).*f(t)+a(3);
% Angles
t=0:.1:7;
% Parameters
% Head (1:2)
% Eyes (3:6)
% Hoofs (7:14)
% Crown (15:16)
% Body (17:18)
% Tail (19:20)
G=-13;
P=[5 7 repmat([.1 .5],1,6) 6 4 14 9 3 3;zeros(1,14) 8 8 12 12 4 4;...
-15 2 G 3 -17 3 -3 G 0 G 9 G 12 G -15 12 4 3 20 7];
% Painting
hold;
for i=1:10
plot(F(t,P(:,2*i-1),c),F(t,P(:,2*i),s),'LineWidth',10);
end
This code is even more compact than the original code from the contest. It is only 253 instead of 280 characters long and generates the same Happy Sheep!
Our sheep is happy, because of becoming famous in the MATLAB community, a star!
Congratulations! Now you know how to draw a Happy Sheep in MATLAB!
Thank you for reading!
Hello, I am using an Arduino UNO R3 with an ESP8266 WiFi Shield to connect 2 DHT-11 sensors to upload their data to ThingSpeak. Sometimes ThingSpeak would only post data on a certain sensor for a bit and then upload to the other randomly. I want ThingSpeak to pick up the sensors within 30-40 seconds of each other consistently. I believe there might be something wrong with my code. I was hoping to get some help on it. Anything is appreciated.
Below is provided code
SoftwareSerial esp8266(RX,TX);
void setup() {
Serial.begin(9600);
esp8266.begin(38400);
sendCommand("AT",5,"OK");
sendCommand("AT+CWMODE=1",5,"OK");
sendCommand("AT+CWJAP=\""+ AP +"\",\""+ PASS +"\"",20,"OK");
}
void loop() {
String getData = "GET /update?api_key="+ API +"&field1="+getTemperatureValue()+"&field2="+getHumidityValue();
sendCommand("AT+CIPMUX=1",5,"OK");
sendCommand("AT+CIPSTART=0,\"TCP\",\""+ HOST +"\","+ PORT,15,"OK");
sendCommand("AT+CIPSEND=0," +String(getData.length()+4),4,">");
esp8266.println(getData);delay(6000);countTrueCommand++;
String getData2 = "GET /update?api_key="+ API +"&field3="+getTemperatureValue2()+"&field4="+getHumidityValue2();
sendCommand("AT+CIPMUX=1",5,"OK");
sendCommand("AT+CIPSTART=0,\"TCP\",\""+ HOST +"\","+ PORT,15,"OK");
sendCommand("AT+CIPSEND=0," +String(getData2.length()+4),4,">");
esp8266.println(getData2);delay(6000);countTrueCommand++;
sendCommand("AT+CIPCLOSE=0",5,"OK");
}
String getTemperatureValue(){
dhtObject.read(dht_apin);
Serial.print(" Temperature(C)= ");
int temp = dhtObject.temperature;
Serial.println(temp);
delay(50);
return String(temp);
}
String getHumidityValue(){
dhtObject.read(dht_apin);
Serial.print(" Humidity in %= ");
int humidity = dhtObject.humidity;
Serial.println(humidity);
delay(50);
return String(humidity);
}
String getTemperatureValue2(){
dhtObject2.read(dht_bpin);
Serial.print(" Temperature(C)= ");
int temp2 = dhtObject2.temperature;
Serial.println(temp2);
delay(50);
return String(temp2);
}
String getHumidityValue2(){
dhtObject2.read(dht_bpin);
Serial.print(" Humidity in %= ");
int humidity2 = dhtObject2.humidity;
Serial.println(humidity2);
delay(50);
return String(humidity2);
}
void sendCommand(String command, int maxTime, char readReplay[]) {
Serial.print(countTrueCommand);
Serial.print(". at command => ");
Serial.print(command);
Serial.print(" ");
while(countTimeCommand < (maxTime*1))
{
esp8266.println(command);//at+cipsend
if(esp8266.find(readReplay))//ok
{
found = true;
break;
}
countTimeCommand++;
}
if(found == true)
{
Serial.println("Pass");
countTrueCommand++;
countTimeCommand = 0;
}
if(found == false)
{
Serial.println("Fail");
countTrueCommand = 0;
countTimeCommand = 0;
}
found = false;
}
Due to temporary problem MathWorks account was unable to login. Kindly resolve this issue.
how to generate CA signed certificate for mqtt
MATLAB O/X Quiz
Answer BEFORE Googling!
- An infinite loop can be made using "for".
- "A == A" is always true.
- "round(2.5)" is 3.
- "round(-0.5)" is 0.
When I embed Matlab windows into C#, I use C# to call the mouse functions such as drawline() and getpts() which are encapsulated in Matlab's dll, and then the program crashes, how can I solve this problem?
ps : The functions that I call in C# can be executed in Matlab.
ps : If I don't embed the window into C#, but just let C# call the Matlab function, it can execute the mouse control normally in the window, but once embedded into the C# window, it will crash when execute the mouse command.
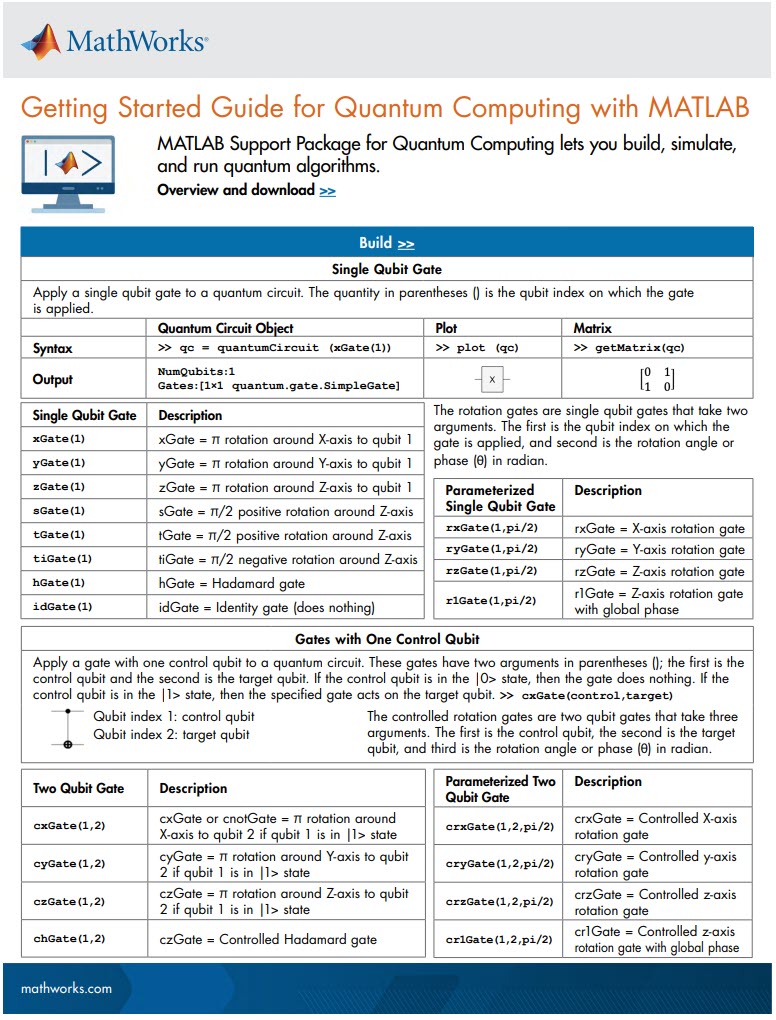
MATLAB Support Package for Quantum Computing lets you build, simulate, and run quantum algorithms.
Check out the Cheat Sheet here!
I have a channel updating every 10 minutes. The last 8000 entries therefore go back to late December (around 55 days). I want to extend the range of data downloaded by setting a timescale between results, so say if I request a timescale of 20 minutes should I not be able to get data from twice as long ago? e.g.
https://api.thingspeak.com/channels/xxxxxx/fields/1.json?api_key=XXXXXXXXXXX×cale=20&start=2022-12-30%2022:00:00
No matter what timescale or averaging I use, the last 8000 entries are the only ones processed for the downloaded data, so I just get fewer results. Unless I use a timescale of 1440; then I can download results from the very first entry in 2022. A timescale of 720 or lower however will only go back 55 days.
So I see the desired result when I use a timescale of 1440, but no other timescale will work. Is this a bug?
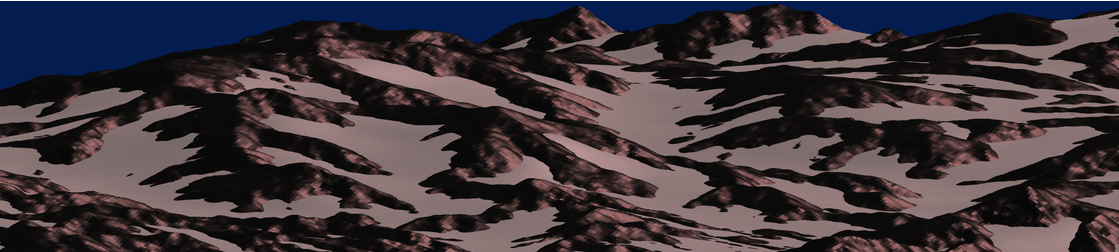
I think that MATLAB's Flipbook Mini Hack had quite some inspiring entries. My work largely deals with digital elevation models (DEMs). Hence I really liked the random renderings of landscapes, in particular this one written by Tim which inspired me to adopt the code and apply to the example data that comes with my software TopoToolbox. The results and code are shown here.
and immeditaely everyone wanted the code! It turns out that this is the result of my remix of @Zhaoxu Liu / slandarer's entry on the MATLAB Flipbook Mini Hack.
I pointed people to the Flipbook entry but, of course, that just gave the code to render a single frame and people wanted the full code to render the animated gif. That way, they could make personalised versions
I just published a blog post that gives the code used by the team behind the Mini Hack to produce the animated .gifs https://blogs.mathworks.com/matlab/2024/02/16/producing-animated-gifs-from-matlab-flipbook-mini-hack-entries/
Thanks again to @Zhaoxu Liu / slandarer for a great entry that seems like it will live for a long time :)
If you've dabbled in "procedural generation," (algorithmically generating natural features), you may have come across the problem of sphere texturing. How to seamlessly texture a sphere is not immediately obvious. Watch what happens, for example, if you try adding power law noise to an evenly sampled grid of spherical angle coordinates (i.e. a "UV sphere" in Blender-speak):
% Example: how [not] to texture a sphere:
rng(2, 'twister'); % Make what I have here repeatable for you
% Make our radial noise, mapped onto an equal spaced longitude and latitude
% grid.
N = 51;
b = linspace(-1, 1, N).^2;
r = abs(ifft2(exp(6i*rand(N))./(b'+b+1e-5))); % Power law noise
r = rescale(r, 0, 1) + 5;
[lon, lat] = meshgrid(linspace(0, 2*pi, N), linspace(-pi/2, pi/2, N));
[x2, y2, z2] = sph2cart(lon, lat, r);
r2d = @(x)x*180/pi;
% Radial surface texture
subplot(1, 3, 1);
imagesc(r, 'Xdata', r2d(lon(1,:)), 'Ydata', r2d(lat(:, 1)));
xlabel('Longitude (Deg)');
ylabel('Latitude (Deg)');
title('Texture (radial variation)');
% View from z axis
subplot(1, 3, 2);
surf(x2, y2, z2, r);
axis equal
view([0, 90]);
title('Top view');
% Side view
subplot(1, 3, 3);
surf(x2, y2, z2, r);
axis equal
view([-90, 0]);
title('Side view');
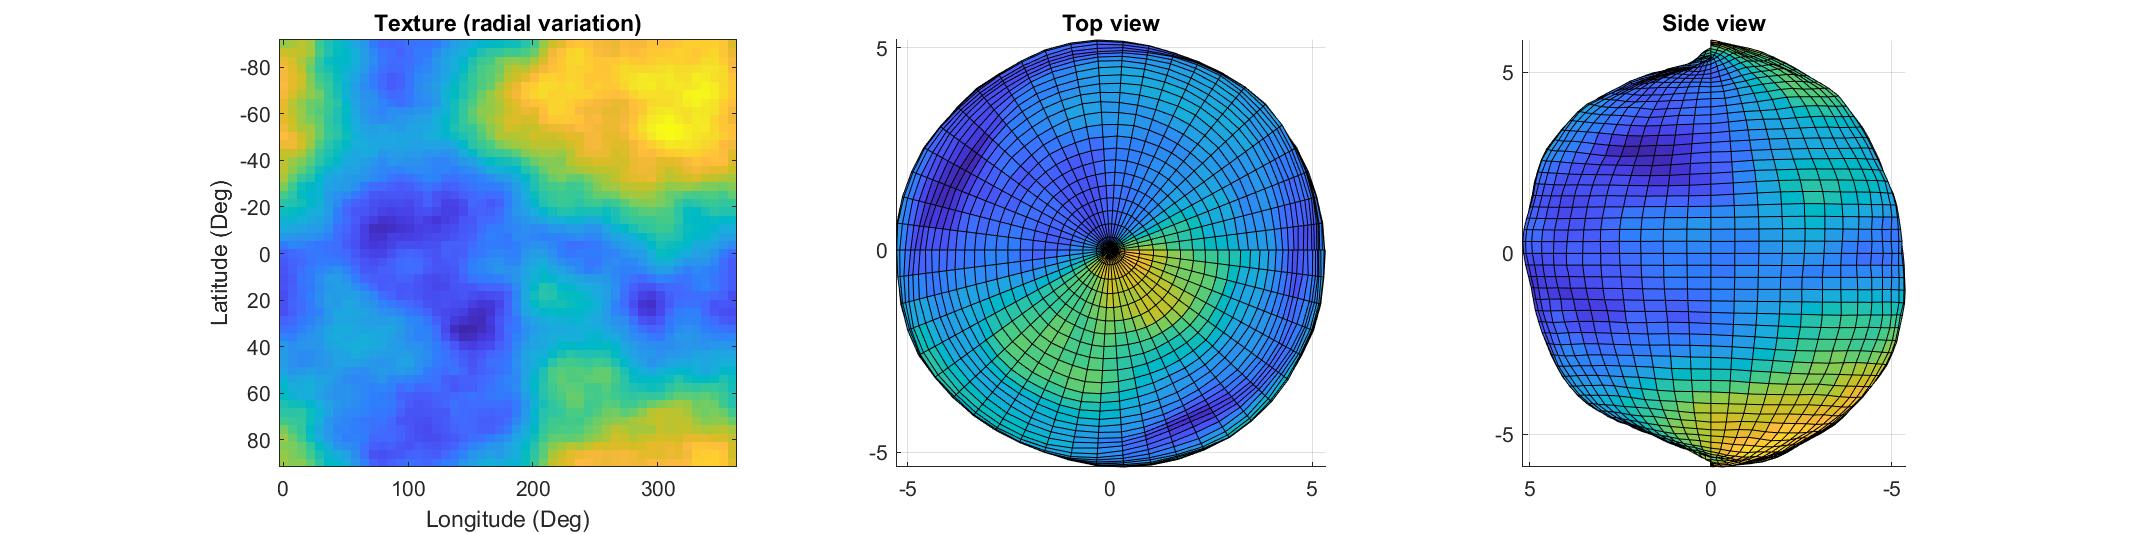
The created surface shows "pinching" at the poles due to different radial values mapping to the same location. Furthermore, the noise statistics change based on the density of the sampling on the surface.
How can this be avoided? One standard method is to create a textured volume and sample the volume at points on a sphere. Code for doing this is quite simple:
rng default % Make our noise realization repeatable
% Create our 3D power-law noise
N = 201;
b = linspace(-1, 1, N);
[x3, y3, z3] = meshgrid(b, b, b);
b3 = x3.^2 + y3.^2 + z3.^2;
r = abs(ifftn(ifftshift(exp(6i*randn(size(b3)))./(b3.^1.2 + 1e-6))));
% Modify it - make it more interesting
r = rescale(r);
r = r./(abs(r - 0.5) + .1);
% Sample on a sphere
[x, y, z] = sphere(500);
% Plot
ir = interp3(x3, y3, z3, r, x, y, z, 'linear', 0);
surf(x, y, z, ir);
shading flat
axis equal off
set(gcf, 'color', 'k');
colormap(gray);
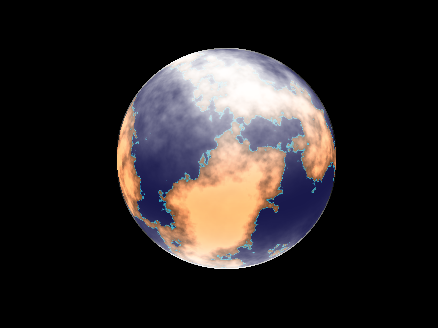
The result of evaluating this code is a seamless, textured sphere with no discontinuities at the poles or variation in the spatial statistics of the noise texture:
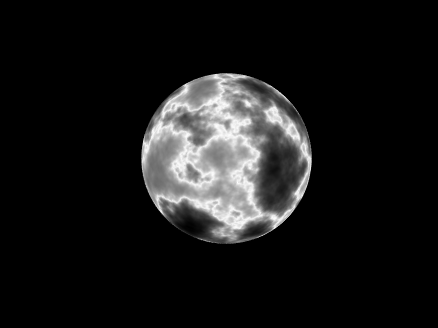
But what if you want to smooth it or perform some other local texture modification? Smoothing the volume and resampling is not equivalent to smoothing the surficial features shown on the map above.
A more flexible alternative is to treat the samples on the sphere surface as a set of interconnected nodes that are influenced by adjacent values. Using this approach we can start by defining the set of nodes on a sphere surface. These can be sampled almost arbitrarily, though the noise statistics will vary depending on the sampling strategy.
One noise realisation I find attractive can be had by randomly sampling a sphere. Normalizing a point in N-dimensional space by its 2-norm projects it to the surface of an N-dimensional unit sphere, so randomly sampling a sphere can be done very easily using randn() and vecnorm():
N = 5e3; % Number of nodes on our sphere
g=randn(3,N); % Random 3D points around origin
p=g./vecnorm(g); % Projected to unit sphere
The next step is to find each point's "neighbors." The first step is to find the convex hull. Since each point is on the sphere, the convex hull will include each point as a vertex in the triangulation:
k=convhull(p');
In the above, k is an N x 3 set of indices where each row represents a unique triangle formed by a triplicate of points on the sphere surface. The vertices of the full set of triangles containing a point describe the list of neighbors to that point.
What we want now is a large, sparse symmetric matrix where the indices of the columns & rows represent the indices of the points on the sphere and the nth row (and/or column) contains non-zero entries at the indices corresponding to the neighbors of the nth point.
How to do this? You could set up a tiresome nested for-loop searching for all rows (triangles) in k that contain some index n, or you could directly index via:
c=@(x)sparse(k(:,x)*[1,1,1],k,1,N,N);
t=c(1)|c(2)|c(3);
The result is the desired sparse connectivity matrix: a matrix with non-zero entries defining neighboring points.
So how do we create a textured sphere with this connectivity matrix? We will use it to form a set of equations that, when combined with the concept of "regularization," will allow us to determine the properties of the randomness on the surface. Our regularizer will penalize the difference of the radial distance of a point and the average of its neighbors. To do this we replace the main diagonal with the negative of the sum of the off-diagonal components so that the rows and columns are zero-mean. This can be done via:
w=spdiags(-sum(t,2)+1,0,double(t));
Now we invoke a bit of linear algebra. Pretend x is an N-length vector representing the radial distance of each point on our sphere with the noise realization we desire. Y will be an N-length vector of "observations" we are going to generate randomly, in this case using a uniform distribution (because it has a bias and we want a non-zero average radius, but you can play around with different distributions than uniform to get different effects):
Y=rand(N,1);
and A is going to be our "transformation" matrix mapping x to our noisy observations:
Ax = Y
In this case both x and Y are N length vectors and A is just the identity matrix:
A = speye(N);
Y, however, doesn't create the noise realization we want. So in the equation above, when solving for x we are going to introduce a regularizer which is going to penalize unwanted behavior of x by some amount. That behavior is defined by the point-neighbor radial differences represented in matrix w. Our estimate of x can then be found using one of my favorite Matlab assets, the "\" operator:
smoothness = 10; % Smoothness penalty: higher is smoother
x = (A+smoothness*w'*w)\Y; % Solving for radii
The vector x now contains the radii with the specified noise realization for the sphere which can be created simply by multiplying x by p and plotting using trisurf:
p2 = p.*x';
trisurf(k,p2(1,:),p2(2,:),p2(3,:),'FaceC', 'w', 'EdgeC', 'none','AmbientS',0,'DiffuseS',0.6,'SpecularS',1);
light;
set(gca, 'color', 'k');
axis equal
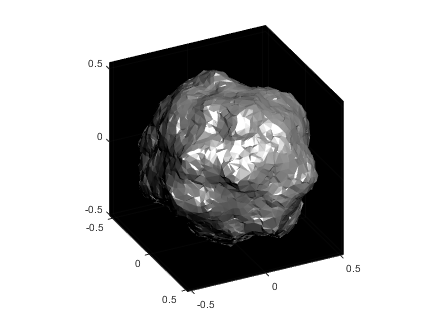
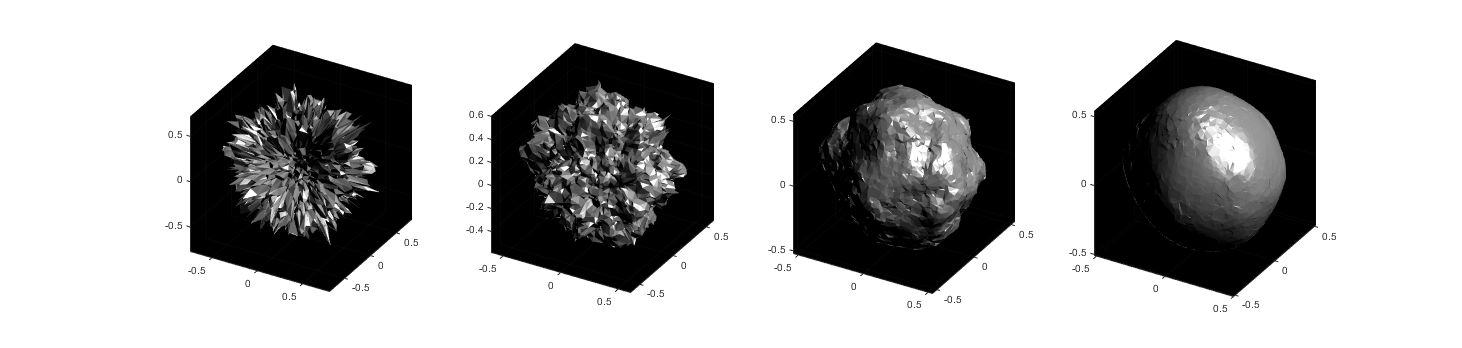
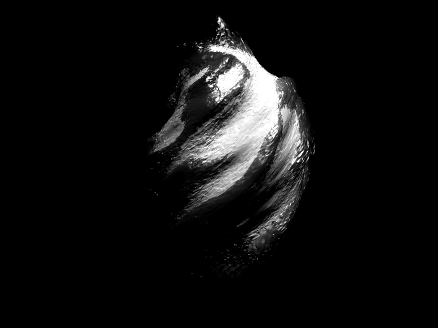
The following images show what happens as you change the smoothness parameter using values [.1, 1, 10, 100] (left to right):
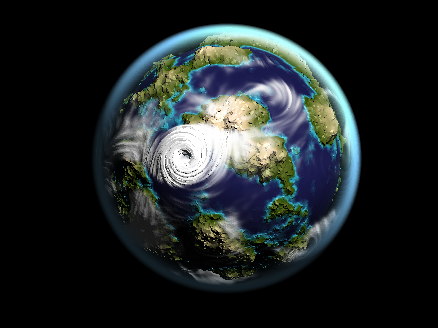
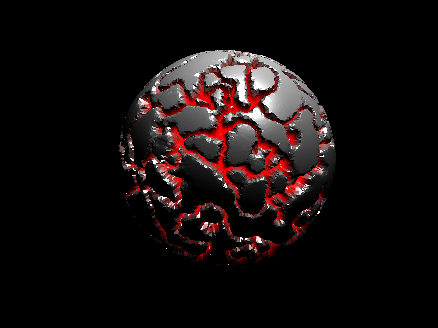
Now you know a couple ways to make a textured sphere: that's the starting point for having a lot of fun with basic procedural planet, moon, or astroid generation! Here's some examples of things you can create based on these general ideas:
The MATLAB command window isn't just for commands and outputs—it can also host interactive hyperlinks. These can serve as powerful shortcuts, enhancing the feedback you provide during code execution. Here are some hyperlinks I frequently use in fprintf statements, warnings, or error messages.
1. Open a website.
msg = "Could not download data from website.";
url = "https://blogs.mathworks.com/graphics-and-apps/";
hypertext = "Go to website"
fprintf(1,'%s <a href="matlab: web(''%s'') ">%s</a>\n',msg,url,hypertext);
Could not download data from website. Go to website
2. Open a folder in file explorer (Windows)
msg = "File saved to current directory.";
directory = cd();
hypertext = "[Open directory]";
fprintf(1,'%s <a href="matlab: winopen(''%s'') ">%s</a>\n',msg,directory,hypertext)
File saved to current directory. [Open directory]
3. Open a document (Windows)
msg = "Created database.csv.";
filepath = fullfile(cd,'database.csv');
hypertext = "[Open file]";
fprintf(1,'%s <a href="matlab: winopen(''%s'') ">%s</a>\n',msg,filepath,hypertext)
Created database.csv. [Open file]
4. Open an m-file and go to a specific line
msg = 'Go to';
file = 'streamline.m';
line = 51;
fprintf(1,'%s <a href="matlab: matlab.desktop.editor.openAndGoToLine(which(''%s''), %d); ">%s line %d</a>', msg, file, line, file, line);
Go to streamline.m line 51
5. Display more text
msg = 'Incomplete data detected.';
extendedInfo = '\tFilename: m32c4r28\n\tDate: 12/20/2014\n\tElectrode: (3,7)\n\tDepth: ???\n';
hypertext = '[Click for more info]';
warning('%s <a href="matlab: fprintf(''%s'') ">%s</a>', msg,extendedInfo,hypertext);
<click>
- Filename: m32c4r28
- Date: 12/20/2014
- Electrode: (3,7)
- Depth: ???
6. Run a function
Similarly, you can also add hyperlinks in figures and apps
New to ThingsSpeak. I have a Photon 2 and vreated a webhook with simple code to send random numbers reprsented as 'temp' to a channel in ThingSpeak. All good with the code and my device shows the webhook is sending data and the events corespond to the same number of entries received in my channel. However, I do not see any visual graph of the data. What am i missing?
Hi Everyone. I am facing a problem while connecting the FMU to the buses. I have one FMU which expects 9 inputs and I did clarify the same while using bus creator. But in the end i am getting this error which i am trying to solve for couple of hours but didn't get any solution. So if any knows about the same please help me. I would give details as well if you need any other information. 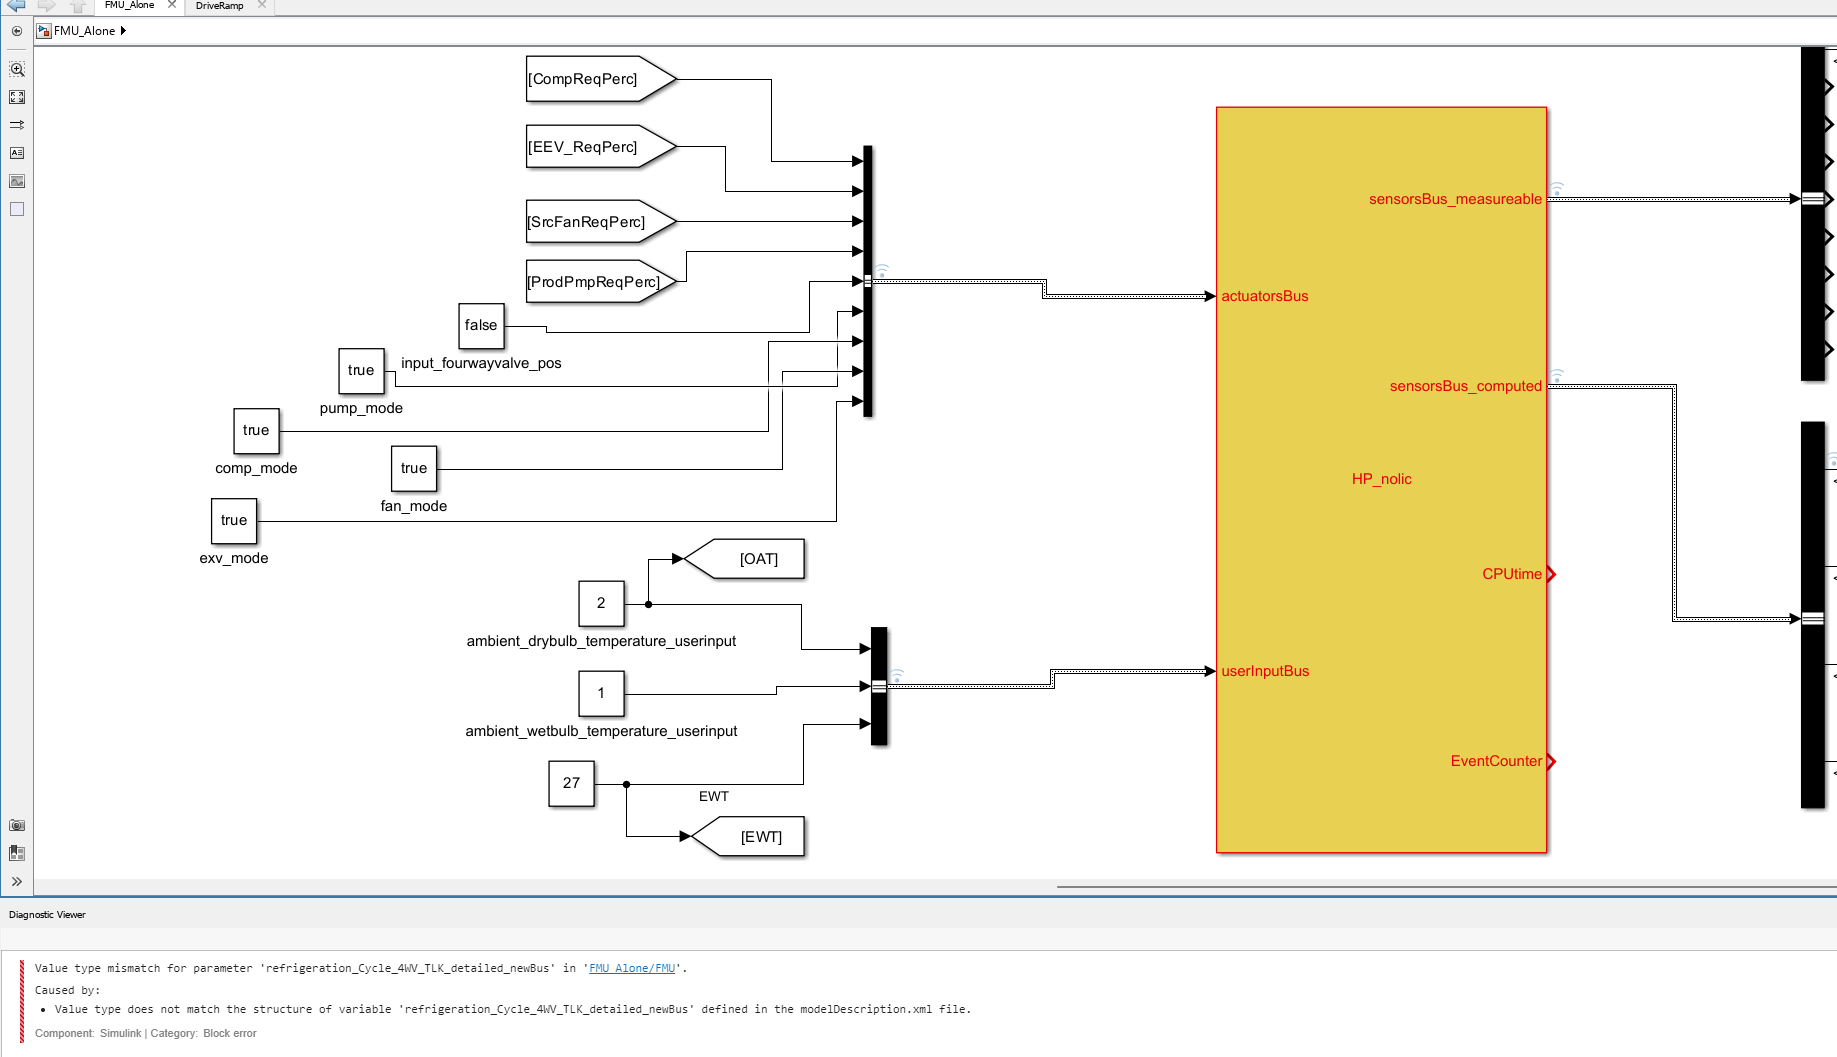
Hello Im tring to connect my master node to thingspeak but it gives error like:
Data received from slave - Temperature: 25.90, Humidity: 46.00, Soil Moisture: 0, pH: 4.26
Failed to send data to ThingSpeak, status code: -301
Data received from slave - Temperature: 25.90, Humidity: 46.00, Soil Moisture: 0, pH: 4.26
Failed to send data to ThingSpeak, status code: -301
What should I do?
I need to copy Channel field data from a specific data range (e.g. January 2024) from field 6 of channel A(see sample attached) to field 1 of channel B.
I have tried to adopt the Template "Get data from private channel" in the Matlab analysis area of Thingspeak. The last data can be copied according the sample, but I cannot manage to copy the complete datarange. My channel field contains half empty data in field 6, because I have posted data asynchrously from 2 devices to 1 channel up to now.
Any advice for proper Matlab code sample or the like is welcome!
I found read API key but there is no option for the read channel id