Results for
Bonjour,
pour un projet d'école j'ai besoin de faire analyser des données saisies directement dans Appinventor et non pas à partir de capteurs. J'ai cherché un peu partout sur le web mais je n'ai pas trouvé la solution. Quelqu'un peut il m'aider ?
Hi there,
Truncation error happens when an infinite series is ignored except for a small subset of its values. For instance, the exponential function e^x could be written as the infinite series total of 1 + x + x^2/2 + x^3/6 +... + x^n/n! +....
Any finite number of n will result in an approximation of the value of e^x that is inaccurate, but by increasing n, the error can be reduced to the desired level but this increase computation time.
How can I speed up the calculation by determining the dynamic level where error can be reduced to the barest minimum?
The error is different for each input; if the input number is small, the error condition can be reached quickly, say 1e-6; if the input number is large, we need more terms in the polynomial equation, i.e. more iteration; how can I make the threshold dynamic so that I don't have a fixed error tolerance number?
What I want to know is how to make the threshold dynamic so that I can decrease the polynomial's order and lower the number of terms, which will speed up execution time.
Any assistance would be greatly appreciated.
format long e
[exp(log(2)/2), 1+log(2)/2 + (log(2)/2)^2/factorial(2) + (log(2)/2)^3/factorial(3) + (log(2)/2)^4/factorial(4),(exp(log(2)/2) - 1+log(2)/2 + (log(2)/2)^2/factorial(2) + (log(2)/2)^3/factorial(3) + (log(2)/2)^4/factorial(4))]
[exp(-log(2)/2), 1+(-log(2)/2) + (-log(2)/2)^2/factorial(2) + (-log(2)/2)^3/factorial(3) + (-log(2)/2)^4/factorial(4),(exp(log(2)/2) - 1+log(2)/2 + (log(2)/2)^2/factorial(2) + (log(2)/2)^3/factorial(3) + (log(2)/2)^4/factorial(4))]
Hello,
I have an Open Loop Transfer Function:
Gc(s)Gp(s) = aKp(1+Tis) / Tis(s+1+p)
It was decided for this system a=5, Ti=0.1 and p=0.5
What would the poles and zeroes be for this?
Ive done the other examples but this one looks very different to the other questions and it has me stuck.
Any help is appreciated and sorry if this is the wrong place to post such questions.
"The model is configured to create a SIL block, which is not supported for the selected hardware board. To resolve this, search for 'Create block' in the Configuration Parameters dialog box and set it to 'None' or 'PIL'.
I am using the standard code written by Daniel. The temperature is giving -11.8 and the humidity 150. This is not for all data points. Any help would be appreciated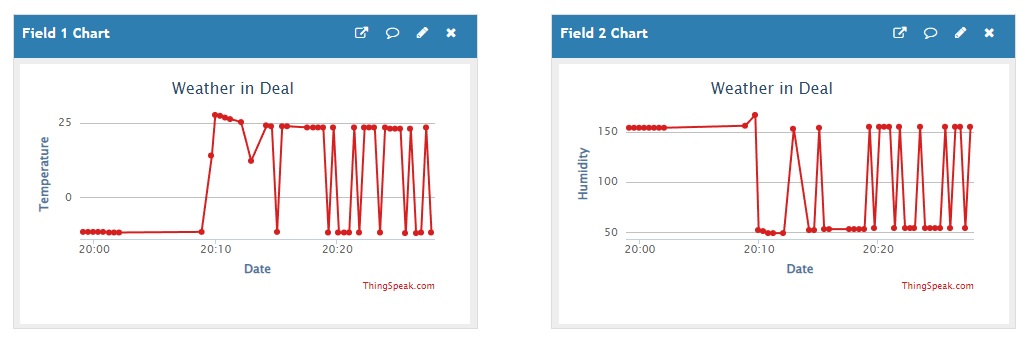
hi,
I have a web page which i need to enter user and pass in pop up combo box when i enter the site.
also i can enter directly with http://user:pass@x.x.x.x:port this format witour entering user and pass in combo.
i can not manage to get data from thingHttp and mathlab analysis. I always get http 401 error.
How can i can data? is it pıssible with thinkSpeak?
Hello,
I got the following error when I was trying to run the codes below. I'm glad if someone can tell me the reason for getting this error.
Thank you!
Error:
Unable to perform assignment because the size of the left side is 1-by-1 and the size of the right side is
1-by-201.
Error in fminsearch (line 201)
fv(:,1) = funfcn(x,varargin{:});
Error in fminsearchtest (line 47)
[fitparams_out, fval, ~, ~] = fminsearch(fn, fitparams_guess, options);
Code:
options = optimset('Display', 'iter', ...
'TolX', 1e-6, ... %Termination tolerance on x, default is 1e-4
'TolFun', 1e-6, ... %Term. tolerance on function value, default 1e-4
'MaxFunEvals', 1000 );
fitparams_guess=[0 0 0];
Noise = 2;
C0=pi;
C1 = 2;
C2 = 0.8;
x = -10:0.1:10;
y = C0 + C1*x + C2 * x.^2 + Noise*randn(1,length(x));
fn = @(fitparams) calc_residual(fitparams, x,y); %function handle
[fitparams_out, fval, ~, ~] = fminsearch(fn, fitparams_guess, options);
function residual = calc_residual (fitparams, x,y)
for i =1:length(x)
ymod = fitparams(1) + fitparams(2)*x(i) + fitparams(3) * x(i).^2 ;
end
residual = y-ymod;
end
Hello,
I am setting up a home energy monitoring system, all started from a blank sheet in arduino and its really working very well.
I would like to send data to thinkspeak which is not time dependant, i.e. send the X and Y values and format as a bar graph. The reason is, i have 12 channels monitoring energy (Wh) and i have this in an array which i plot on a local LCD and throughout the day the bars grow in height as the usage attributed to that channel grows. How can i do something similar in thing speak which by default applies a time stamp to received data.
Very simply, each channel has an ID (0-11) and a number associated with the accumulative Wh. I have a similar thing in excel for development where my serial port data is saved to a csv which excell imports every minute and updates a bar graph a bit like this;
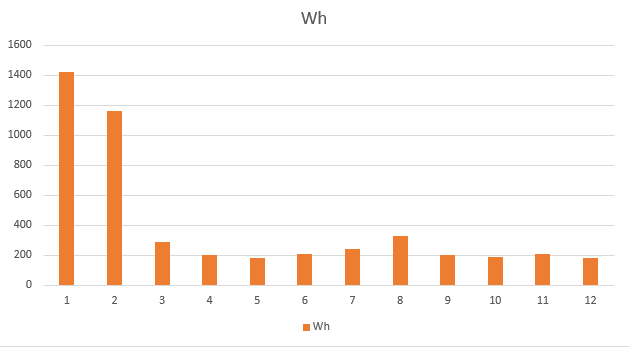
Ive had a good look (perhaps not good enough!) and i just cant see how this may be acheived with thingspeak without a clumbersome combination of 2 channels (given each channel has 8 fields) and then using a matlab visualisation to pull it all together. Perhaps its not has hard / messy as it sounds? I am paid user so can create extra channels if required.
Thanks,
Stuart
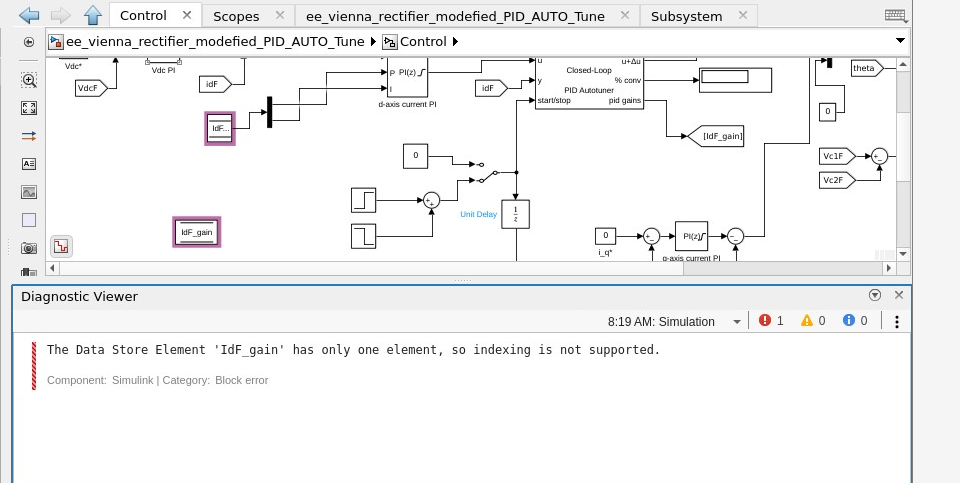
I am facing an issue in data store memory block using store memory Read and write Block in matlab simulink. I have attached the screen short in which the posed error has been depicted.
How do i collect data from a website like weather.com and use it in a channel? I need the current weather on a specific location (including storms, hail etc.) but i couldn't find a way to do it.
Connection: close
<html>
<head><title>400 Bad Request</title></head>
<body>
<center><h1>400 Bad Request</h1></center>
</body>
</html>
CLOSED
Hello,
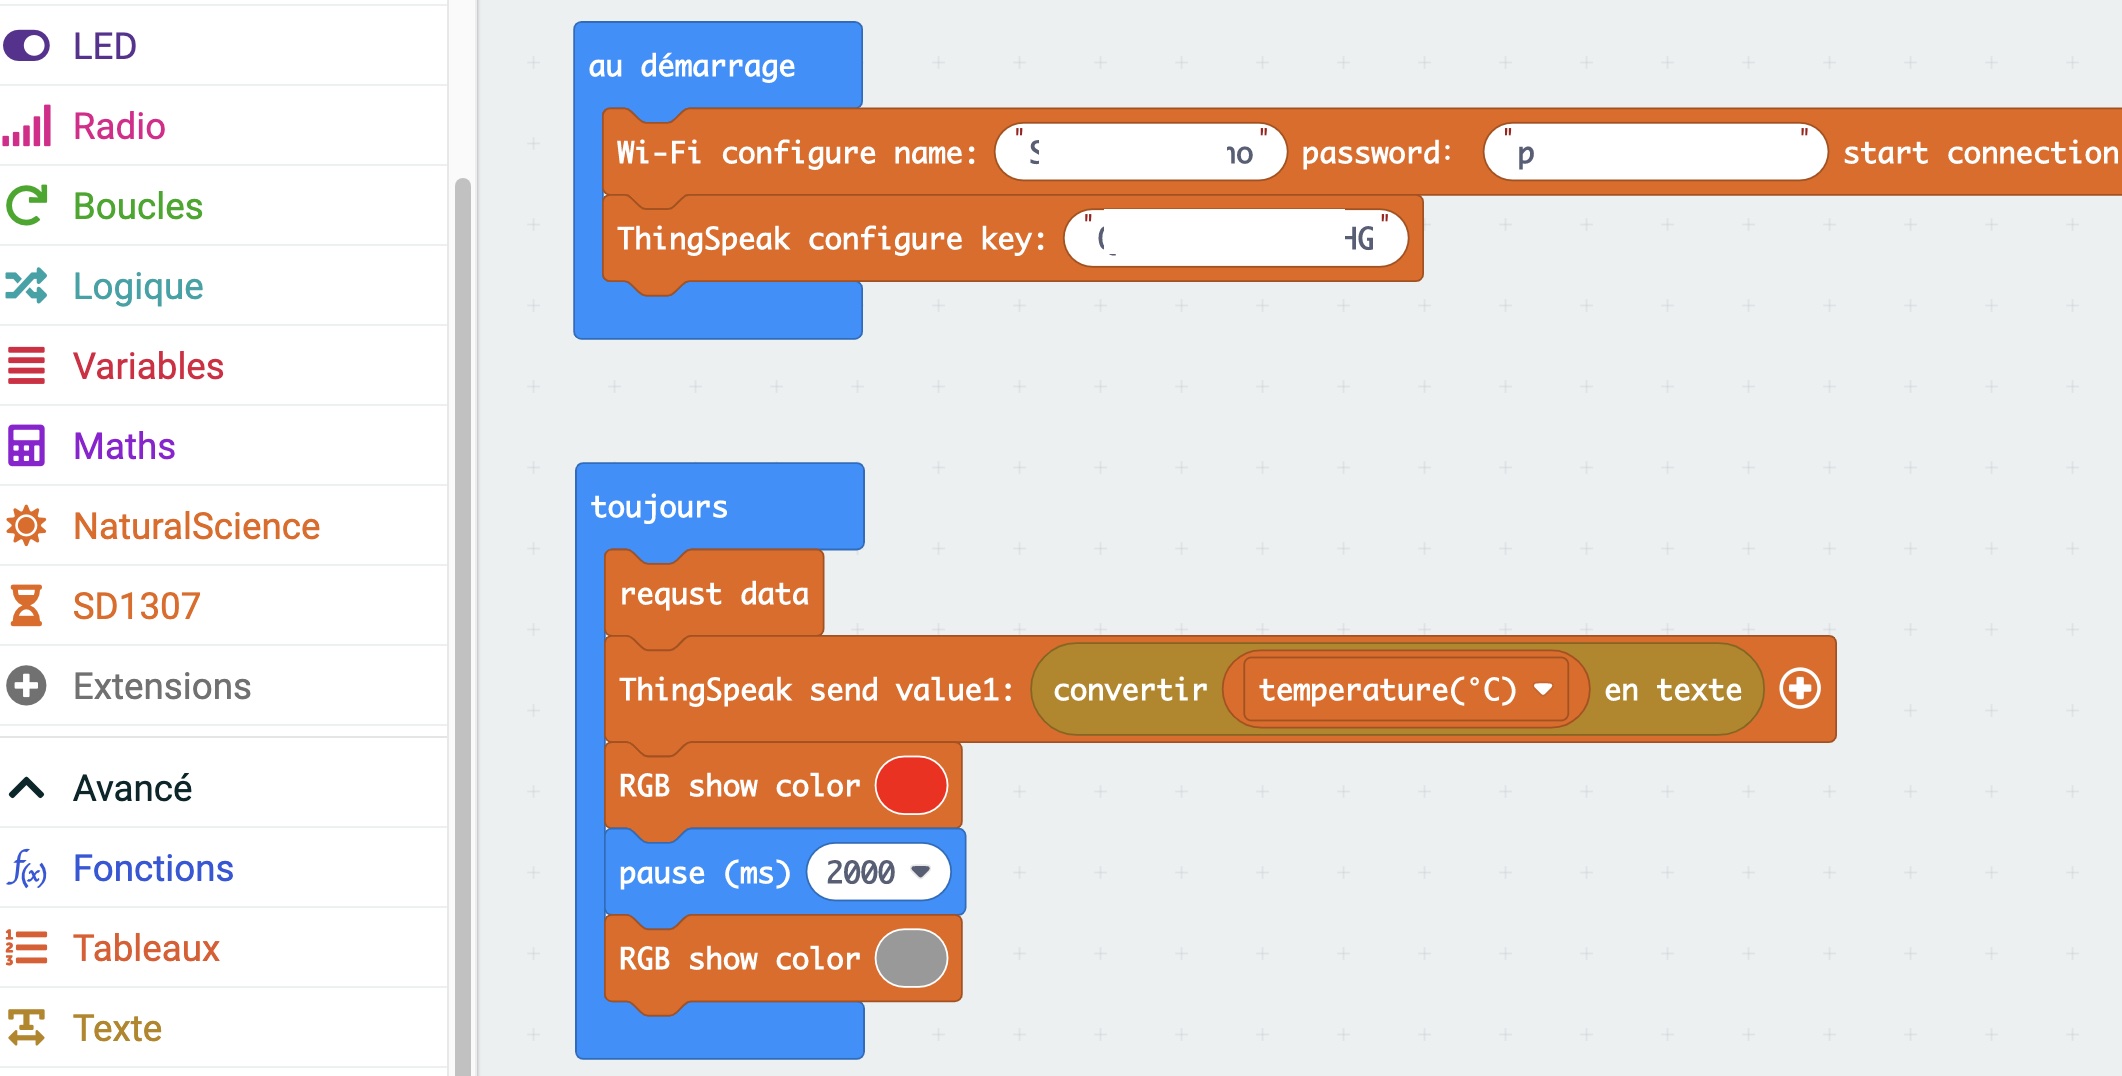
I have a dfrobot microbit environment science extension board labelled as (v3.0)
I have tried to publish data to my thingspeak channel. All is well configurated in thingspeak.
I have read the tutorial and unfortunately I'm not able to publish any data on the channel with the extension board...
I've tried manualy with my firefox browser “https://api.thingspeak.com/update?api_key=xxxxxxxxxxxxxx&field1=0” and it works fine
But in the makecode program it does'nt …
My program looks like this, what is wrong ???
Any help will be much appreciated and by the way sorry for my bad english
%This is the code. I have to introduce a small value, for example, e = 0.01
%and the loop has to stop when de difference in absolue value between a1
%and pi is less than that quantity. But it never stops and i dont know why.
%Hope you can help me. I appreciate it.
function [a1,a2,i,j] = ejercicio06(e)
i=2;
j=2;
p(1) = e+1;
s(1) = e+1;
while p(i-1) > e
a1 = (1./((4.*i+1).*(4.*i+3)));
a1=8*sum(a1);
p(i) = abs(a1-pi);
i = i+1;
end
disp('hola este bucle se ha terminado')
while s(j-1) > e
a2 = (1./(1+j).^2);
a2 = sqrt(6*sum(a2));
s(j) = abs(a2-pi);
j = j+1;
end
end
Hello. I want to send the data that I have collected from the sensors and that is displayed on ThingSpeak to a databse in Firebase. How can I do it? I know I can use the REST API but where should I code the fetch? Thanks.
I can upload an image using postman. But when I try it with my rpi the image never shows. I receive status code 202. Then the current image from postman goes blank. Tells me the post sort of worked... Does anyone have working python3 code that they can share?
Last update is Friday March 10th. It appears from this end that the WS is correctly sending data.
If I can get Arduino running again I will try recompiling the code and update the board.
Hello people,
I made a program to read a dataset from JSON and make an API request to Thingspeak (bulk_write).
After the transmission I display the response of the request, which is 202 (compliant data).
My data updates fine on my Thingspeak channel but the longitude and latitude fields do not change.
Do you have any explanation for this problem?
Here is the code:
import json
import requests
import time
apiKey = "xxxxxxxxxxxxxxxx"
channel_ID = "xxxxxxx"
url = "https://api.thingspeak.com/channels/" + channel_ID + "/bulk_update.json" # ThingSpeak server settings
message_buffer = []
message = {}
while True:
f = open("data.json", "r")
jsonContent = f.read()
objJson = json.loads(jsonContent)
message['delta_t'] = 15
message['field1'] = (objJson['GPS']['speed'])
message['field2'] = (objJson['GROVE'][3]['degNord'])
message['field3'] = (objJson['GIROUETTE']['degVent'])
message['latitude'] = str((objJson['GPS']['latitude']))
message['longitude'] = str((objJson['GPS']['longitude']))
message['elevation'] = 100
latitude = (objJson['GPS']['latitude'])
longitude = (objJson['GPS']['longitude'])
#print(latitude)
#print(longitude)
message_buffer.append(message)
bulk_data = json.dumps({'write_api_key':apiKey,'updates':message_buffer})
print(bulk_data)
message_buffer = []
request_headers = {"User-Agent":"mw.doc.bulk-update","Content-Type":"application/json","Content-Length":str(len(bulk_data))}
print(request_headers)
response = requests.post(url,headers=request_headers,data=bulk_data)
print (response) # Response 200 : Validated data / Response 429 : Too many request, please wait
print("_________________________________________")
print()
time.sleep(15)
My JSON file :
{
"GPS": {
"latitude": 48.75607,
"longitude": 2.30202,
"speed": 10.04384
},
"GROVE": [
{
"Compas": {
"x": 2.583,
"y": -4.439,
"z": 0.435
}
},
{
"Gyroscope": {
"x": 2.56433,
"y": -4.45352,
"z": 0.47237
}
},
{
"Acceleration": {
"x": 0.28,
"y": 0.01,
"z": 0.93
}
},
{
"degNord": 20.743
}
],
"GIROUETTE": {
"degVent": 30.46389
}
}
Why this kind of problem is showing everytime?
Below is my code which I wish can change the color for the visualization without refresh the page.
% Set your ThingSpeak channel and API keys
channelID = 2044216;
readAPIKey = '4SVDGTR02R02PFAD';
% Initialize variables
threshold = 0;
circleRadius = 6;
circleCenterX = 30;
circleCenterY = 40;
greenColor = [0 1 0];
redColor = [1 0 0];
% Create the circle visualization
figure('Position',[100 100 200 200]);
circle = rectangle('Position',[circleCenterX - circleRadius, circleCenterY - circleRadius, circleRadius*2, circleRadius*2],...
'Curvature',[1,1],'FaceColor',greenColor);
axis square;
axis off;
% Continuously update the circle color based on the ThingSpeak channel data
while true
% Read the latest value of field 2 from your ThingSpeak channel
fieldData = thingSpeakRead(channelID, 'ReadKey', readAPIKey, 'Fields', 2, 'NumPoints', 1);
% Update the circle color based on the value of field 2
if fieldData == threshold
circle.FaceColor = redColor;
else
circle.FaceColor = greenColor;
end
end
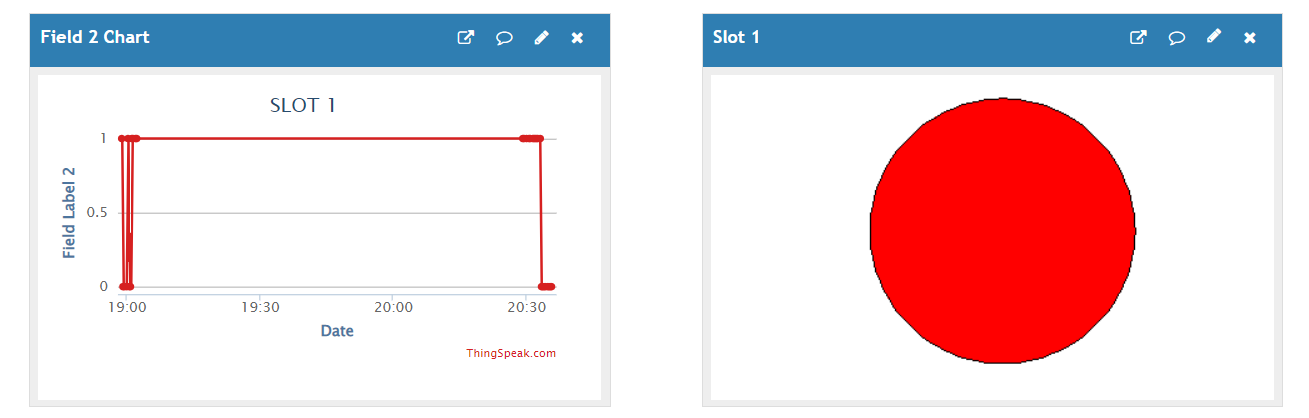
Hi, I am currently doing a parking system that able to show red colour when the parking space is filled and change to green colour when the parking space is empty. I am using Matlab visualizations because I need the same indicator to show both two colours.
I am currently facing a problem to let the visualization change colour according to my input. Figure below show the visualization and the chart. I want the visualization able to change between green and red colour with 1 and 0 value from the chart. May I know how could I done this? Thank you.
The code for the visualization are shown below:
radius = 6;
centerX = 30;
centerY = 40;
myColor=[1 0 0];
rectangle('Position',[centerX - radius, centerY - radius, radius*2, radius*2],...
'Curvature',[1,1],'FaceColor',myColor);
axis square;
axis off;