Main Content

Results for

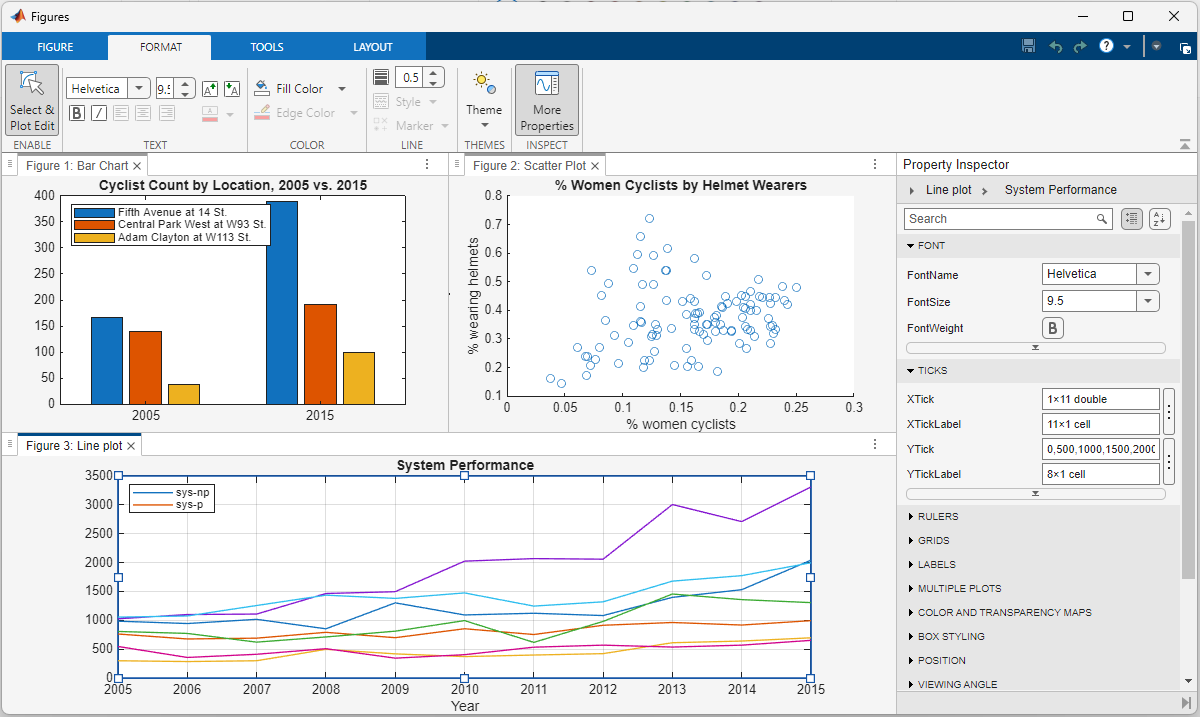
In the latest Graphics and App Building blog article, documentation writer Jasmine Poppick modernized a figure-based bridge analysis app by replacing uicontrol with new UI components and uifigure, resulting in cleaner code, better layouts, and expanded functionality in R2025a.

https://blogs.mathworks.com/graphics-and-apps/2025/08/19/__from-uicontrol-to-ui-components

This article covers the following topics:

Why and when to move from uicontrol and figure to modern UI components and uifigure.

How to replace uicontrol objects with equivalent UI component functions (uicheckbox, uidropdown, uispinner, etc.).

How to update callback code to match new component properties and behaviors.

How to adopt new UI component types (like spinners) to simplify validation and improve usability.

How to configure existing components with modern options (sortable tables, auto-fitting columns, editable data).

How to apply visual styling with uistyle and addStyle to make apps more user-friendly.

How to use uigridlayout to create flexible, adaptive layouts instead of manually managing positions.

The benefits of switching from figure to uifigure for app-building workflows.

A full before-and-after example of modernizing an existing app with incremental, practical updates.

This week's Graphics and App Building blog article guides chart authors and app builders through the process of designing for a specific theme or creating theme-responsive charts and apps.
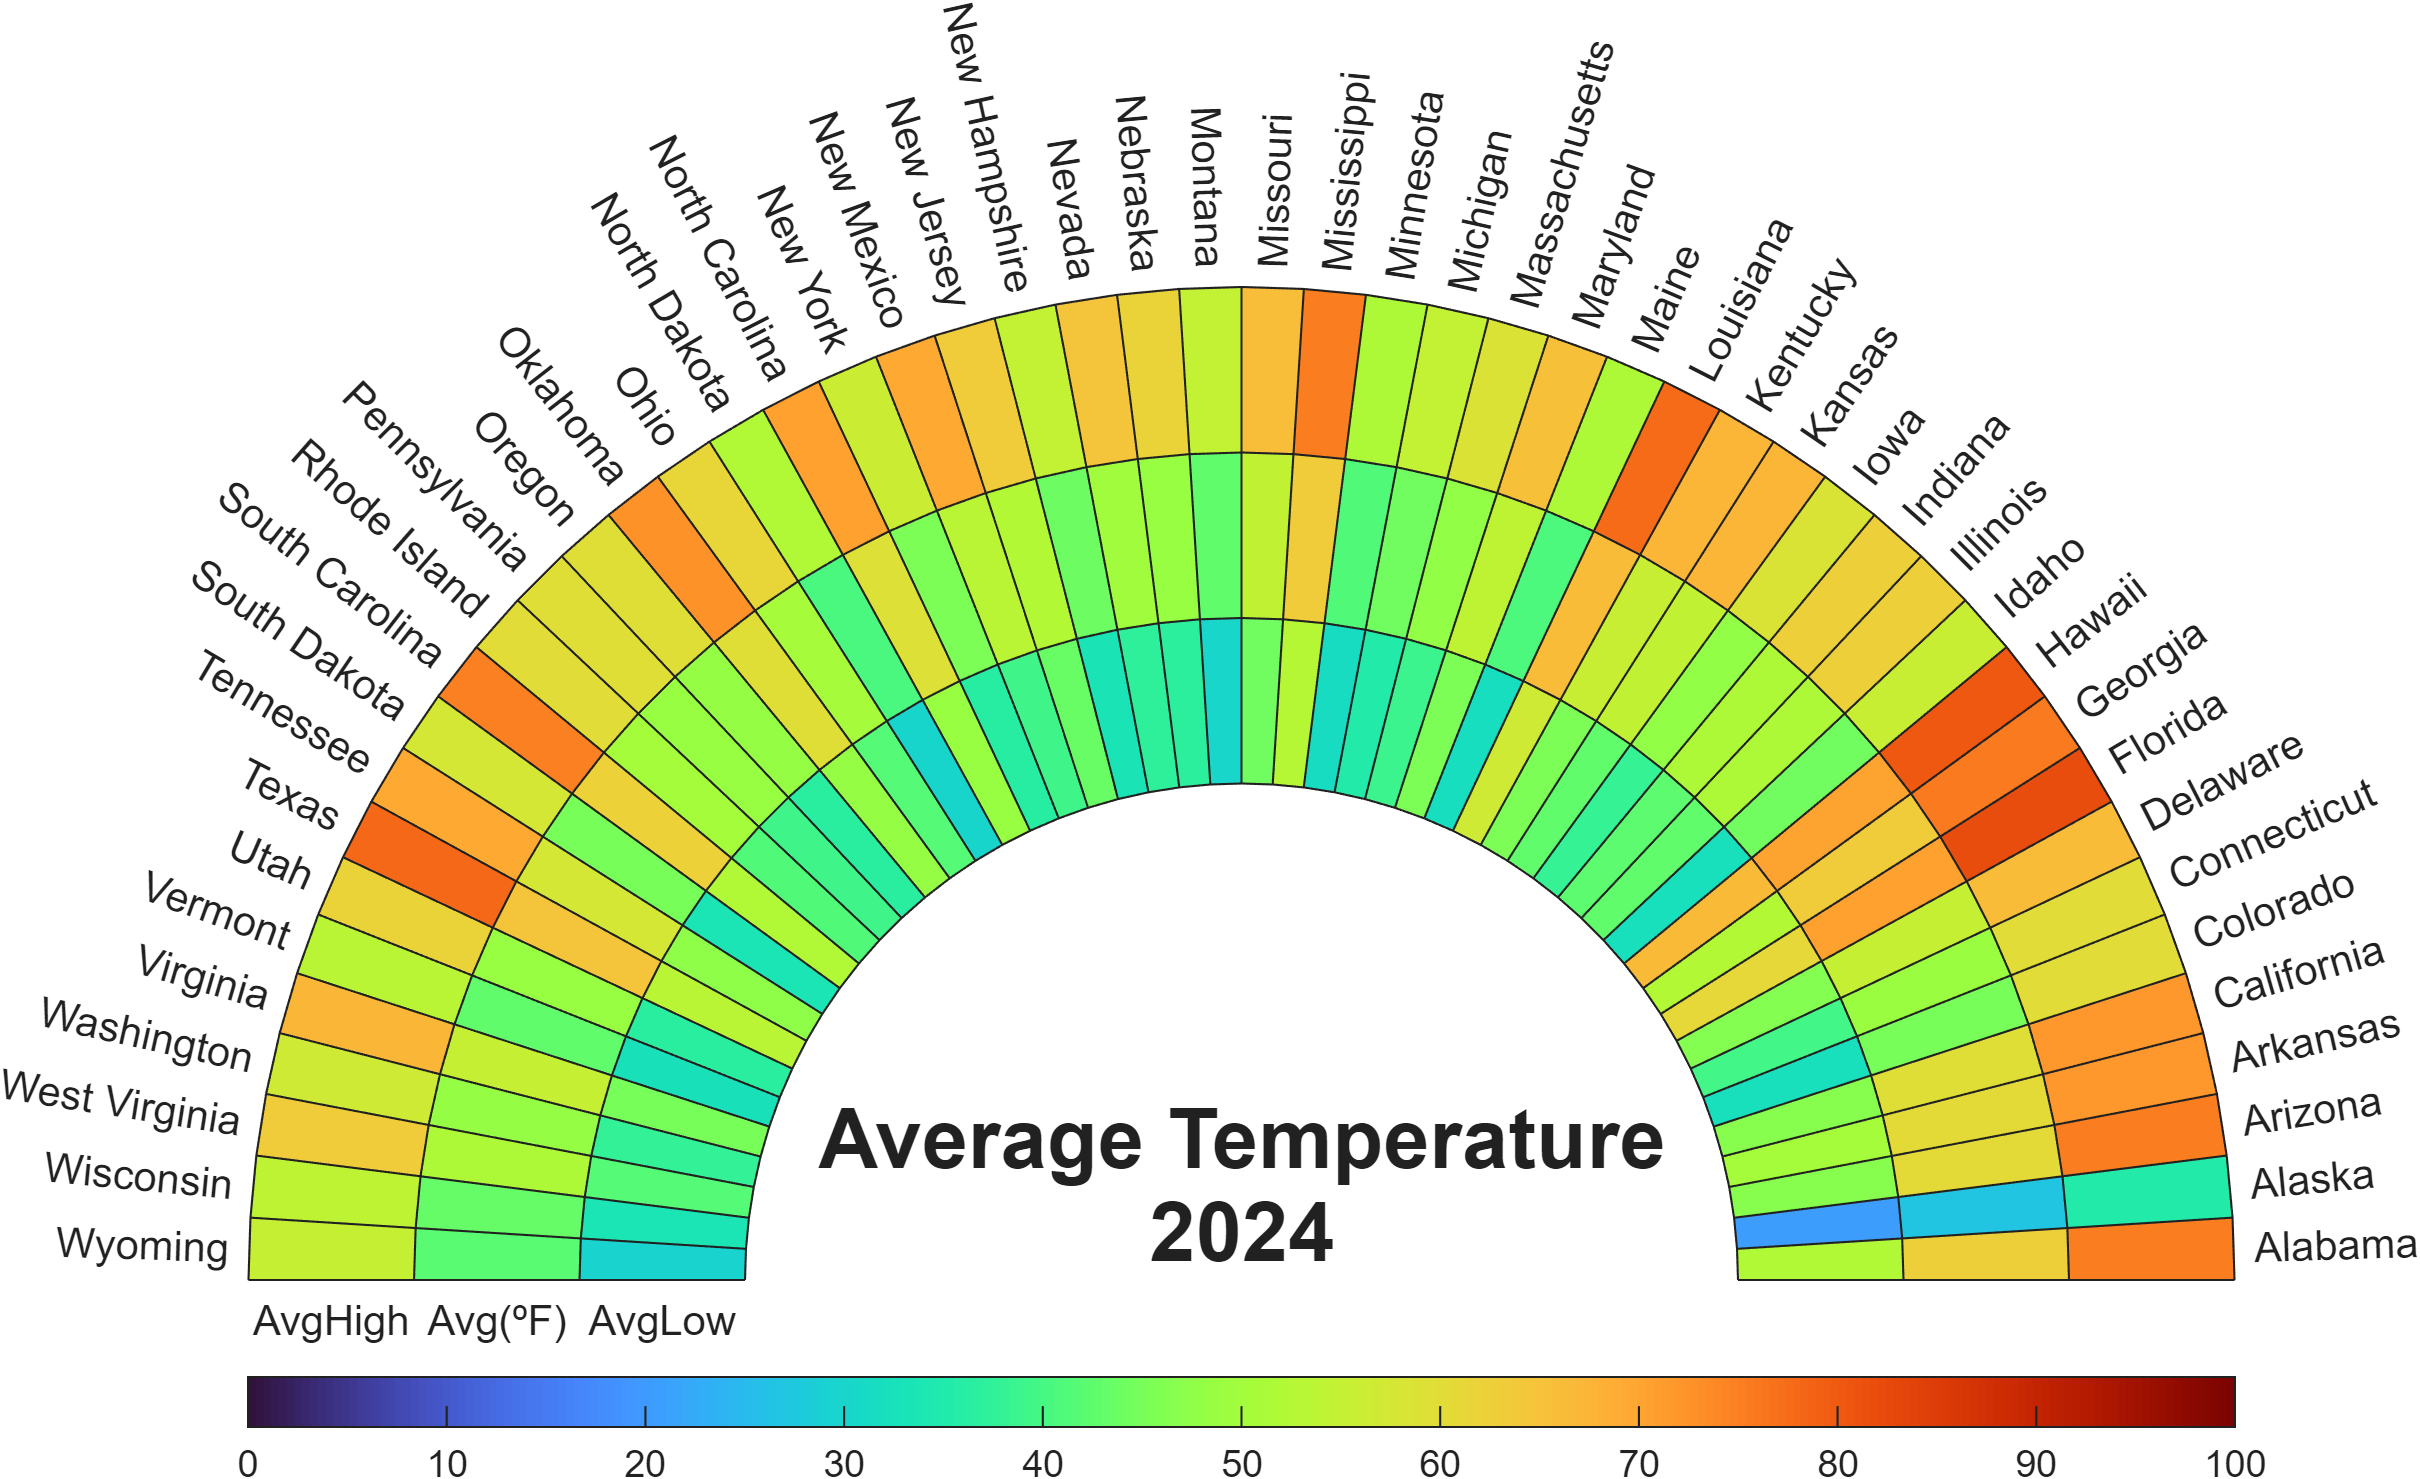
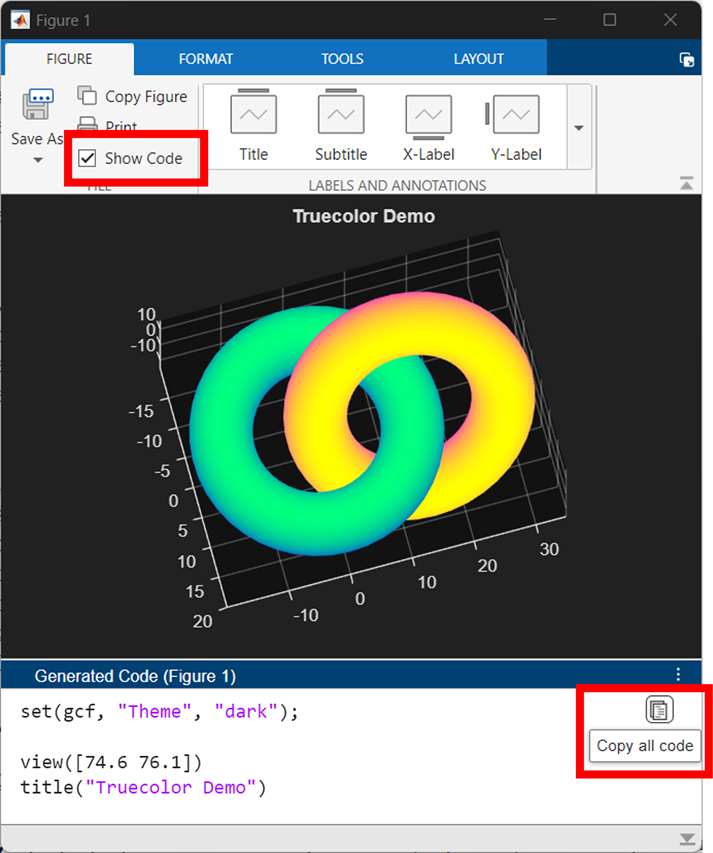
  • Learn how dark theme may impacts charts and apps
  • Discover best practices for theme-adaptive workflows
  • Step-by-step examples for both script-based plots and advanced custom charts and UI components
  • Discover new tools like ThemeChangedFcn, getTheme, and fliplightness
Are you a dark mode enthusiast or are you curious about how it’s shaping MATLAB graphics? Check out the latest article in the MATLAB Graphics and App Building blog.
🔹 User Insights: find out how user surveys influenced the development of graphics themes
🔹 Learn three ways to switch between light and dark themes for figures
🔹 Understand how custom and default colors behave across themes
🔹 Download a handy cheat sheet for working with themes in your graphics and apps.
The new figure toolstrip in R2025a was designed from multiple feedback cycles with MATLAB users. See the latest article in the Graphics and App Building blog to see the evolution of the figure toolbar from 1996-2025, learn how user feedback shaped the new toolstrip, and check out the new code-generation feature that makes interactive data exporation reproducible.
The MATLAB R2025a release gave figures a makeover. @Brian Knolhoff, a developer on the Figure Infrastructure and Services team, reviews the new Figure Container in the Graphics and App Building blog.
Learn the four ways to tile figures, what docking means, and other new features.
The Graphics and App Building Blog just launched its first article on R2025a features, authored by Chris Portal, the director of engineering for the MATLAB graphics and app building teams.
Over the next few months, we'll publish a series of articles that showcase our updated graphics system, introduce new tools and features, and provide valuable references enriched by the perspectives of those involved in their development.
To stay updated, you can subscribe to the blog (look for the option in the upper left corner of the blog page). We also encourage you to join the conversation—your comments and questions under each article help shape the discussion and guide future content.
The topic recently came up in a MATLAB Central Answers forum thread, where community members discussed how to programmatically control when the end user can close a custom app. Imagine you need to prevent app closure during a critical process but want to allow the end user to close the app afterwards. This article will guide you through the steps to add this behavior to your app.
A demo is attached containing an app with a state button that, when enabled, disables the ability to close the app.
Steps
1. Add a property that stores the state of the closure as a scalar logical value. In this example, I named the property closeEnabled. The default value in this example is true, meaning that closing is enabled. -- How to add a property to an app in app designer
properties (Access = private)
closeEnabled = true % Flag that controls ability to close app
end
2. Add a CloseRequest function to the app figure. This function is called any time there is an attempt to close the app. Within the CloseRequest function, add a condition that deletes the app when closure is enabled. -- How to add a CloseRequest function to an app figure in app designer
function UIFigureCloseRequest(app, event)
if app.closeEnabled
delete(app)
end
3. Toggle the value of the closeEnabled property as needed in your code. Imagine you have a "Process" button that initiates a process where it is crucial for the app to remain open. Set the closeEnabled flag to false (closure is disabled) at the beginning of the button's callback function and then set it to true at the end (closure is enabled).
function ProcessButtonPress(app, event)
app.closeEnabled = false;
% MY PROCESS CODE
app.closeEnabled = true;
end
Handling Errors: There is one trap to keep in mind in the example above. What if something in the callback function breaks before the app.closeEnabled is returned to true? That leaves the app in a bad state where closure is blocked. A pro move would be to use a cleanupObj to manage returning the property to true. In the example below, the task to return the closeEnabled property to true is managed by the cleanup object, which will execute that command when execution is terminated in the ProcessButtonPress function—whether execution was terminated by error or by gracefully exiting the function.
function ProcessButtonPress(app, event)
app.closeEnabled = false;
cleanupClosure = onCleanup(@()set(app,'closeEnabled',true));
% MY CODE
end
Force Closure: If the CloseRequest function is preventing an app from closing, here are a couple of ways to force a closure.
  1. If you have the app's handle, use delete(app) or close(app,'force'). This will also work on the app's figure handle.
  2. If you do not have the app's handle, you can use close('all','force') to close all figures or use findall(groot,'type','figure') to find the app's figure handle.
Do you boast about the energy savings you racking up by using dark mode while stashing your energy bill savings away for an exotic vacation🌴🥥? Well, hold onto your sun hats and flipflops!
A recent study presented at the 1st Internaltional Workshop on Low Carbon Computing suggests that you may be burning more ⚡energy⚡ with your slick dark displays 💻[1].
In a 2x2 factorial design, ten participants viewed a webpage in dark and light modes in both dim and lit settings using an LCD monitor with 16 brightness levels.
  • 80% of participants increased the monitor's brightness in dark mode [2]
  • This occurred in both lit and dim rooms
  • Dark mode did not reduce power draw but increasing monitor brightness did.
The color pixels in an LCD monitor still draw voltage when the screen is black, which is why the monitor looks gray when displaying a pure black background in a dark room. OLED monitors, on the other hand, are capable of turning off pixels that represent pure black and therefore have the potential to save energy with dark mode. A 2021 Purdue study estimates a 3%-9% energy savings with dark mode on OLED monitors using auto-brightness [3]. However, outside of gaming, OLED monitors have a very small market share and still account for less than 25% within the gaming world.
Any MATLAB users out there with OLED monitors? How are you going to spend your mad cash savings when you start using MATLAB's upcoming dark theme?
  1. BBC study: https://www.sicsa.ac.uk/wp-content/uploads/2024/11/LOCO2024_paper_12.pdf
  2. BBC blog article https://www.bbc.co.uk/rd/articles/2025-01-sustainability-web-energy-consumption
  3. 2021 Purdue https://dl.acm.org/doi/abs/10.1145/3458864.3467682
Creating data visualizations
79%
Interpreting data visualizations
21%
28 votes
Three former MathWorks employees, Steve Wilcockson, David Bergstein, and Gareth Thomas, joined the ArrayCast pod cast to discuss their work on array based languages. At the end of the episode, Steve says,
> It's a little known fact about MATLAB. There's this thing, Gareth has talked about the community. One of the things MATLAB did very, very early was built the MATLAB community, the so-called MATLAB File Exchange, which came about in the early 2000s. And it was where people would share code sets, M files, et cetera. This was long before GitHub came around. This was well ahead of its time. And I think there are other places too, where MATLAB has delivered cultural benefits over and above the kind of core programming and mathematical capabilities too. So, you know, MATLAB Central, File Exchange, very much saw the future.
Check out this 3D chart that won Visual Of The Year for 2024 by Visual Capitalist. It's a mashup between a 3D bubblechart and a categorical bar plot yet the only graphical components are the x-axis labels and the legend. Not only does it show relative proportions of material in a laptop but it also shows what the raw material looks like.
I love the idea of analog data visualization. I wonder if any readers have made a analog "chart".
It's frustrating when a long function or script runs and prints unexpected outputs to the command window. The line producing those outputs can be difficult to find.
Starting in R2024b, use dbstop to find the line with unsuppressed outputs!
Run this line of code before running the script or function. Execution will pause when the line is hit and the file will open to that line. Outputs that are intentionaly displayed by functions such as disp() or fprintf() will be ignored.
dbstop if unsuppressed output
To turn this off,
dbclear if unsuppressed output
How to leave feedback on a doc page
Leaving feedback is a two-step process. At the bottom of most pages in the MATLAB documentation is a star rating.
Start by selecting a star that best answers the question. After selecting a star rating, an edit box appears where you can offer specific feedback.
When you press "Submit" you'll see the confirmation dialog below. You cannot go back and edit your content, although you can refresh the page to go through that process again.
Tips on leaving feedback
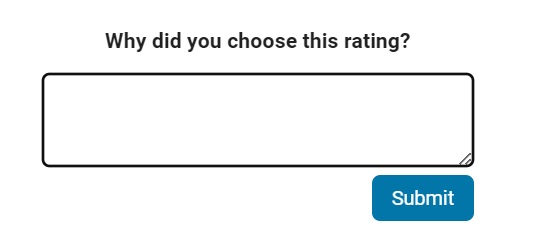
  • Be productive. The reader should clearly understand what action you'd like to see, what was unclear, what you think needs work, or what areas were really helpful.
  • Positive feedback is also helpful. By nature, feedback often focuses on suggestions for changes but it also helps to know what was clear and what worked well.
  • Point to specific areas of the page. This helps the reader to narrow the focus of the page to the area described by your feedback.
What happens to that feedback?
Before working at MathWorks I often left feedback on documentation pages but I never knew what happens after that. One day in 2021 I shared my speculation on the process:
> That feedback is received by MathWorks Gnomes which are never seen nor heard but visit the MathWorks documentation team at night while they are sleeping and whisper selected suggestions into their ears to manipulate their dreams. Occassionally this causes them to wake up with a Eureka moment that leads to changes in the documentation.
I'd like to let you in on the secret which is much less fanciful. Feedback left in the star rating and edit box are collected and periodically reviewed by the doc writers who look for trends on highly trafficked pages and finer grain feedback on less visited pages. Your feedback is important and often results in improvements.
RGB triplet [0,1]
9%
RGB triplet [0,255]
12%
Hexadecimal Color Code
13%
Indexed color
16%
Truecolor array
37%
Equally unfamiliar with all-above
13%
2784 votes
Are you a Simulink user eager to learn how to create apps with App Designer? Or an App Designer enthusiast looking to dive into Simulink?
Don't miss today's article on the Graphics and App Building Blog by @Robert Philbrick! Discover how to build Simulink Apps with App Designer, streamlining control of your simulations!
Welcome to MATLAB Central's first Ask Me Anything (AMA) session! Over the next few weeks, I look forward to addressing any questions or curiosities you might have about MATLAB, the forum, sasquatches, or whatever's on your mind. Having volunteered as a contributor to this community before joining MathWorks, I'm excited to act as a bridge between these two worlds. Let's kick things off by sharing a little-known fact about the forum’s staff contributors!
A couple of years ago, before I joined MathWorks as a developer on the Graphics and Charting team, I often wondered who were the MathWorkers with the [staff] moniker answering questions in the Answers forum. Is their MATLAB Central activity part of their day-to-day job expectations? Do they serve specific roles on some kind of community outreach team? Is their work in the forum voluntary in the same way that non-staff contributors volunteer their time?
Now that I'm on the inside, I'd like to share a secret with my fellow MATLAB users and MATLAB Central enthusiasts: with the exception of the MathWorks Support Team, staff participation in the Answers forum is completely voluntary! The staff contributions you see in the forum arise from pure intrinsic motivation to connect with users, help people out of ruts, and spread the word about our product!
For example, Steven Lord has contributed 20-150 answers per month for 9 years! Steven is a quality engineer for core MATLAB numerical functions. Cris LaPierre develops training material and has been a faithful contributor in the forum for almost 6 years! Kojiro Saito and Akira Agata have been tackling Japanese content for more than 7 years! There are many others who have inspired me as a user, and I am honored to now call colleagues: Peter Perkins, Michio, Joss Knight, Alan Weiss, Jiro Doke, Edric Ellis, and many others who deserve appreciation.
The forum's success hinges on the invaluable contributions from the majority of non-staff volunteers, whose dedication and expertise fuel our community. But I know I wasn't alone in wondering about these staff contributors, so now you're in on the secret!
I'm curious to know what other topics you're interested in learning about. Ask me anything!
Temporary print statements are often helpful during debugging but it's easy to forget to remove the statements or sometimes you may not have writing privileges for the file. This tip uses conditional breakpoints to add print statements without ever editing the file!
What are conditional breakpoints?
Conditional breakpoints allow you to write a conditional statement that is executed when the selected line is hit and if the condition returns true, MATLAB pauses at that line. Otherwise, it continues.
The Hack: use ~fprintf() as the condition
fprintf prints information to the command window and returns the size of the message in bytes. The message size will always be greater than 0 which will always evaluate as true when converted to logical. Therefore, by negating an fprintf statement within a conditional breakpoint, the fprintf command will execute, print to the command window, and evalute as false which means the execution will continue uninterupted!
How to set a conditional break point
1. Right click the line number where you want the condition to be evaluated and select "Set Conditional Breakpoint"
2. Enter a valid MATLAB expression that returns a logical scalar value in the editor dialog.
Handy one-liners
Check if a line is reached: Don't forget the negation (~) and the line break (\n)!
~fprintf('Entered callback function\n')
Display the call stack from the break point line: one of my favorites!
~fprintf('%s\n',formattedDisplayText(struct2table(dbstack)))
Inspect variable values: For scalar values,
~fprintf('v = %.5f\n', v)
Use formattedDisplayText to convert more complex data to a string
~fprintf('%s\n', formattedDisplayText(v)).
Make sense of frequent hits: In some situations such as responses to listeners or interactive callbacks, a line can be executed 100s of times per second. Incorporate a timestamp to differentiate messages during rapid execution.
~fprintf('WindowButtonDownFcn - %s\n', datetime('now'))
Closing
This tip not only keeps your code clean but also offers a dynamic way to monitor code execution and variable states without permanent modifications. Interested in digging deeper? @Steve Eddins takes this tip to the next level with his Code Trace for MATLAB tool available on the File Exchange (read more).
Summary animation
To reproduce the events in this animation:
% buttonDownFcnDemo.m
fig = figure();
tcl = tiledlayout(4,4,'TileSpacing','compact');
for i = 1:16
ax = nexttile(tcl);
title(ax,"#"+string(i))
ax.ButtonDownFcn = @axesButtonDownFcn;
xlim(ax,[-1 1])
ylim(ax,[-1,1])
hold(ax,'on')
end
function axesButtonDownFcn(obj,event)
colors = lines(16);
plot(obj,event.IntersectionPoint(1),event.IntersectionPoint(2),...
'ko','MarkerFaceColor',colors(obj.Layout.Tile,:))
end
The MATLAB command window isn't just for commands and outputs—it can also host interactive hyperlinks. These can serve as powerful shortcuts, enhancing the feedback you provide during code execution. Here are some hyperlinks I frequently use in fprintf statements, warnings, or error messages.
1. Open a website.
msg = "Could not download data from website.";
url = "https://blogs.mathworks.com/graphics-and-apps/";
hypertext = "Go to website"
fprintf(1,'%s <a href="matlab: web(''%s'') ">%s</a>\n',msg,url,hypertext);
Could not download data from website. Go to website
2. Open a folder in file explorer (Windows)
msg = "File saved to current directory.";
directory = cd();
hypertext = "[Open directory]";
fprintf(1,'%s <a href="matlab: winopen(''%s'') ">%s</a>\n',msg,directory,hypertext)
File saved to current directory. [Open directory]
3. Open a document (Windows)
msg = "Created database.csv.";
filepath = fullfile(cd,'database.csv');
hypertext = "[Open file]";
fprintf(1,'%s <a href="matlab: winopen(''%s'') ">%s</a>\n',msg,filepath,hypertext)
Created database.csv. [Open file]
4. Open an m-file and go to a specific line
msg = 'Go to';
file = 'streamline.m';
line = 51;
fprintf(1,'%s <a href="matlab: matlab.desktop.editor.openAndGoToLine(which(''%s''), %d); ">%s line %d</a>', msg, file, line, file, line);
5. Display more text
msg = 'Incomplete data detected.';
extendedInfo = '\tFilename: m32c4r28\n\tDate: 12/20/2014\n\tElectrode: (3,7)\n\tDepth: ???\n';
hypertext = '[Click for more info]';
warning('%s <a href="matlab: fprintf(''%s'') ">%s</a>', msg,extendedInfo,hypertext);
Warning: Incomplete data detected. [Click for more info]
<click>
  • Filename: m32c4r28
  • Date: 12/20/2014
  • Electrode: (3,7)
  • Depth: ???
6. Run a function
Similarly, you can also add hyperlinks in figures and apps
I rarely/never save .fig files
47%
Continue working on it later
16%
Archive for future reference
23%
Share within my organization
10%
Share outside my organization
2%
Other (please leave a comment)
2%
2097 votes