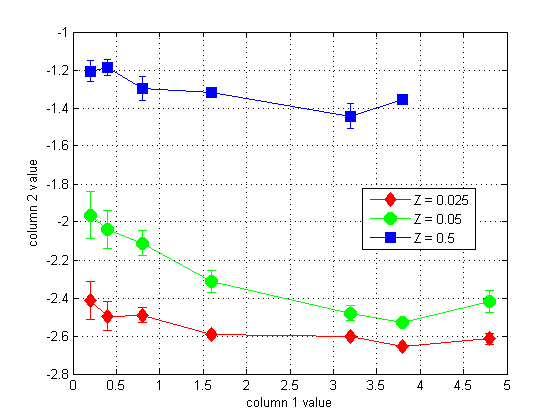
Sort data, plot means, std errors
Given a matrix with y, x and z columns, plot graphs of y vs x for each z, with error bars.

You are now following this Submission
- You will see updates in your followed content feed
- You may receive emails, depending on your communication preferences
Cite As
Don MacLeod (2026). Sort data, plot means, std errors (https://in.mathworks.com/matlabcentral/fileexchange/20181-sort-data-plot-means-std-errors), MATLAB Central File Exchange. Retrieved .
General Information
- Version 1.1.0 (3.37 KB)
MATLAB Release Compatibility
- Compatible with any release
Platform Compatibility
- Windows
- macOS
- Linux

