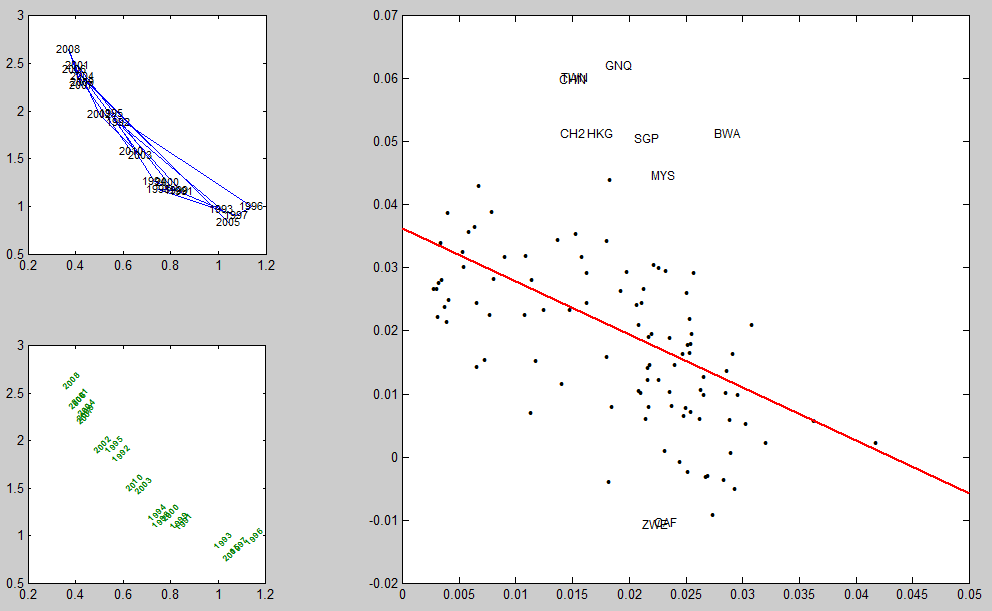
lscatter : scatter plot with labels instead of markers
Similar to ML's scatter command, but allows you to use separate labels for each point.

You are now following this Submission
- You will see updates in your followed content feed
- You may receive emails, depending on your communication preferences
Cite As
Yvan Lengwiler (2026). lscatter : scatter plot with labels instead of markers (https://in.mathworks.com/matlabcentral/fileexchange/28079-lscatter-scatter-plot-with-labels-instead-of-markers), MATLAB Central File Exchange. Retrieved .
Acknowledgements
Inspired: scattertext
General Information
- Version 1.3.0 (3.6 KB)
MATLAB Release Compatibility
- Compatible with any release
Platform Compatibility
- Windows
- macOS
- Linux
| Version | Published | Release Notes | Action |
|---|---|---|---|
| 1.3.0 | Bug fix thanks to Christ Ftaclas: before, the label vanished when any of the coordinates became zero. Furthermore, the undocumented 'LineSmoothing' option of the 'plot' command is now supported. |
||
| 1.2.0 | Now also catches ambiguous options, following a further comment by John D'Errico (Thank you, John!). |
||
| 1.1.0 | Options are now case insensitive and can be abbreviated, following John D'Errico's comment. |
||
| 1.0.0 |

