Spectrogram Visualization with Matlab
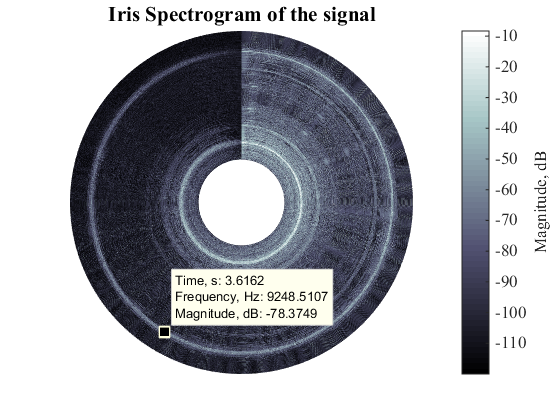
Irisgram - a new kind of visual representation of the time-frequency spectrogram.
You are now following this Submission
- You will see updates in your followed content feed
- You may receive emails, depending on your communication preferences
Cite As
H. Zhivomirov. A Novel Visual Representation of the Signals in the Time-Frequency Domain. The Scientific Bulletin, Series C: Electrical Engineering and Computer Science, ISSN: 2286-3540, Vol. 80, Issue 3, pp. 75-84, 2018. (https://www.scientificbulletin.upb.ro/rev_docs_arhiva/rez786_869448.pdf)
Hristo Zhivomirov (2026). Spectrogram Visualization with Matlab (https://in.mathworks.com/matlabcentral/fileexchange/64882-spectrogram-visualization-with-matlab), MATLAB Central File Exchange. Retrieved .
General Information
- Version 1.3.0 (1.36 MB)
MATLAB Release Compatibility
- Compatible with any release
Platform Compatibility
- Windows
- macOS
- Linux

