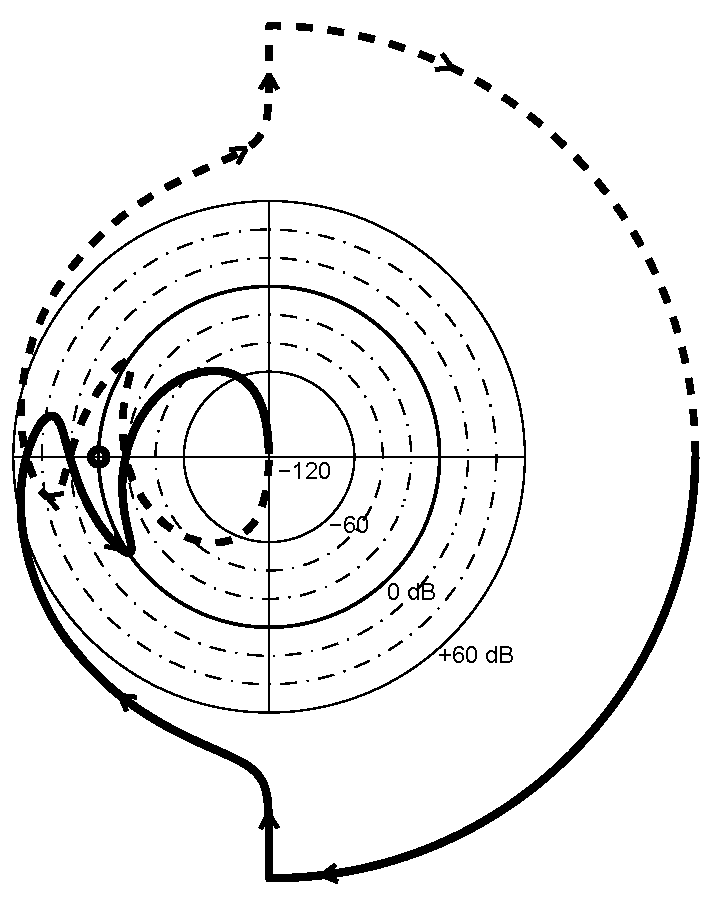
Nyquist plot with logarithmic amplitudes
Logarithmically scaled Nyquist plot: viewing problems due to near-infinite amplitudes are avoided.

You are now following this Submission
- You will see updates in your followed content feed
- You may receive emails, depending on your communication preferences
Cite As
Trond Andresen (2026). Nyquist plot with logarithmic amplitudes (https://in.mathworks.com/matlabcentral/fileexchange/7444-nyquist-plot-with-logarithmic-amplitudes), MATLAB Central File Exchange. Retrieved .
General Information
- Version 1.6.0 (6.53 KB)
MATLAB Release Compatibility
- Compatible with any release
Platform Compatibility
- Windows
- macOS
- Linux
| Version | Published | Release Notes | Action |
|---|---|---|---|
| 1.6.0 | An example graph of a plot has been added |
||
| 1.5.0 | small bug fixed |
||
| 1.4.0 | New in February 2009: Bugs are fixed. Furthermore, the function also counts possible poles on the im-axis for the closed-loop system. This corresponds to the graph going through -1. Encirclement counting is then impossible and is disabled. |
||
| 1.2.0 | New in February 2009: Bugs are fixed. Furthermore,
|
||
| 1.0.0 | A suggestion from a user is implemented: Encirclements are counted and info about poles in RHP, and open- and closed-loop (in)stability, is given. |

