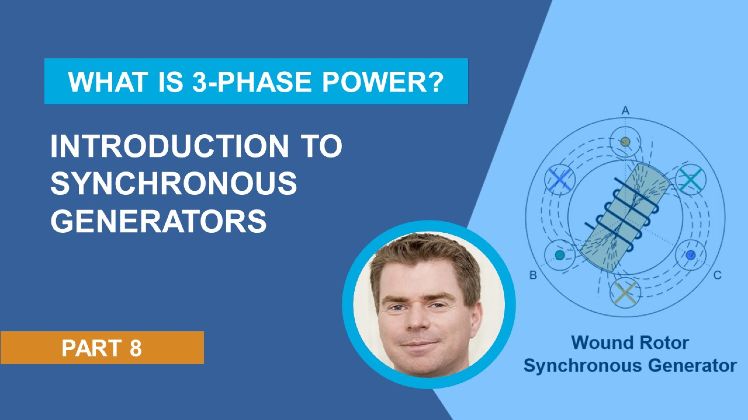
Power Quality and Harmonic Analysis | What Is 3-Phase Power?, Part 7
From the series: What Is 3-Phase Power?
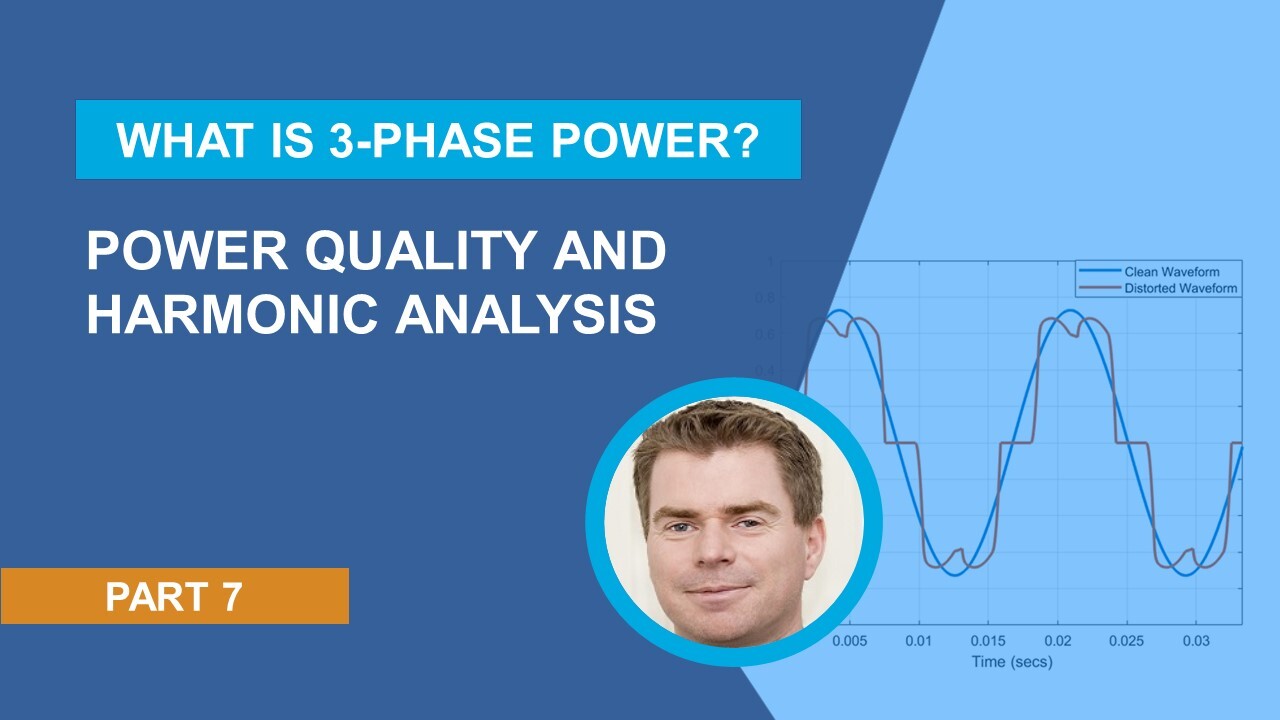
In AC electrical systems, a deviation in an AC waveform from a perfect sinusoid with nominal magnitude and frequency lowers the quality of supply, which can adversely affect system operation. Understanding what types of power quality issues occur and how to measure those issues is important for effective system monitoring, control, and protection.
You will learn:
- Different categories of power quality issues
- The definition of fundamental and harmonic components
- How a distorted periodic waveform may be represented as a sum of sinusoids
- How to perform harmonic analysis and calculate total harmonic distortion (THD)
- How higher-frequency current harmonics attenuate in the presence of inductance
Published: 13 Jun 2022
Hello, everyone. My name is Graham Dudgeon, and welcome to part 7 in a series of tutorials on 3-phase power. The aim of the video series is to build up our engineering knowledge on the design, analysis, and operation of 3-phase electrical power systems. Today, we'll explore power quality and harmonic analysis.
In an AC electrical power system, a waveform with 100% quality is a perfect sinusoid, with zero DC offset, a magnitude equal to nominal magnitude, and a frequency equal to nominal system frequency. Any waveform that deviates from the above condition will lower the power quality. Quality issues can therefore arise in three areas-- the frequency deviates from nominal, magnitude deviates from nominal, or the waveform distorts from a perfect sinusoid. I'll show examples of the first two points, and then we'll spend a little more time on point three, as this is where we consider harmonic analysis.
Here, I'm showing some fundamental deviations in voltage magnitude and frequency. At the top left, we have an overvoltage, where the voltage magnitude is greater than nominal magnitude for an extended period of time. If the voltage increases in magnitude for a short duration, it's called a voltage swell. On the top right, we have an undervoltage, where the voltage magnitude is less than nominal magnitude for an extended period of time. If the voltage decreases in magnitude for a short duration, it is called a voltage sag.
On the bottom left, we see an overfrequency, where the voltage frequency is greater than nominal frequency for an extended period of time. And on the bottom right is an underfrequency, where the voltage frequency is less than nominal frequency for an extended period of time.
All of these conditions have the potential to cause problems with the operation of electrical equipment and so are undesirable conditions. In practice, we can adjust these conditions through control action to bring them back to nominal or connect and disconnect equipment as appropriate through the use of protection relays.
When a waveform is no longer a perfect sinusoid, we say it is distorted. I'm showing three types of waveform distortion here-- voltage flicker, voltage notching, and, also, current harmonics. Flicker is so-called because the human eye can detect it when flicker causes lights to flicker. The frequency of flicker that is detectable by the human eye is around 8 to 10 hertz. Flicker is caused by rapidly changing loads on the broader electrical system. At the top, you can see one representation of flicker, where I've added an 8 hertz distortion to the main 60 hertz supply.
Notch changes where voltage is disrupted for a short period of time within a single period, and it's typically caused by power electronic switching. The notching I'm showing here is caused by a 3-phase diode rectifier. I'm only showing fesoid line voltage for clarity.
The third example is fesoid light current for a 3-phase diode rectifier. You can see in each case the waveforms are distorted from nominal waveforms. Voltage notching is caused by power electronics, and so as a specific example of harmonic distortion. More generally, harmonics are frequency components greater than the system frequency, and so we need a way to quantify the harmonic distortion. The way we do this is to perform harmonic analysis.
A periodic waveform can be represented as a sum of sinusoids that are an integer multiple of the periodic waveform's fundamental frequency. This sum of sinusoids is known as a Fourier Series. Here, you can see the expression of a simplified Fourier Series, where f omega t is the periodic waveform, M sub n is the magnitude of the nth component, and phi sub n is the phase shift of the nth component. N equals 1 is known as the fundamental component and n equals 2 and greater are known as harmonic components. For more information on Fourier Series, you'll find extensive literature online.
Here's a simple example of two sinusoids adding to create a distorted periodic waveform. In this case, the blue waveform is the fundamental component, and the red waveform is a third harmonic component. So it's all very well that I've created a distorted waveform, but I need to be able to analyze distorted waveforms and break them down into the fundamental and harmonic components.
Within Simscape Electrical, we have a fast Fourier transform or FFT analysis function, and so I'll use that for the remainder of this tutorial. We'll first test it on this waveform we have here, as we knew exactly what the result should be.
Here, I have the analysis of the distorted waveform. You can see that it has correctly identified the third harmonic with a magnitude of 30% of the fundamental magnitude. Notice the analysis has a value associated with an acronym, THD. This is total harmonic distortion and is a measure of what percentage of distortion there is relative to the fundamental component. Here is the equation for total harmonic distortion. We take the RMS of the magnitudes of the harmonic components and divide that by the magnitude of the fundamental.
We'll now look at some additional distorted reforms, which are more representative of what we can see on AC electrical systems with power electronics included. We'll start with a square wave. On the top left, I'm showing the square wave and also a reconstruction of the waveform from its harmonic components as identified in the FFT analysis at the bottom right. Note I'm only showing up to the 16th harmonic on the FFT for clarity.
It's seen that square wave is made up of odd harmonics-- 3, 5, 7, 9, et cetera. And there's a total harmonic distortion of 48.54. In the visualization, I'm adding the harmonics one at a time. Note that I can't extend the harmonic addition to infinity, so you're not going to see a perfect match. But I'm adding enough such that you can see the basic waveform construction.
Next, we'll look at a three-level square wave. It's seen that this wave is made up of 5th and 7th, 11th and 13th harmonics, and so on. Total harmonic distortion is 31.47% This harmonic signature is typical of a so-called 6-pulse device, where switching is occurring every 60 degrees. We see odd harmonics sidebanded around multiples of 6. If we extend the harmonic analysis out, we would see harmonics at 17th and 18th, 23rd and 25th, and so on. We refer to the 5th and 7th harmonics, in this case, as the first significant harmonics.
Next, we'll look at a voltage created from a Pulse-Width Modulation, or PWM signal, where the carrier frequency is 5 times the modulation frequency. For more information on PWM, please refer to part 6 of this tutorial series.
It's seen that the first significant harmonics are 9th and 11th. The first significant harmonics are sidebanded around the 10th harmonics. So why the 10th harmonic? The answer, in this case, is due to the carrier being five times the frequency of the modulation wave and due to the converter being a two-level converter. We multiply 5 by 2 to get 10.
In this example, the carrier frequency is 20 times the modulation frequency. As we have a two-level converter, the first significant harmonics are sidebanded around the 40th harmonic, and the next harmonics are sidebanded around the 80th harmonic, and so on. In the reconstruction of the wave, note the bursts of harmonics as we move through multiples of the 40th harmonic. Note that it's desirable to have a higher carrier frequency so that the harmonics move further up the spectrum, where more attenuation can occur.
In my final example, I'm showing the AC current waveform when there is inductance in the load. Inductance acts as a filter for current and helps attenuate higher frequency components. At the top, you can see the current when the carrier frequency is 5 times the modulation frequency. And at the bottom, you can see the current when the carrier frequency is 20 times the modulation frequency. Note that the total harmonic distortion on the lower waveform is reduced compared to the upper waveform and we can also visually see that this is the case.
So in summary, in an AC electrical power system, a waveform with 100% quality is a perfect sinusoid with zero DC offset, a magnitude equal to nominal magnitude, and a frequency equal to nominal system frequency. Any voltage or current waveform that does not meet the above criteria will lower the overall power quality of the system.
Quality issues can arise in three main areas-- deviation of frequency from nominal, deviation of magnitude from nominal, and distortion of a waveform from a perfect sinusoid. A periodic waveform can be represented as a sum of sinusoids that are integer multiples of the periodic waveform's fundamental frequency.
Fast Fourier Transform, or FFT, analysis is used to analyze the harmonic signature of a waveform. And Total Harmonic Distortion, THD, gives a measure of the harmonic distortion. Higher switching frequencies are favorable as the higher the switching frequency, the greater the attenuation, and the less the total harmonic distortion I hope you found this information useful. Thank you for listening.


Select a Web Site
Choose a web site to get translated content where available and see local events and offers. Based on your location, we recommend that you select: United States.
You can also select a web site from the following list
Americas
- América Latina (Español)
- Canada (English)
- United States (English)
Europe
- Belgium (English)
- Denmark (English)
- Deutschland (Deutsch)
- España (Español)
- Finland (English)
- France (Français)
- Ireland (English)
- Italia (Italiano)
- Luxembourg (English)
- Netherlands (English)
- Norway (English)
- Österreich (Deutsch)
- Portugal (English)
- Sweden (English)
- Switzerland
- United Kingdom (English)