addCursor
Add cursor to polar plot angle
Description
id = addCursor(___) returns
a cell array with one ID for each cursor created. You can specify
any of the arguments from the previous syntaxes.
Examples
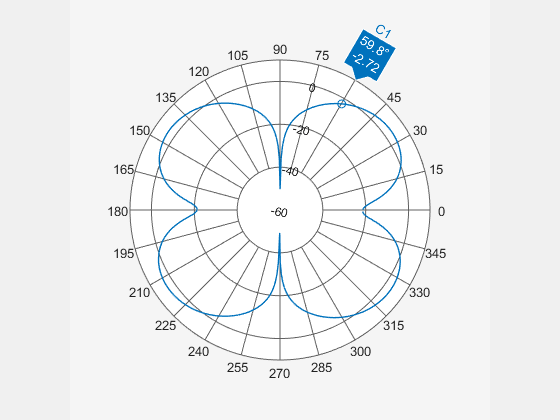
Create a dipole antenna and calculate its directivity at a frequency of 270 MHz.
d = dipole;
D = pattern(d,270e6,0,0:1:360);
Add a cursor to the polar plot at approximately 60 degrees. To place the cursor at 60 degrees, move it there by placing the pointer on the cursor and dragging.
p = polarpattern(D);
addCursor(p,60);
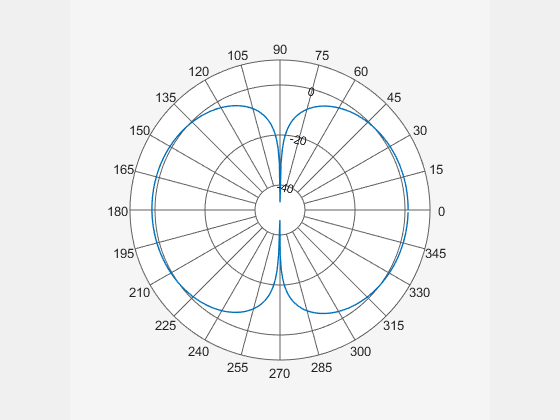
Create a top-hat monopole and plot its directivity at a frequency of 75 MHz.
m = monopoleTopHat;
M = pattern(m,75e6,0,0:1:360);
P = polarpattern(M);
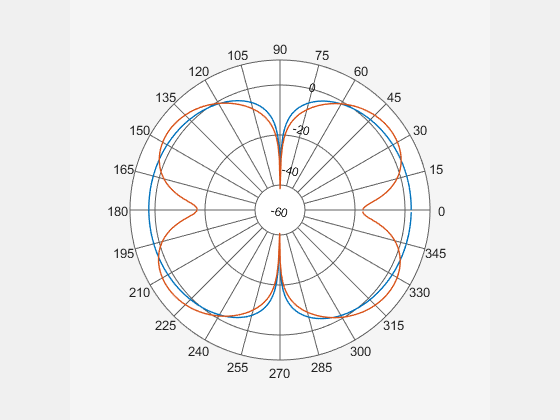
Create a dipole antenna and calculate its directivity at a frequency of 270 MHz.
d = dipole;
D = pattern(d,270e6,0,0:1:360);
Add the directivity pattern of the dipole to the polar plot of the top-hat monopole.
add(P,D);
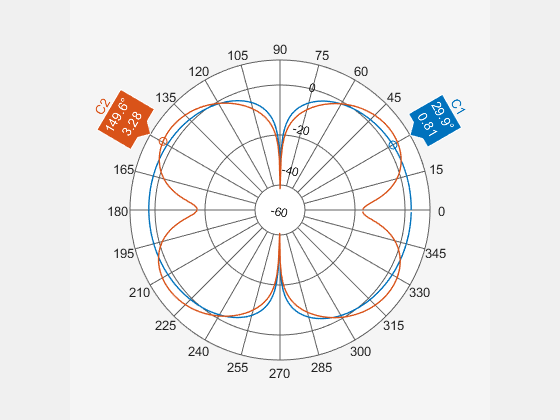
Add a cursor at approximately 30 degrees to the top-hat monopole polar pattern (data set 1) and at approximately 150 degrees to the dipole polar pattern (data set 2).
addCursor(P,[30 150],[1 2]);
Input Arguments
Version History
Introduced in R2016a
See Also
add | animate | createLabels | findLobes | replace | showPeaksTable | showSpan