visualize
Description
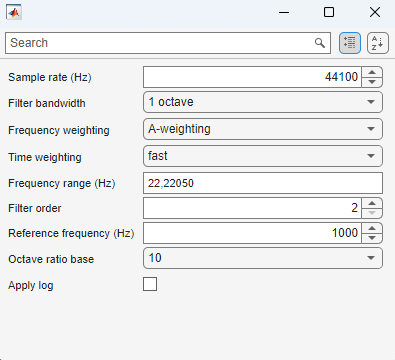
visualize( plots the octave spectrum
computed by the o)octaveSpectrumEstimator
System object™. The visualization is updated with the computed spectrum as the simulation
progresses.
Examples
Input Arguments
Output Arguments
More About
Version History
Introduced in R2024b


