Capture Packets to PCAP and Correlate with Logged Events
This example shows how to visualize, capture, and analyze packets and events in a Bluetooth® low energy (LE) and WLAN coexistence scenario. Bluetooth LE transmit and receive events represent link layer (LL) packet exchanges, whereas WLAN transmit and receive events reflects MAC layer behavior, including frame aggregation, retransmissions, and contention.
Using this example, you can:
Create a Bluetooth LE-WLAN coexistence scenario consisting of a Central node, a Peripheral node, an access point (AP), and a station (STA).
Add On-Off application traffic between the nodes.
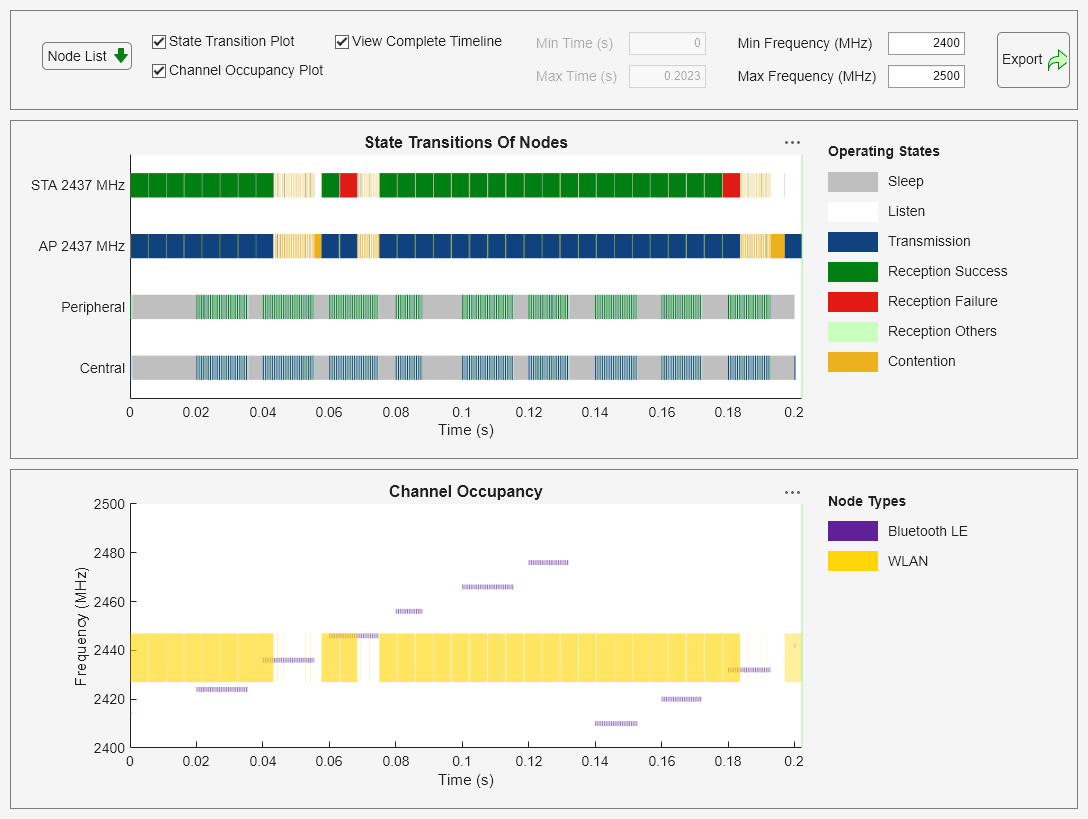
Simulate the scenario, and visualize the state transitions and channel occupancy of the nodes.
Log, read, and filter events from the nodes.
Write Bluetooth LE LL and WLAN MAC packets to separate packet capture (PCAP) files.
Analyze the captured packets in Wireshark and correlate them with the logged events.
Set the random number generator to 1 to ensure the repeatability of results. The seed value controls the pattern of random number generation. Initializing the random number generator using the same seed ensures the same result. To improve the accuracy of your simulation results, after running the simulation, you can change the seed value, run the simulation again, and average the results over multiple simulations.
rng(1,"combRecursive")Initialize the wireless network simulator.
networkSimulator = wirelessNetworkSimulator.init;
Create Bluetooth LE Nodes and Add Traffic
Create a Bluetooth LE Central node and a Peripheral node, specifying their names and positions (in meters).
centralNode = bluetoothLENode("central",Name="Central", ...
    Position=[0 0 0]);          % In x-, y-, and z-coordinates
peripheralNode = bluetoothLENode("peripheral",Name="Peripheral", ...
    Position=[1 0 0]);          % In x-, y-, and z-coordinates
Create a default Bluetooth LE link layer (LL) connection configuration object. Configure the LL connection between the Central and Peripheral nodes.
cfgConnection = bluetoothLEConnectionConfig;
configureConnection(cfgConnection,centralNode,peripheralNode);
Create and configure On-Off application traffic, specifying the data rate (in Kbps), packet size (bytes), On state and Off state duration (in seconds). Add application traffic at the Central node to Peripheral node.
LETraffic = networkTrafficOnOff(DataRate=200,PacketSize=27,OnTime=inf);
addTrafficSource(centralNode,LETraffic,DestinationNode=peripheralNode);
Create WLAN Nodes and Add Traffic
Configure a WLAN node as an AP by specifying the operating mode and type of interference modeling. Create a WLAN AP from the specified configuration, specifying the name, position (in meters), MAC frame abstraction method, and PHY abstraction method.
accessPointCfg = wlanDeviceConfig(Mode="AP",BandAndChannel=[2.4 6],InterferenceModeling="overlapping-adjacent-channel");
accessPointNode = wlanNode(Name="AP",Position=[0 10 0],DeviceConfig=accessPointCfg,MACModel="full-mac",PHYModel="full-phy");
Configure a WLAN node as an STA by specifying the operating mode and type of interference modeling. Create a WLAN STA from the specified configuration, specifying the name, position (in meters), MAC frame abstraction method, and PHY abstraction method.
stationCfg = wlanDeviceConfig(Mode="STA",BandAndChannel=[2.4 6],InterferenceModeling="overlapping-adjacent-channel");
stationNode = wlanNode(Name="STA",Position=[5 0 0],DeviceConfig=stationCfg,MACModel="full-mac",PHYModel="full-phy");
Associate the STA node with the AP node.
associateStations(accessPointNode,stationNode)
Create and configure On-Off application traffic, specifying the data rate (in Kbps), and packet size (in bytes). Add the application traffic at the AP node to the STA node.
wlanTraffic = networkTrafficOnOff(DataRate=10e6,PacketSize=1500,OnTime=inf);
addTrafficSource(accessPointNode,wlanTraffic,DestinationNode=stationNode)
Add Nodes to Simulator
Add all the nodes to the wireless network simulator.
addNodes(networkSimulator,[centralNode peripheralNode])
addNodes(networkSimulator,[accessPointNode stationNode])
Configure Traffic Viewer and Event Tracer
Create a default wirelessTrafficViewer object. Add all the nodes to the wireless traffic viewer.
trafficViewer = wirelessTrafficViewer;
addNodes(trafficViewer,networkSimulator.Nodes)
Create a wirelessNetworkEventTracer object, specifying the name of the MAT file in which you want to log events.
if exist("EventLog.mat","file")
    delete("EventLog.mat")
end
eventTracer = wirelessNetworkEventTracer(FileName="EventLog.mat");
Add all the nodes to the wireless network event tracer.
addNodes(eventTracer,networkSimulator.Nodes)
Write Bluetooth LE Packets to PCAP File
Write LL packets captured by the Central node and Peripheral node to a PCAP file. Write WLAN packets captured by the AP node and STA node to a PCAP file. You can open the PCAP file in a packet analyzer tool such as Wireshark and analyze the packets.
pcapLEObj = blePCAPWriter(FileName="LEPackets.pcap",FileExtension="pcap",Node=[centralNode peripheralNode]);
pcapWLANObj = wlanPCAPWriter(FileName="WLANPackets.pcap",FileExtension="pcap",Node=[accessPointNode stationNode]);
Simulate and Visualize Network Traffic and Log Events
Specify the simulation time (in seconds) and run the simulation.
simulationTime = 0.2;
run(networkSimulator,simulationTime)
Read and filter all the logged events from the MAT file.
eventsAll = read(eventTracer);
Read the events from the Central and AP nodes related to the TransmissionStarted event, and from the Peripheral and STA nodes related to the ReceptionEnded event.
centralTx = read(eventTracer,EventName="TransmissionStarted",NodeName="Central")
centralTx=1×179 struct array with fields:
    EventName
    NodeName
    NodeID
    Timestamp
    TechnologyType
    EventData
peripheralRx = read(eventTracer,EventName="ReceptionEnded",NodeName="Peripheral")
peripheralRx=1×178 struct array with fields:
    EventName
    NodeName
    NodeID
    Timestamp
    TechnologyType
    EventData
accessPointTx = read(eventTracer,EventName="TransmissionStarted",NodeName="AP")
accessPointTx=1×66 struct array with fields:
    EventName
    NodeName
    NodeID
    Timestamp
    TechnologyType
    EventData
stationRx = read(eventTracer,EventName="ReceptionEnded",NodeName="STA")
stationRx=1×65 struct array with fields:
    EventName
    NodeName
    NodeID
    Timestamp
    TechnologyType
    EventData
Analyze Wireshark Output and Correlate with Logged Events
After running the simulation, you can analyze output and visualization from these sources:
Traffic viewer — As the simulation runs, you can see packets moving between the nodes in the traffic viewer. You can see when packets are being transmitted, how each node moves between the transmit, listen, receive, and sleep states, and how traffic flows through the network.
Event tracer — For each of the packets moving between the nodes, the event tracer creates multiple log entries in the
EventLog.matMAT file. Every time the Central node or the AP transmits a packet, the file logs aTransmissionStartedevent. Every time the Peripheral node or the STA completes receiving a packet, the file logs aReceptionEndedevent. When you read from this file, you get detailed information about when transmissions started and receptions ended. Note that these events represent PHY transmit and receive instances that correspond to Bluetooth LE LL or WLAN MAC packet activity.PCAP file — You have captured the actual Bluetooth LE packets transmitted and received between the Central and Peripheral nodes in the
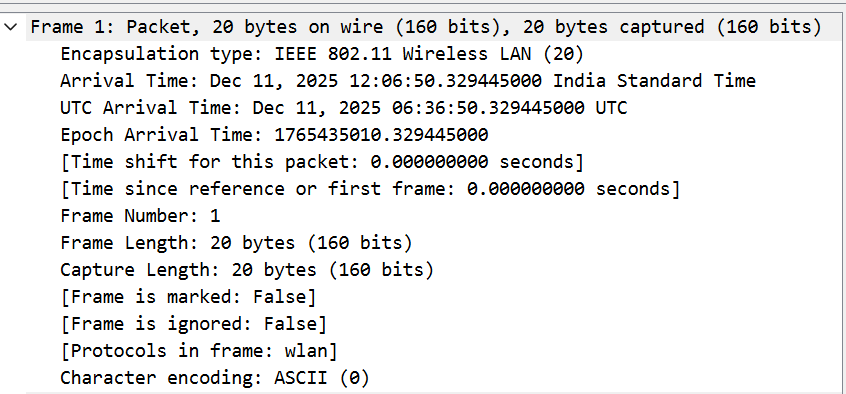
LEPackets.pcapPCAP file. TheWLANPackets.pcapPCAP file contains the captured WLAN packets. When you open a PCAP file in Wireshark, you can see the raw packet data that traveled between the nodes. These figures show the output from Wireshark related to theLEPackets.pcapPCAP file.
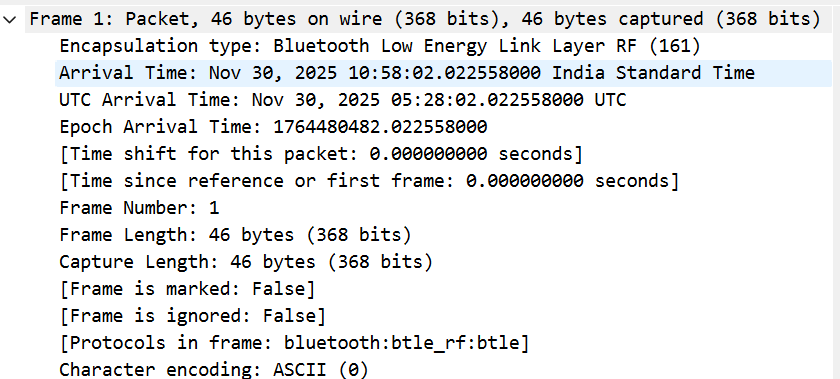
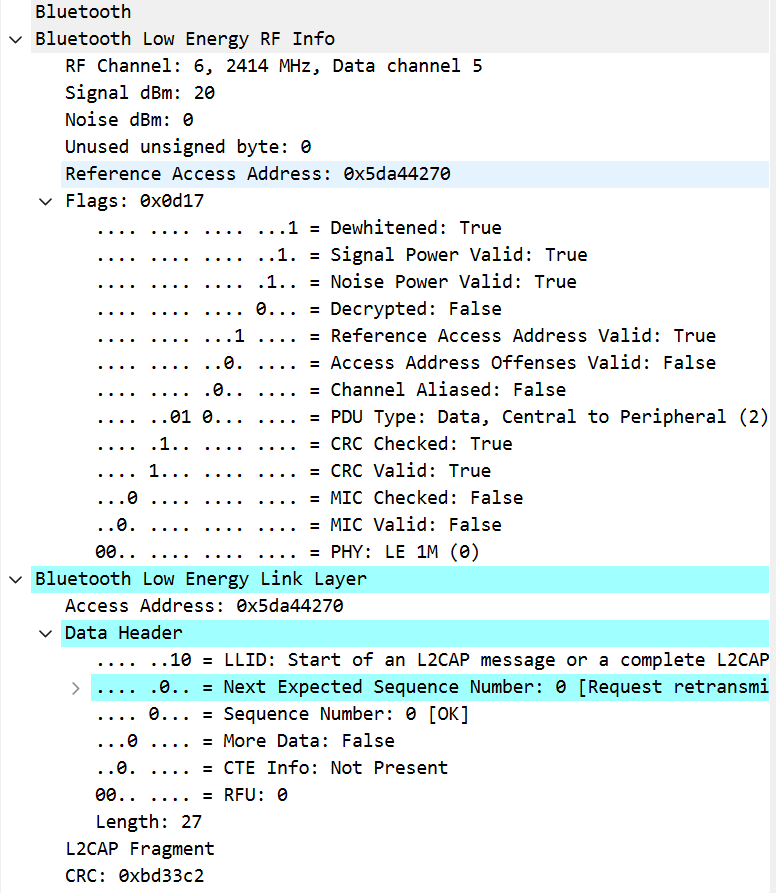
The Wireshark output includes a view with protocol-level details of the data communication. For example, the PDU Type flag in this view indicates that the selected data packet is traveling from the Central node to the Peripheral node. The Data Header section has a Length value of 27, which matches the packet size you specified for the On-Off application traffic generator. The Bluetooth LE LL uses the Sequence Number (SN) and Next Expected Sequence Number (NESN) fields to implement its acknowledgment (ACK) mechanism. The source node sets SN for each outgoing packet, and the destination node sets NESN to indicate which SN it expects next. When the source node sees that the NESN of the destination node matches with the SN it sent, it treats that as an ACK. Otherwise, the source node retransmits the packet. Wireshark displays both SN and NESN, enabling you to understand the ACK/NACK behavior by comparing consecutive packets. For example, an SN of 0 followed by an NESN of 1 indicates a successful ACK, whereas an NESN of 0 suggests a retransmission.
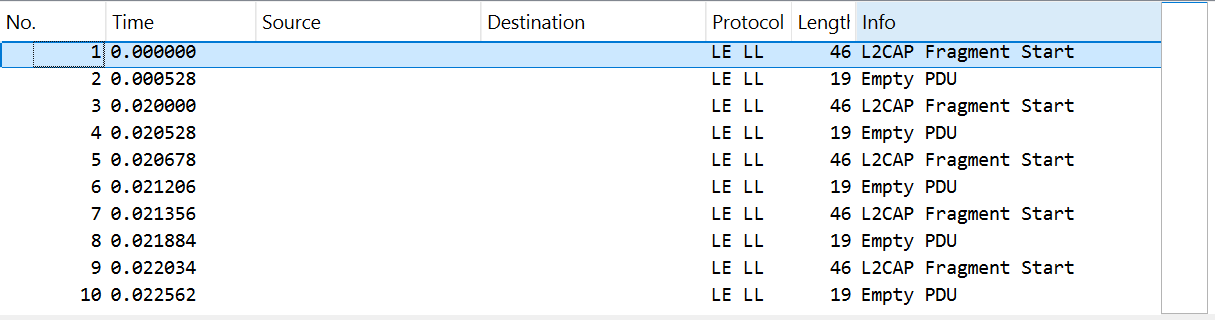
Observe list of multiple frames and their timestamps listed, starting with Frame 1 at 0.000000 seconds. Each frame corresponds to a packet you saw moving in the traffic viewer and an event pair (TransmissionStarted and ReceptionEnded) in the EventLog.mat MAT file. Frame 2, for example, has the label Empty PDU in Wireshark. This is a Bluetooth LE protocol control packet that maintains the connection event when no application data is available to send. You can see this packet in the traffic viewer. Also, observe that the event tracer has logged its transmission and reception.
In the Wireshark output, frames 1, 3, 5, 7, and 9 occur at times 0.000000, 0.020000, 0.020678, 0.021356, and 0.022034 seconds. Frames 2, 4, 6, 8, and 10, which are Empty PDU packets, arrive at times 0.000528, 0.020528, 0.021205, 0.021884, and 0.022562 seconds. Note that each data packet is followed by an empty PDU packet approximately 0.000528 seconds later. This pattern reflects the Bluetooth LE connection interval and the subsequent acknowledgments. In the traffic viewer, you can see this same pattern in which packets move from the Central node to Peripheral node in regular bursts, with short intervals between bursts. The logs in the EventLog.mat MAT file show you the precise timing of each burst.
These figures show the output from Wireshark related to the WLANPackets.pcap PCAP file.
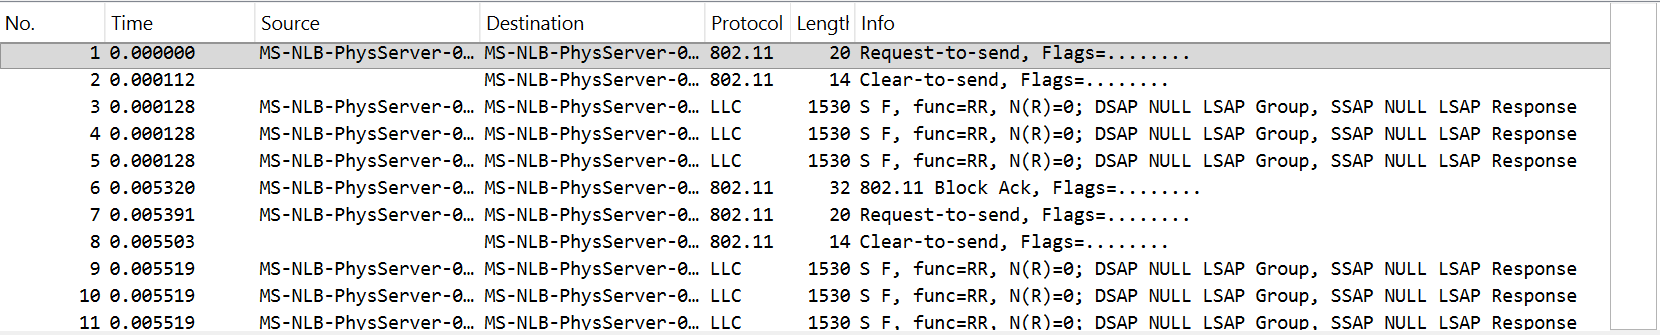
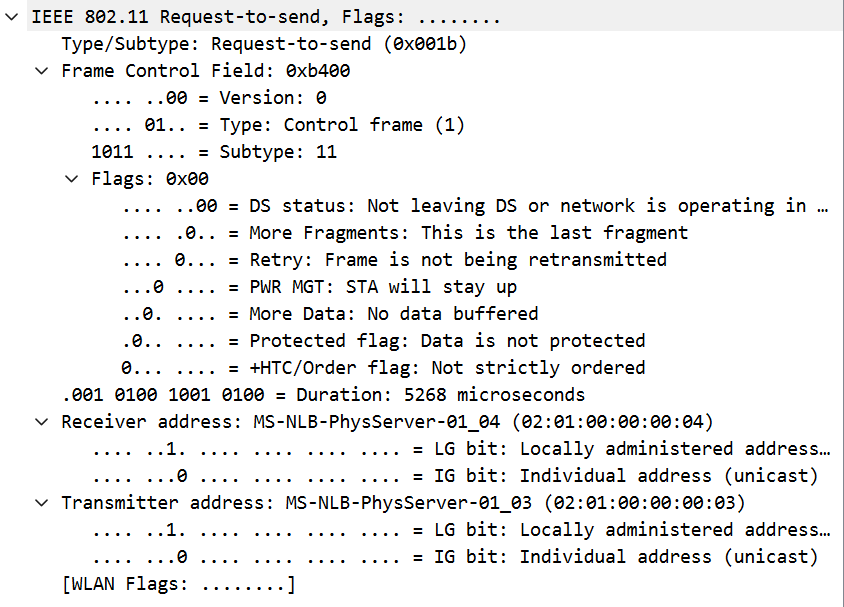
The Wireshark output shows the same WLAN MAC activity as recorded by the traffic viewer and event tracer. In Wireshark, the detail view of each Request-to-send (RTS) or Clear-to-send (CTS) frame shows the MAC addresses of the source and destination nodes for that frame, as well as a Duration field (in microseconds) that indicates the length for which the connection reserves the wireless medium. For each RTS and CTS pair, the event tracer logs a corresponding TransmissionStarted event for the AP (source node) at the RTS timestamp and a ReceptionEnded event for the STA (destination node) at the CTS timestamp. In the traffic viewer, those timestamps correspond to the AP transmission state and the wide yellow blocks in the channel occupancy plot, confirming the medium reservation and blocked airtime.
The data frames in the PCAP indicate MAC layer aggregation. The presence of Block Ack frames and large logical link control (LLC) payloads shows that the AP sent aggregated MPDUs to the STA node. The event tracer log contains longer TransmissionStarted durations for those AP transmissions, and the traffic viewer displays extended transmission bars and continuous channel occupancy for those time spans. To find an exact transmission in the simulator timeline, use the MAC source and destination addresses in the PCAP file to identify the AP and STA, then match the PCAP frame time to the event tracer timestamp.
View the Frame Control flags and Sequence Control in Wireshark to detect retransmissions and ordering. The Retry flag specifies if a frame has been retransmitted. The MAC sequence number and retry bit enables you to infer whether the source node retransmitted a frame. If the PCAP shows a Block Ack following the data frames, the MAC acknowledged the aggregated block. Otherwise, the event tracer or traffic viewer shows a failed reception or attempt to retransmit. To determine whether the destination node decoded the packet or the MAC triggered retransmission, compare the PCAP sequence or retry fields with the ReceptionEnded event data.
By matching these three types of information, you can correlate a PCAP frame, a traffic viewer state, and an event tracer log:
Timestamps — Compare the PCAP frame timestamp (Wireshark frame time) with the
TransmissionStartedorReceptionEndedtimestamps in theEventLog.matMAT file.Access address or MAC addresses — Use the Bluetooth LE access address or the WLAN MAC addresses in the PCAP file to identify the transmitter and receiver nodes.
SN and NESN fields — For Bluetooth LE, use the SN and NESN values captured in the PCAP file or in the
EventDatafield to infer whether a packet was acknowledged or whether a retransmit occurred. For WLAN, view the MAC sequence control and retry flags to infer retransmissions or aggregation.
Close the opened PCAP files by deleting the corresponding PCAP objects.
delete(pcapLEObj)
delete(pcapWLANObj)
References
[1] Bluetooth® Technology Website. “Bluetooth Technology Website | The Official Website of Bluetooth Technology.” Accessed December 22, 2025. https://www.bluetooth.com/.
[2] Bluetooth Special Interest Group (SIG). "Bluetooth Core Specification." v6.1. https://www.bluetooth.com/specifications/specs/core-specification-6-1/.
See Also
Objects
bluetoothLENode|bluetoothLEConnectionConfig|wlanNode(WLAN Toolbox) |wlanDeviceConfig(WLAN Toolbox) |wirelessNetworkSimulator(Wireless Network Toolbox) |wirelessNetworkEventTracer(Wireless Network Toolbox) |wirelessTrafficViewer(Wireless Network Toolbox) |networkTrafficOnOff(Wireless Network Toolbox) |blePCAPWriter|wlanPCAPWriter(WLAN Toolbox)
Topics
- Wireless Network Simulator (Wireless Network Toolbox)
- Event Tracing in Network Simulations (Wireless Network Toolbox)
- Generate Periodic, Bursty, and Random Traffic in Wireless Network (Wireless Network Toolbox)
- Overview of Traffic Models (Wireless Network Toolbox)