Display MATLAB Plot in Java Application
In this example, you integrate a MATLAB® function into a Java® application by performing these steps:
Use the MATLAB Compiler SDK™ product to convert a MATLAB function (
drawplot.m) to a method of a Java class (plotter) and wrap the class in a Java package (plotdemo).Access the MATLAB function in a Java application (
createplot.java) by instantiating theplotterclass and using theMWArrayclass library to handle data conversion.Note
For complete reference information about the
MWArrayclass hierarchy, see thecom.mathworks.toolbox.javabuilderpackage.Build and run the
createplot.javaapplication.
Files
| MATLAB Function Location | |
| Java Code Location | |
Procedure
Copy the
PlotExamplefolder that ships with MATLAB to your work folder:copyfile(fullfile(matlabroot,'toolbox','javabuilder','Examples','PlotExample'),'PlotExample')
At the MATLAB command prompt, navigate to the new
PlotExample\PlotDemoCompsubfolder in your work folder.Examine the
drawplot.mfunction.function drawplot(x,y) plot(x,y);The function displays a plot of input parameters
xandy.Create a Java package by using the Java Package Compiler app or
compiler.build.javaPackageusing the following information:Project Name plotdemoClass Name plotterFile to Compile drawplot.mFor example, if you are using
compiler.build.javaPackage, type:buildResults = compiler.build.javaPackage('drawplot.m', ... 'PackageName','plotdemo', ... 'ClassName','plotter');
For more details, see the instructions in Generate Java Package and Build Java Application.
Write source code for a Java application that accesses the MATLAB function.
The sample application for this example is in
PlotExample\PlotDemoJavaApp\createplot.java.The program does the following:
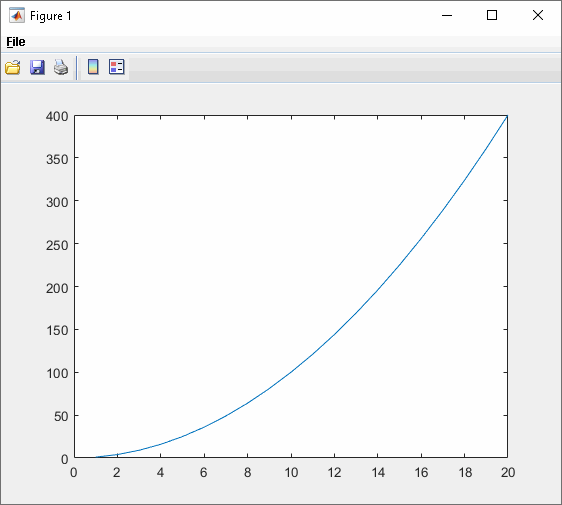
Creates two arrays of double values
xandyusingMWNumericArrayto represent the equation y = x2Instantiates the
plotterclass asthePlotobjectthePlot = new plotter();
Calls the
drawplotmethod to plot a simple parabola using the MATLABplotfunctionthePlot.drawplot(x,y);
Uses a
try-catchblock to catch and handle any exceptions
In MATLAB, navigate to the
PlotDemoJavaAppfolder.Copy the generated
plotdemo.jarpackage into this folder. For instance, If you usedcompiler.build.javaPackage, type:copyfile(fullfile('..','PlotDemoComp','plotdemojavaPackage','plotdemo.jar'))
In a command prompt window, navigate to the
PlotDemoJavaAppfolder where you copiedplotdemo.jar.Compile the
createplotapplication usingjavac.On Windows®, execute this command:
javac -classpath "matlabroot\toolbox\javabuilder\jar\javabuilder.jar";.\plotdemo.jar createplot.javaOn UNIX®, execute this command:
javac -classpath "matlabroot/toolbox/javabuilder/jar/javabuilder.jar":./plotdemo.jar createplot.java
Replace
matlabrootC:\Program Files\MATLAB\R2025b.Run the
createplotapplication.On Windows, type:
java -classpath .;"matlabroot\toolbox\javabuilder\jar\javabuilder.jar";.\plotdemo.jar createplotOn UNIX, type:
java -classpath .:"matlabroot/toolbox/javabuilder/jar/javabuilder.jar":./plotdemo.jar createplot
The
createplotprogram displays the following output.
See Also
compiler.build.javaPackage | Java Package
Compiler
