plotfit
Plot function fit
Syntax
Description
plotfit(
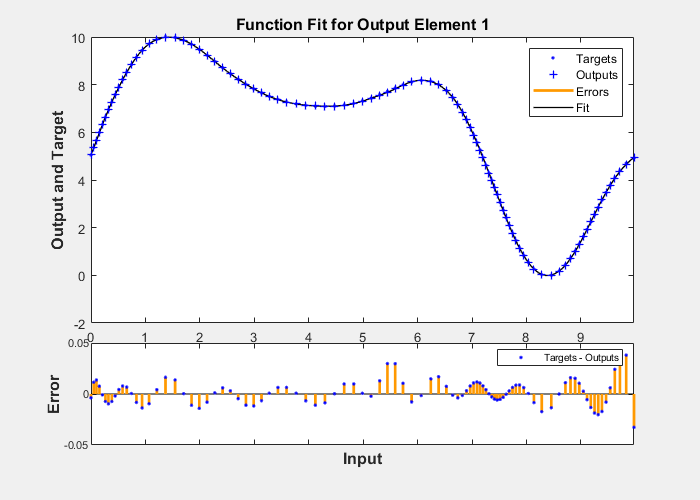
plots the output function of a network across the range of the inputs
net,inputs,targets)inputs and also plots target targets and output data
points associated with values in inputs. Error bars show the difference
between outputs and targets.
The plot appears only for networks with one input.
Only the first output/targets appear if the network has more than one output.
plotfit(net,inputs1,targets1,name1,inputs2,targets2,name2,...)
plots multiple sets of data.
plotfit(...,'outputIndex',outputIndex) plots using an optional
parameter that overrides the default index of the output element.
Examples
Input Arguments
Version History
Introduced in R2008a

