trackPlotter
Track plotter for bird's-eye plot
Description
tPlotter = trackPlotter(bep)TrackPlotter object that configures the display of tracks on a
bird's-eye plot. The TrackPlotter object is stored in the
Plotters property of the input birdsEyePlot object, bep. To display the tracks, use the
plotTrack function.
tPlotter = trackPlotter(bep,Name,Value)Name,Value pair arguments. For
example, trackPlotter(bep,'DisplayName','Tracks') sets the display name
that appears in the bird's-eye-plot legend.
Examples
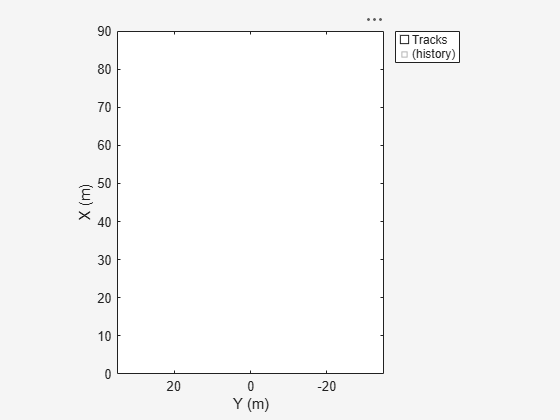
Create a bird's-eye plot with an x-axis range from 0 to 90 meters and a y-axis range from –35 to 35 meters. Create a track plotter that displays up to seven history values for each track and offsets labels by 3 meters in front of the tracks.
bep = birdsEyePlot('XLim',[0 90],'YLim',[-35 35]);
tPlotter = trackPlotter(bep,'DisplayName','Tracks','HistoryDepth',7,'LabelOffset',[3 0]);
Set the positions and velocities of three labeled tracks.
positions = [30, 5; 30, 5; 30, 5];
velocities = [3, 0; 3, 2; 3, -3];
labels = {'T1','T2','T3'};
Display the tracks for 10 trials. The bird's-eye plot shows the seven history values specified previously.
for i=1:10
   plotTrack(tPlotter,positions,velocities,labels);
   positions = positions + velocities;
end

Input Arguments
Name-Value Arguments
Specify optional pairs of arguments as
Name1=Value1,...,NameN=ValueN, where Name is
the argument name and Value is the corresponding value.
Name-value arguments must appear after other arguments, but the order of the
pairs does not matter.
Before R2021a, use commas to separate each name and value, and enclose
Name in quotes.
Example: trackPlotter('Marker','*') sets the marker symbol for tracks
to an asterisk.
Plotter name to display in legend, specified as the comma-separated pair consisting of
'DisplayName' and character vector or string scalar. If you do
not specify a name, the bird's-eye plot does not display a legend entry for the
plotter.
Number of previous track updates to display, specified as the comma-separated pair
consisting of 'HistoryDepth' and an integer in the range [0, 100].
When you set this value to 0, the bird's-eye plot displays no
previous updates.
Marker symbol for tracks, specified as the comma-separated pair consisting of
'Marker' and one of the markers in this table.
| Marker | Description | Resulting Marker |
|---|---|---|
"o" | Circle |
|
"+" | Plus sign |
|
"*" | Asterisk |
|
"." | Point |
|
"x" | Cross |
|
"_" | Horizontal line |
|
"|" | Vertical line |
|
"square" | Square |
|
"diamond" | Diamond |
|
"^" | Upward-pointing triangle |
|
"v" | Downward-pointing triangle |
|
">" | Right-pointing triangle |
|
"<" | Left-pointing triangle |
|
"pentagram" | Pentagram |
|
"hexagram" | Hexagram |
|
"none" | No markers | Not applicable |
Size of marker for tracks, specified as the comma-separated pair consisting of
'MarkerSize' and a positive integer in points.
Marker outline color for tracks, specified as the comma-separated pair consisting
of 'MarkerEdgeColor' and an RGB triplet, a hexadecimal color code,
a color name, or a short color name.
For a custom color, specify an RGB triplet or a hexadecimal color code.
An RGB triplet is a three-element row vector whose elements specify the intensities of the red, green, and blue components of the color. The intensities must be in the range
[0,1], for example,[0.4 0.6 0.7].A hexadecimal color code is a string scalar or character vector that starts with a hash symbol (
#) followed by three or six hexadecimal digits, which can range from0toF. The values are not case sensitive. Therefore, the color codes"#FF8800","#ff8800","#F80", and"#f80"are equivalent.
Alternatively, you can specify some common colors by name. This table lists the named color options, the equivalent RGB triplets, and the hexadecimal color codes.
| Color Name | Short Name | RGB Triplet | Hexadecimal Color Code | Appearance |
|---|---|---|---|---|
"red" | "r" | [1 0 0] | "#FF0000" |
|
"green" | "g" | [0 1 0] | "#00FF00" |
|
"blue" | "b" | [0 0 1] | "#0000FF" |
|
"cyan"
| "c" | [0 1 1] | "#00FFFF" |
|
"magenta" | "m" | [1 0 1] | "#FF00FF" |
|
"yellow" | "y" | [1 1 0] | "#FFFF00" |
|
"black" | "k" | [0 0 0] | "#000000" |
|
"white" | "w" | [1 1 1] | "#FFFFFF" |
|
"none" | Not applicable | Not applicable | Not applicable | No color |
This table lists the default color palettes for plots in the light and dark themes.
| Palette | Palette Colors |
|---|---|
Before R2025a: Most plots use these colors by default. |
|
|
|
You can get the RGB triplets and hexadecimal color codes for these palettes using the orderedcolors and rgb2hex functions. For example, get the RGB triplets for the "gem" palette and convert them to hexadecimal color codes.
RGB = orderedcolors("gem");
H = rgb2hex(RGB);
Before R2023b: Get the RGB triplets using RGB =
get(groot,"FactoryAxesColorOrder").
Before R2024a: Get the hexadecimal color codes using H =
compose("#%02X%02X%02X",round(RGB*255)).
Marker fill color for tracks, specified as the comma-separated pair consisting of
'MarkerFaceColor' and an RGB triplet, a hexadecimal color code, a
color name, or a short color name.
For a custom color, specify an RGB triplet or a hexadecimal color code.
An RGB triplet is a three-element row vector whose elements specify the intensities of the red, green, and blue components of the color. The intensities must be in the range
[0,1], for example,[0.4 0.6 0.7].A hexadecimal color code is a string scalar or character vector that starts with a hash symbol (
#) followed by three or six hexadecimal digits, which can range from0toF. The values are not case sensitive. Therefore, the color codes"#FF8800","#ff8800","#F80", and"#f80"are equivalent.
Alternatively, you can specify some common colors by name. This table lists the named color options, the equivalent RGB triplets, and the hexadecimal color codes.
| Color Name | Short Name | RGB Triplet | Hexadecimal Color Code | Appearance |
|---|---|---|---|---|
"red" | "r" | [1 0 0] | "#FF0000" |
|
"green" | "g" | [0 1 0] | "#00FF00" |
|
"blue" | "b" | [0 0 1] | "#0000FF" |
|
"cyan"
| "c" | [0 1 1] | "#00FFFF" |
|
"magenta" | "m" | [1 0 1] | "#FF00FF" |
|
"yellow" | "y" | [1 1 0] | "#FFFF00" |
|
"black" | "k" | [0 0 0] | "#000000" |
|
"white" | "w" | [1 1 1] | "#FFFFFF" |
|
"none" | Not applicable | Not applicable | Not applicable | No color |
This table lists the default color palettes for plots in the light and dark themes.
| Palette | Palette Colors |
|---|---|
Before R2025a: Most plots use these colors by default. |
|
|
|
You can get the RGB triplets and hexadecimal color codes for these palettes using the orderedcolors and rgb2hex functions. For example, get the RGB triplets for the "gem" palette and convert them to hexadecimal color codes.
RGB = orderedcolors("gem");
H = rgb2hex(RGB);
Before R2023b: Get the RGB triplets using RGB =
get(groot,"FactoryAxesColorOrder").
Before R2024a: Get the hexadecimal color codes using H =
compose("#%02X%02X%02X",round(RGB*255)).
Font size for labeling tracks, specified as the comma-separated pair consisting of
'FontSize' and a positive integer in font points.
Gap between label and positional point, specified as the comma-separated pair consisting of
'LabelOffset' and a real-valued vector of the form
[x
y]. Units are in meters.
Scale factor for magnitude length of velocity vectors, specified as the comma-separated pair
consisting of 'VelocityScaling' and a positive real scalar. The
bird's-eye plot renders the magnitude vector value as M ×
VelocityScaling, where M is the magnitude of
velocity.
Tag associated with the plotter object, specified as the comma-separated pair
consisting of 'Tag' and a character vector or string scalar. The
default value is 'Plotter, where
N'N is an integer that corresponds to the
Nth plotter associated with the input birdsEyePlot object.
Output Arguments
Version History
Introduced in R2017a
See Also
birdsEyePlot | plotTrack | findPlotter | clearData | clearPlotterData