Inspect Sample and Frame Rates in Simulink
Simulink® enables you to model single-rate and multirate discrete systems. In a single-rate system, all the blocks in the model operate at the same rate. In a multirate system, different blocks operate at different rates. You can control the rate of block execution in a model by specifying the sample time (Simulink) (inverse of sample rate) at the block level. The sample time of a block indicates when the block generates outputs or updates its internal state. For more details on block execution rates, see Sample Time (Simulink). You can access sample time information interactively using tools such as Timing Legend and Model Data Editor (Simulink).
This topic explains how to inspect sample rates and frame rates in a Simulink model using color coding and Timing Legend. For more details on basic concepts such as samples and frames, sample time (also known as sample period), sample rate, frame period, and frame rate, all in the context of a Simulink model, see Sample- and Frame-Based Concepts.
Inspect Signal Rates Using Color Coding
You can inspect the sample rate and frame rate of signals in a Simulink model using color coding. When you enable color coding, each sample time type (Simulink) in your model has one or more colors associated with it. Furthermore, you can annotate these signals based on their sample time and show this data in a Timing Legend. The Timing Legend contains the sample time color, annotation, and value for each sample time in the model. For more details, see View Sample Time Information (Simulink).
The following two models enable you to inspect sample rate and frame rate of signals using the color coding technique.
View Signal Sample Rate Using Sample Time Color Coding
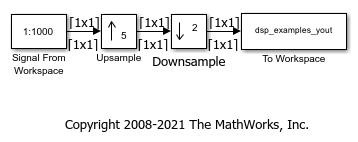
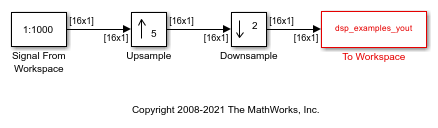
Open the model 'ex_color_tut1'. In this model, the input signal is upsampled by a factor of 5 using the Upsample block, and the signal downsampled by a factor of 2 using the Downsample block. The overall rate conversion factor is 5/2. The Signal From Workspace block that generates the input signal has the Sample time parameter set to 2 seconds, and the Samples per frame parameter is set to 1. The Input processing parameter in the Upsample and the Downsample blocks is set to Elements as channels (sample based). This setting enables the blocks to treat each sample they receive as an independent channel.
Enable Sample Time Color Coding
To enable sample time color coding in this model, on the Debug tab, select Information Overlays > Colors. This selection turns on sample time color coding. Simulink now assigns each sample time in the model a different color. In addition, to enable annotation for all sample times, select Information Overlays > Text. Selecting both Colors and Text displays both the colors and the annotations. Run the model. Every signal in this model has a different sample rate. Therefore, each signal is assigned a different color.

Inspect Sample Time Using Timing Legend
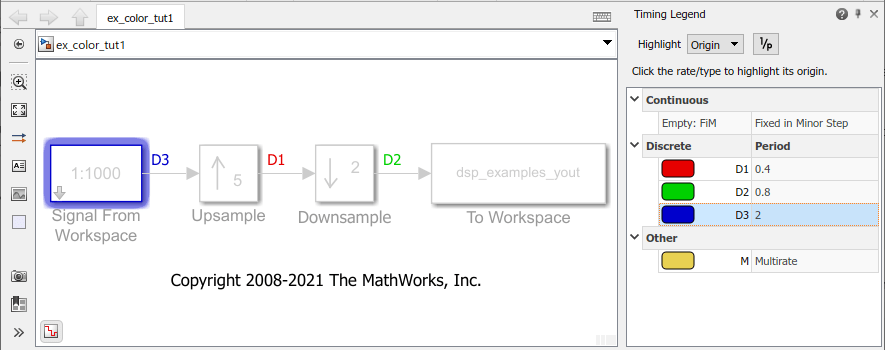
You can view the information on the sample time color, annotations, and the value of each sample time in the model using a Timing Legend. To enable this legend, select Information Overlays > Timing Legend. Simulink updates the model diagram and opens the Timing Legend. The Timing Legend shows the values of the frame period of the signal. In this example, because the Upsample and Downsample blocks treat each sample as an independent channel, and the Samples per frame parameter of the source block is set to 1 and the frame period of the signal is the same as the sample period (sample time) of the signal.
As you can see from the frame period values in the timing legend, signal D3 originating from the source block is the slowest with a sample time of 2 seconds. The Upsample block increases the sample rate of the signal by a factor of 5. As a result, the sample time reduces by a factor of 5 and becomes 0.4 seconds. Furthermore, the signal is downsampled by a factor of 2, making the sample time of the output signal D2 0.8 seconds.

The legend provides two highlighting options:
Highlighting the blocks and signals that the sample time originates from.
Highlighting all the blocks and signals that contain the selected sample time.
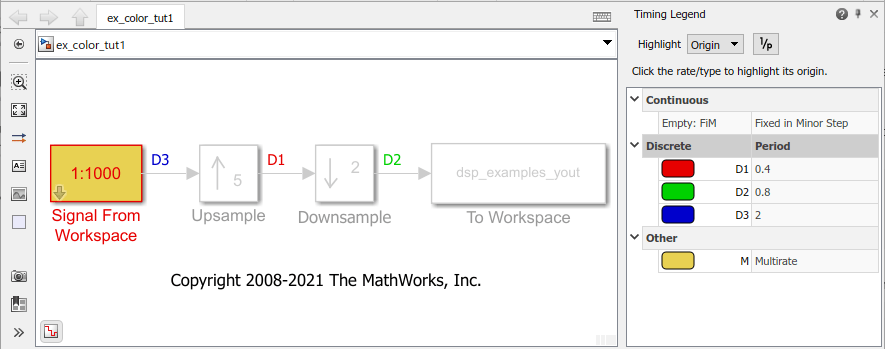
To enable highlighting the origin of the sample times, click the Origin option from the Highlight menu. Select a specific sample time from the list (D3 in this case) to see the source of this sample time.
You can also click the type of the sample time to highlight all sources of a particular type of sample time.
To enable highlighting of all the blocks that contain a selected sample time, click the All option from the Highlight menu.

The None option from the Highlight menu clears current highlighting.
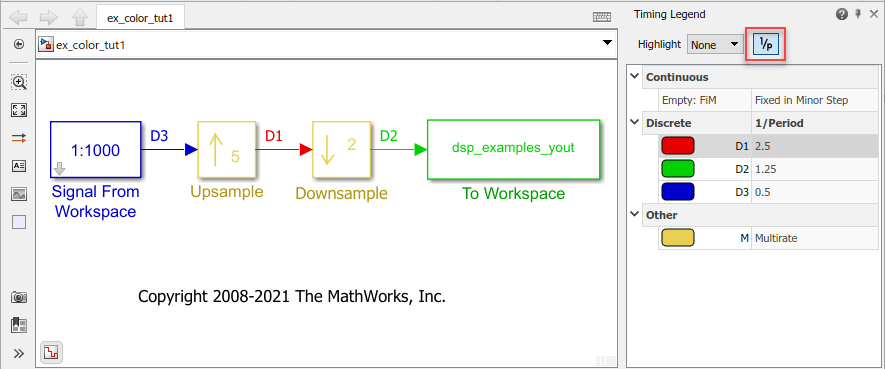
You can also display the sample rate (1/sample period) of the signal by clicking on the 1/p button. The timing legend displays 1/period values.
View Signal Frame Rate Using Sample Time Color Coding
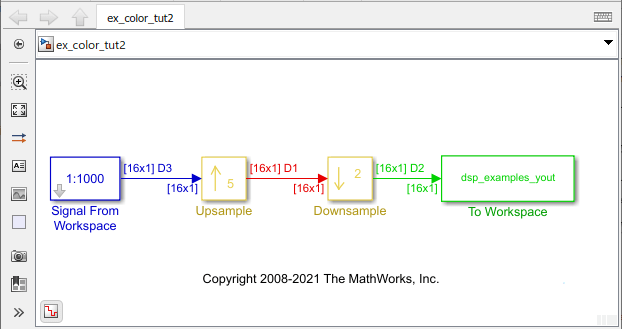
Open the model 'ex_color_tut2'. The Signal From Workspace block has the Sample time parameter set to 1, and the Samples per frame parameter is set to 16. Each frame in the generated signal contains 16 samples. The Input processing parameter in the Upsample and the Downsample blocks is set to Columns as channels (frame based) and the Rate options parameter is set to Allow multirate processing. This setting enables the Upsample and Downsample blocks to operate in the multirate mode and treat data as frames of size 16.
Enable Sample Time Color Coding
On the Debug tab, select Information Overlays > Colors and Text. This selection turns on sample time color coding and annotations. Run the model. Simulink assigns each frame rate a different color.
Inspect Frame Rate Using Timing Legend
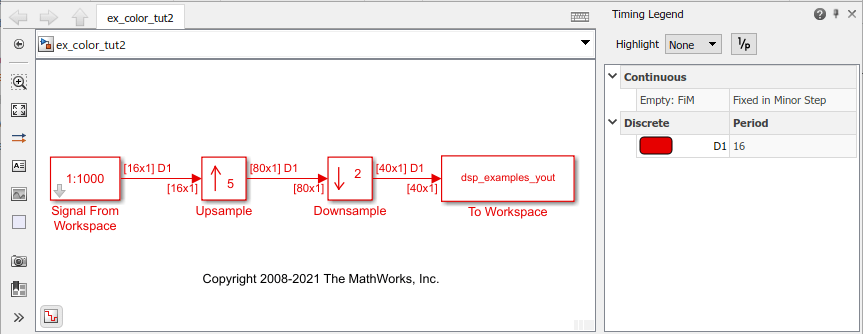
Enable the Timing Legend by selecting Information Overlays > Timing Legend. Simulink updates the model and opens the Timing Legend. You can view the value of the frame period for each signal in the model, the color associated with the frame period, and the corresponding annotation. For example, the frame period of the input signal (denoted by D3 in the Timing Legend) is given by  or
or  , which equals 16 seconds. The D1 signal is upsampled by a factor of 5. As a result, the frame period of D1 is 16/5 or 3.2 seconds. The signal D2 that follows is downsampled by 2, and the resultant frame period is 3.2 x 2 = 6.4 seconds.

Because the Rate options parameter in the Upsample and Downsample blocks is set to Allow multirate processing, each of these blocks changes the frame rate. Therefore, each frame signal in the model is assigned a different color.
You can view the frame rate of the signal by clicking the 1/p button in the timing legend.

Double-click on the Upsample block and the Downsample block, and change the Rate options parameter to Enforce single-rate processing.
Run the model. Every signal now has the same frame period and is therefore coded with the same color.
Use Model Data Editor or Probe to Inspect Signals
There are two other techniques that you can use to inspect signals in your model: Model Data Editor and Probe (Simulink) blocks.
Model Data Editor
The Model
Data Editor (Simulink) (on the Modeling tab, click
Model Data Editor) shows information about model data
(signals, parameters, and states) in a sortable, searchable table. The
Sample Time column shows the sample time specified for
each signal in a model. After you update the block diagram, the column also
shows the specific sample that each signal uses (for example, for signals where
you specify inherited sample time, the column value is -1).
You can also use this column to specify sample times.
Probe blocks
You can connect Probe blocks to the signal that you want to inspect. The Probe blocks show signal parameters such as signal width, sample time, signal complexity, and signal dimensions.