eigplot
Plot Markov chain eigenvalues
Description
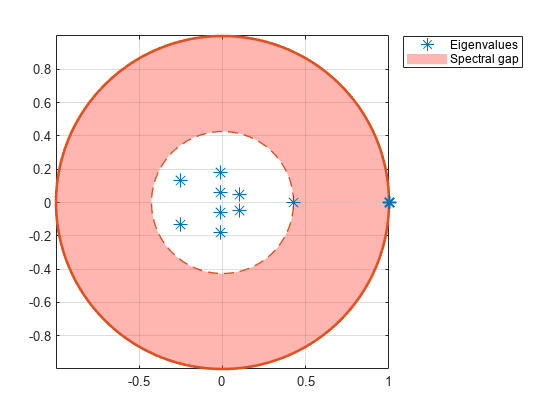
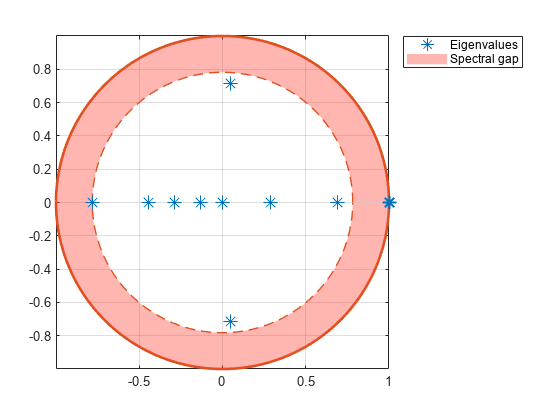
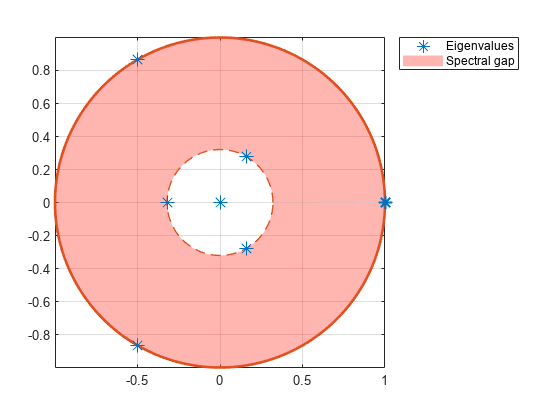
eigplot( creates a plot containing the eigenvalues of the transition matrix of the discrete-time Markov chain mc)mc on the complex plane. The plot highlights the following:
Unit circle
Perron-Frobenius eigenvalue at (1,0)
Circle of second largest eigenvalue magnitude (SLEM)
Spectral gap between the two circles, which determines the mixing time
Examples
Input Arguments
Output Arguments
References
[1] Gallager, R.G. Stochastic Processes: Theory for Applications. Cambridge, UK: Cambridge University Press, 2013.
[2] Horn, R., and C. R. Johnson. Matrix Analysis. Cambridge, UK: Cambridge University Press, 1985.
[3] Seneta, E. Non-negative Matrices and Markov Chains. New York, NY: Springer-Verlag, 1981.
Version History
Introduced in R2017b


