Main Content

globe

Frame for 3-D map display on axesm-based map

Classification

Spherical

Identifier

globe

Graticule

This map display is based on a coordinate transformation and is not a true map projection. Meridians, parallels, and displayed map data appear in a 3-D view that depends on the view and camera settings of the axesm-based map. Change the view interactively or by using the view function. Change the camera settings using the camposm, camtargm, and camupm functions.

Features

In the 3-D sense, globe is true in scale, equal-area, conformal, minimum error, and equidistant everywhere.

While globe has none of the distortions inherent in planar projections, it cannot be displayed without distortion or in its entirety. In order to render the globe in a figure window, either a perspective or orthographic transformation must be applied, both of which necessarily involve setting a viewpoint, hiding the back side and distortions of shape, scale, and angles.

Parallels

The globe requires no standard parallels.

Remarks

The globe display allows you to visualize terrain relief or other data for an entire planet viewed from space. Its underlying transformation maps latitude, longitude, and elevation to a 3-D Cartesian frame. The globe display is different from other transformations because it can render relative relief of elevations above, below, or on a sphere.

When displayed, the globe looks like an orthographic azimuthal projection, provided that the Projection property of the axesm-based map is set to 'orthographic'.

Examples

expand all

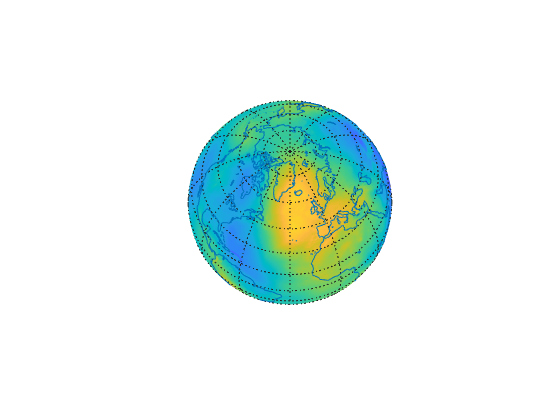
Display geoid heights from the EGM96 geoid model over a 3-D globe. First, get geoid heights and a geographic postings reference object. Load coastline latitude and longitude data.

[N,R] = egm96geoid;
load coastlines

Create a frame for the 3-D globe display using axesm. Set the line of sight for the globe using view. Turn off the axes background using axis off. Then, display the geoid heights and coastline data.

axesm('globe','Grid','on')
view(60,60)
axis off
meshm(N,R)
plotm(coastlat,coastlon)

Figure contains an axes object. The hidden axes object contains 4 objects of type surface, line.

Display a polygon on a globe by converting the polygon to a data grid.

Create a sample polygon that contains a hole and rests on the surface of the globe. To do this, generate the vertices of its external and internal boundaries using the outlinegeoquad function. Specify the geographic limits as the first two arguments, and the vertex spacing in degrees as the next two arguments. Reverse the order of the internal boundary vertices using the flip function, so they are in a counterclockwise order.

[latE,lonE] = outlinegeoquad([-35 35],[-30 30],0.25,0.25);
[latI,lonI] = outlinegeoquad([-15 15],[-15 15],0.25,0.25);
latI = flip(latI);
lonI = flip(lonI);

Combine the vertices into a single list by separating the boundaries with NaN values.

lat = [latE NaN latI];
lon = [lonE NaN lonI];

The vectors lat and lon represent the boundaries of a polygon that contain a hole. Display the boundaries on the globe as a filled polygon by converting the polygon to a data grid.

To do this, create a geographic cells reference object for the globe and a grid of ones. Replace elements of the grid with the polygon data using the vec2mtx function. The new grid contains 0s to indicate the inside region of the polygon, 1s to indicate the boundaries, and 2s to indicate the outside region of the polygon.

R = georefcells([-90 90],[-180 180],0.25,0.25);
V = ones(R.RasterSize);
[V,R] = vec2mtx(lat,lon,V,R,'filled');

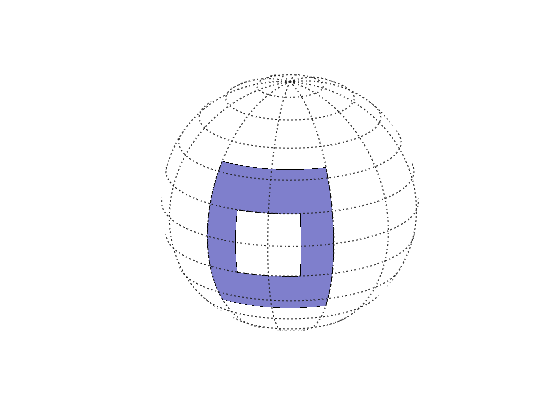
Create a globe using the axesm function. Display the data grid as an image using the geoshow function. Adjust the colormap so the inside region of the polygon is purple and the outside region is white. Change the camera line of sight using the view function, so the polygon is displayed on the near side of the globe.

axesm('globe','Grid','on')
geoshow(V,R,'DisplayType','texturemap')
colormap([0.5 0.5 0.8; 0 0 0; 1 1 1])
axis off
view(100,20)

Figure contains an axes object. The hidden axes object contains 3 objects of type surface, line.

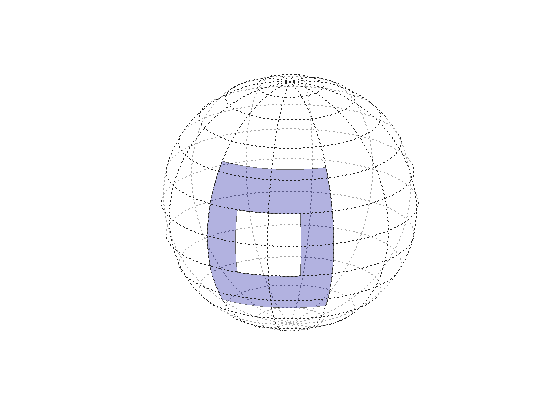
The appearance of polygons on the globe is dependent on the camera line of sight and the globe transparency. For example, make the globe slightly transparent using the alpha function.

alpha(0.6)

Figure contains an axes object. The hidden axes object contains 3 objects of type surface, line.

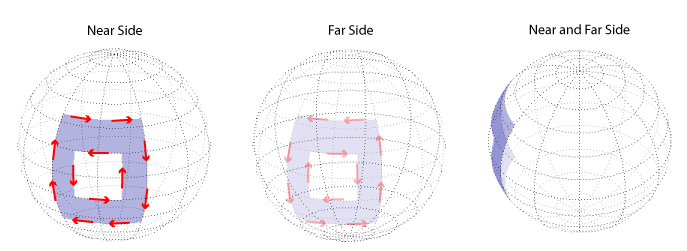
When you view the polygon from the near side of the globe, the external boundary vertices appear in a clockwise order. When you view the polygon from the far side of the globe, the external boundary vertices appear in a counterclockwise order. When you rotate the globe so the polygon appears on both the near side and far side, then the polygon appears to intersect itself.

Version History

Introduced before R2006a
Go to top of page