comet
2-D comet plot
Description
comet( displays a comet plot of the data
specified in y)y versus the index of each value. A
comet is an animation of a marker (head) and a line (tail) tracing
a growing line over the data points. The tail is a solid line that traces the entire
function.
Examples
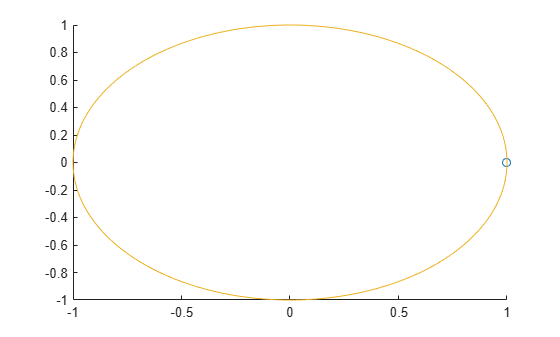
Create a comet plot of data in y versus data in x. Create y as a vector of sine function values for input values between 0 and . Create x as a vector of cosine function values for input values between 0 and . Use an increment of between the values. Then, plot the data.
t = 0:pi/100:2*pi;
y = sin(t);
x = cos(t);
comet(x,y)
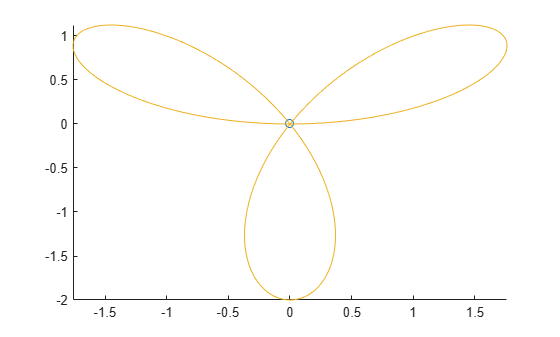
Create a comet plot and specify the comet body length by setting the scale factor input p. The comet body is a trailing segment in a different color that follows the head before fading.
Create x and y as vectors of trigonometric functions with input values from 0 to . Specify p as 0.5 so that the comet body length is 0.5*length(y). Then, plot the data.
t = 0:pi/50:4*pi;
x = -sin(t) - sin(t/2);
y = -cos(t) + cos(t/2);
p = 0.5;
comet(x,y,p)
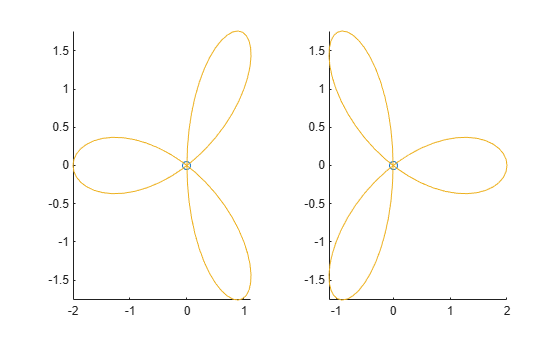
Create two comet plots in a tiled chart layout by specifying the target axes for each plot. Create two data sets, x1 and y1 and x2 and y2 as vectors of trigonometric functions with input values from 0 to . Specify the body length scale factor p as 0.25 so that the body length is 0.25*length(y).
t = 0:pi/20:4*pi;
x1 = -cos(t) + cos(t/2);
y1 = -sin(t) - sin(t/2);
x2 =  cos(t) - cos(t/2);
y2 = -sin(t) - sin(t/2);
p = 0.25;
Store the two Axes objects as ax1 and ax2. Specify the target axes for each comet plot by including the Axes object as the first input argument to comet.
tiledlayout(1,2);
ax1 = nexttile;
ax2 = nexttile;

comet(ax1,x1,y1,p)
comet(ax2,x2,y2,p)
Input Arguments
Limitations
Comet plots do not support data tips.
Extended Capabilities
Version History
Introduced before R2006a