Main Content

show

Plot pose nodes, pose node edges, and landmark nodes of factor graph

Since R2024a

    Description

    show(fg) plots the pose nodes and pose node edges of the specified factor graph in a figure. Pose nodes are nodes of type "POSE_SE2" or "POSE_SE3".

    show(fg,Name=Value) specifies options using one or more name-value arguments. For example, Landmark="off" plots the factor graph without displaying landmark nodes.

    example

    ax = show(___) returns the axes handle of the factor graph plot using any of the input arguments from previous syntaxes.

    Examples

    collapse all

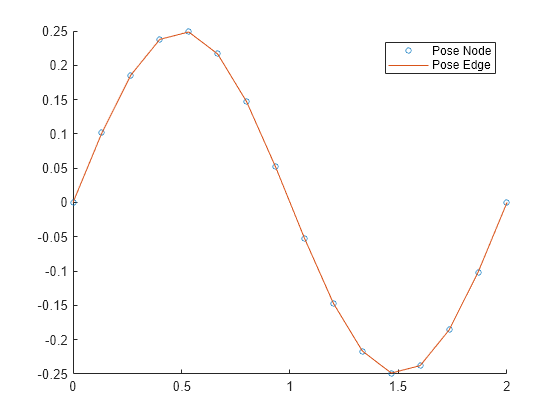
    Import a factor graph containing 2-D pose nodes.

    fg = importFactorGraph("sineFactorGraph.g2o");

    Show the factor graph.

    show(fg,Legend="on"); 

    Figure contains an axes object. The axes object contains 2 objects of type line. One or more of the lines displays its values using only markers These objects represent Pose Node, Pose Edge.

    Input Arguments

    collapse all

    Factor graph to visualize, specified as a factorGraph object.

    Name-Value Arguments

    Specify optional pairs of arguments as Name1=Value1,...,NameN=ValueN, where Name is the argument name and Value is the corresponding value. Name-value arguments must appear after other arguments, but the order of the pairs does not matter.

    Example: show(fg,Landmark="on")includes the landmark nodes in the plot of the factor graph fg.

    Axes on which to draw the factor graph, specified as an Axes object. By default, the function plots the factor graph in the active axes.

    Landmark node display, specified as "off" or "on".

    If specified as "on", the factor graph plot includes landmark nodes of these types:

    • "POINT_XY" — 2-D point

    • "POINT_XYZ" — 3-D point

    If fg contains no landmark nodes, then Landmark has no effect.

    Pose node orientation display, specified as "off" or "on".

    If specified as "on", the factor graph plot includes the orientations of the pose nodes as frames.

    Size of the orientation frames, specified as a positive numeric scalar.

    Plot the edges between nodes, specified as "pose-edge" or "off".

    If specified as "pose-edge", the factor graph plots edges, represented by these factor objects, between the pose nodes:

    Plot legend, specified as "off" or "on". By default, the legend contains a label for the pose nodes.

    If Landmark is "on", the legend contains an additional label for the landmark nodes.

    If Edge is "pose-edge", the legend contains an additional label for the edges between pose nodes.

    Output Arguments

    collapse all

    Axes used to plot the factor graph, returned as an Axes object.

    Tips

    • If you must update the figure frequently, set Legend to "off" to improve the update rate.

    Version History

    Introduced in R2024a
    See Also

    Go to top of page