plot
R2026bDescription
plot(
plots the waveform with additional options specified by one or more
(waveform,Name=Value)Name=Value) pair arguments.
plot(
specifies the same line color, line style, or marker options as are available in the
MATLAB®
waveform,Name=Value,LineSpec)plot function.
hndl = plot(___)
Examples
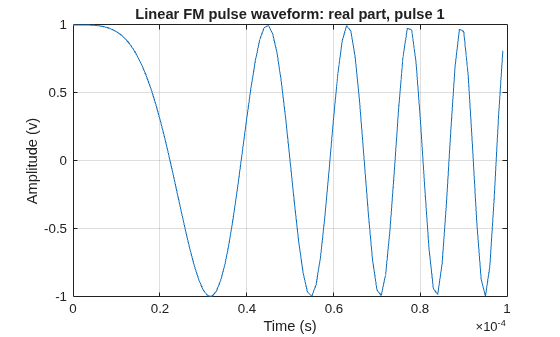
Create and plot an upsweep linear FM pulse waveform.
waveform = phased.LinearFMWaveform('SweepBandwidth',1e5,'PulseWidth',1e-4);
plot(waveform);
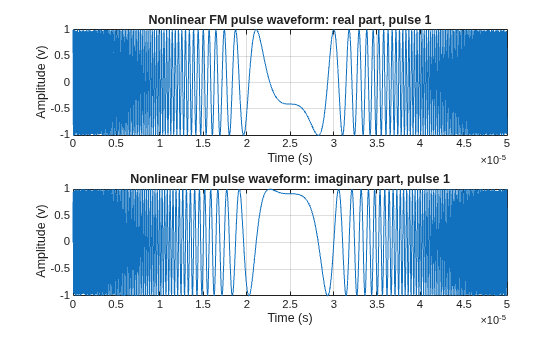
Create and plot a quadratic FM pulse waveform. The pulse has a 10 MHz bandwidth and 50 sec duration. The pulse sample rate is 10 times the bandwidth.
BW = 10e6;
T = 50e-6;
waveform = phased.NonlinearFMWaveform( ...
    'SampleRate',10*BW,'SweepBandwidth',BW, ...
    'PulseWidth',T);
plot(waveform,PlotType='complex')
Input Arguments
Name-Value Arguments
Output Arguments
Version History
Introduced in R2023a

