surfacePlotterData
Description
returns a data structure plotterData
= surfacePlotterData(manager
)plotData
that you can use as input to the
plotSurface
function for plotting surfaces managed by the SurfaceManager
object manager
.
specifies the color map for the plot data.plotData
= surfacePlotterData(___,colorMap
)
Examples
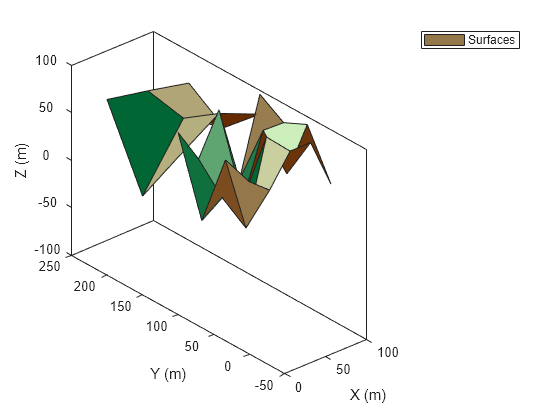
Plot Surface in Theater Plot in Radar Scenario
Create a radar scenario.
scenario = radarScenario;
Define the terrain and boundaries of two surfaces and add the two surfaces to the radar scenario.
terrain1 = randi(100,4,5); terrain2 = randi(100,3,3); boundary1 = [0 100; 0 100-eps]; boundary2 = [0 100; 100 200]; s1 = landSurface(scenario,Terrain=terrain1,Boundary=boundary1); s2 = landSurface(scenario,Terrain=terrain2,Boundary=boundary2);
Obtain the plotter data by using the surfacePlotterData
function.
plotterData = surfacePlotterData(scenario.SurfaceManager)
plotterData=1×2 struct array with fields:
X
Y
Z
C
Create a theaterPlot
object and specify the axis limits of the plot.
theaterpplot = theaterPlot(XLimits=[0 100],YLimits=[-50 250],ZLimits=[-100 100]);
Create a surface plotter.
plotter = surfacePlotter(theaterpplot,DisplayName="Surfaces");
Plot surfaces in the theater plot. Change view angles for better visualization.
plotSurface(plotter,plotterData) view(-41,29)
Input Arguments
manager
— Surface manager
surface manager object
Surface manager, specified as a surface manager object.
colorMap
— Color Map
three-column matrix of RGB triplets
Color map used for plotting surfaces, specified as a three-column matrix of RGB
triplets. An RGB triplet is a three-element row vector whose elements specify the
intensities of the red, green, and blue components of the color. The intensities can be
double or single values in the range [0, 1], or they can be uint8
values in the range [0, 255]. For example, this matrix defines a colormap containing
five colors:
map = [0.2 0.1 0.5 0.1 0.5 0.8 0.2 0.7 0.6 0.8 0.7 0.3 0.9 1 0];
Color | double or single RGB
Triplet | uint8 RGB Triplet |
---|---|---|
yellow | [1 1 0] | [255 255 0] |
magenta | [1 0 1] | [255 0 255] |
cyan | [0 1 1] | [0 255 255] |
red | [1 0 0] | [255 0 0] |
green | [0 1 0] | [0 255 0] |
blue | [0 0 1] | [0 0 255] |
white | [1 1 1] | [255 255 255] |
black | [0 0 0] | [0 0 0] |
Output Arguments
plotterData
— Plotter data
P-element array of structures
Plotter data, returned as a P-element array of structures, where
P is the number of surfaces saved in the
Surfaces
property of the SurfaceManager
object
manager
. Each structure has these fields:
Field Name | Description |
---|---|
X | Domain of the surface in the x-direction, returned as an M-element real-valued vector. M is the number of x-coordinates for defining the terrain of the surface. |
Y | Domain of the surface in the y-direction, returned as an N-element real-valued vector. N is the number of y-coordinates for defining the terrain of the surface. |
Z | Height values of the surface, returned as an
N-by-M real-valued matrix.
N is the number of elements in the Y
field, and M is the number of elements in the
X field. |
C | Color for vertices in the terrain of the surface, returned as an
N-by-M-by-3 matrix of RGB triplets.
N is the number of elements in the Y
field, and M is the number of elements in the
X field. The plotSurface
function determines the color of a surface patch based on the color of its
first vertex. |
Version History
Introduced in R2022b
See Also
plotSurface
| theaterPlot
| surfacePlotter
| SurfacePlotter
| SurfaceManager
MATLAB Command
You clicked a link that corresponds to this MATLAB command:
Run the command by entering it in the MATLAB Command Window. Web browsers do not support MATLAB commands.
Select a Web Site
Choose a web site to get translated content where available and see local events and offers. Based on your location, we recommend that you select: .
You can also select a web site from the following list:
How to Get Best Site Performance
Select the China site (in Chinese or English) for best site performance. Other MathWorks country sites are not optimized for visits from your location.
Americas
- América Latina (Español)
- Canada (English)
- United States (English)
Europe
- Belgium (English)
- Denmark (English)
- Deutschland (Deutsch)
- España (Español)
- Finland (English)
- France (Français)
- Ireland (English)
- Italia (Italiano)
- Luxembourg (English)
- Netherlands (English)
- Norway (English)
- Österreich (Deutsch)
- Portugal (English)
- Sweden (English)
- Switzerland
- United Kingdom (English)