barrierPenalty
Logarithmic barrier penalty value for a point with respect to a bounded region
Since R2021b
Description
p = barrierPenalty(x,xmin,xmax)p for
the point x with respect to the region bounded by
xmin and xmax. p has the
same dimension as x. This syntax uses the default values of
1 and 0.1 for the maxValue and
curvature parameters of the barrier function, respectively.
Examples
This example shows how to use the logarithmic barrierPenalty function to calculate the barrier penalty for a given point, with respect to a bounded region.
Calculate the penalty value for the point 0.1 within the interval [-2,2] using default values for the maximum value and curvature parameters.
barrierPenalty(0.1,-2,2)
ans =
2.5031e-04
Calculate the penalty value for the point 4 outside the interval [-2,2].
barrierPenalty(4,-2,2)
ans =
1
Calculate the penalty value for the point 4 outside the interval [-2,2], using a maximum value parameter of 5.
barrierPenalty(4,-2,2,5)
ans =
5
Calculate the penalty value for the point 0.1 inside the interval [-2,2], using a curvature parameter of 0.5.
barrierPenalty(0.1,-2,2,5,0.5)
ans =
0.0013
Calculate the penalty value for the point [-2,0,4] with respect to the box defined by [0,1], [-1,1], and [-2,2] along the x, y, and z dimensions, respectively, using the default value for maximum value and a curvature parameter of 0.
barrierPenalty([-2 0 4],[0 -1 -2],[1 1 2],1,0)
ans = 3×1

     1
     0
     1
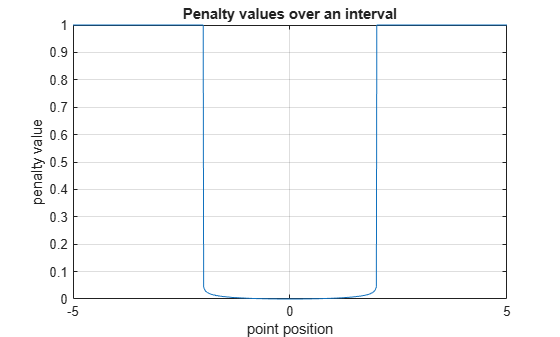
Visualize Penalty Values for an Interval
Create a vector of 1001 equidistant points distributed between -5 and 5.
x = -5:0.01:5;
Calculate penalties for all the points in the vector, using the default value for the maximum value parameter and a value of 0.01 for the curvature parameter.
p = barrierPenalty(x,-2,2,1,0.01);
Plot the points and add grid, labels and title.
plot(x,p)
grid
xlabel("point position");
ylabel("penalty value");
title("Penalty values over an interval");
Input Arguments
Output Arguments
Extended Capabilities
Version History
Introduced in R2021b