smith
Plot circuit object parameters on Smith Chart
Syntax
Description
RF Network Object
returns the line series property object lineseries
= smith(hnet
,i,j)lineseries
. The
lineseries
object can be used to set the properties of the data in
the Smith plot.
RFCKT or RF Data Objects
smith(
plots the circuit parameter h
,circuitPara
)circuitPara
from the RFCKT or RF data
object h
on a Smith Chart. You can specify multiple circuit parameters in this syntax.
smith(
plots the circuit parameters h
,circuitPara
,xAxisPara
,xAxisFmt
)circuitPara
on a Smith Chart along with the variables xAxisPara
and their
corresponding format xAxisFmt
.
Derive xAxisPara
and xAxisFmt
for the RFCKT
or RF data object h
using the listparam(h)
and
listformat(h,'xAxisPara')
commands, respectively.
smith(___,
plots the
data of a RFCKT or RF data object with name-value arguments. Specify name-value argument
after any of the input argument combinations in the previous syntaxes.Name,Value
)
smith(___,
plots the
data of the RFCKT or RF data object on a Smith Chart with the specified grid type. gridType
)
[
returns the line series property object lineseries
,hsm
] = smith(___)lineseries
and Smith Chart property object hsm
.
Examples
Plot S-Parameters on Smith Plot
Create an S-Parameters object from the specified file.
S = sparameters('default.s2p');
Plot the input reflection coefficient S11 on a Smith chart.
smith(S,1,1)
Change Color of Data Line of RF Filter in Smith Chart
Create an S-parameters object from the specified Touchstone® file of an RF Filter.
S = sparameters('RFBudget_RF.s2p');
Plot the input reflection coefficient S11 on a Smith chart.
lineseries = smith(S,1,1)
lineseries = Line (S_{11}) with properties: Color: [0 0.4470 0.7410] LineStyle: '-' LineWidth: 0.5000 Marker: 'none' MarkerSize: 6 MarkerFaceColor: 'none' XData: [0.9369 0.9364 0.9360 0.9355 0.9351 0.9346 0.9341 0.9337 0.9332 0.9327 0.9322 0.9317 0.9313 0.9308 0.9302 0.9297 0.9292 0.9287 0.9282 0.9276 0.9271 0.9266 0.9260 0.9254 0.9249 0.9243 0.9237 0.9232 0.9226 0.9220 ... ] (1x600 double) YData: [-0.3435 -0.3447 -0.3458 -0.3470 -0.3482 -0.3494 -0.3506 -0.3518 -0.3530 -0.3542 -0.3554 -0.3566 -0.3579 -0.3591 -0.3604 -0.3617 -0.3629 -0.3642 -0.3655 -0.3668 -0.3681 -0.3694 -0.3708 -0.3721 -0.3735 -0.3748 ... ] (1x600 double) Use GET to show all properties
Change the color of the S11 data line in the Smith chart.
lineseries.Color = [0.7 0.3 0.35]
lineseries = Line (S_{11}) with properties: Color: [0.7000 0.3000 0.3500] LineStyle: '-' LineWidth: 0.5000 Marker: 'none' MarkerSize: 6 MarkerFaceColor: 'none' XData: [0.9369 0.9364 0.9360 0.9355 0.9351 0.9346 0.9341 0.9337 0.9332 0.9327 0.9322 0.9317 0.9313 0.9308 0.9302 0.9297 0.9292 0.9287 0.9282 0.9276 0.9271 0.9266 0.9260 0.9254 0.9249 0.9243 0.9237 0.9232 0.9226 0.9220 ... ] (1x600 double) YData: [-0.3435 -0.3447 -0.3458 -0.3470 -0.3482 -0.3494 -0.3506 -0.3518 -0.3530 -0.3542 -0.3554 -0.3566 -0.3579 -0.3591 -0.3604 -0.3617 -0.3629 -0.3642 -0.3655 -0.3668 -0.3681 -0.3694 -0.3708 -0.3721 -0.3735 -0.3748 ... ] (1x600 double) Use GET to show all properties
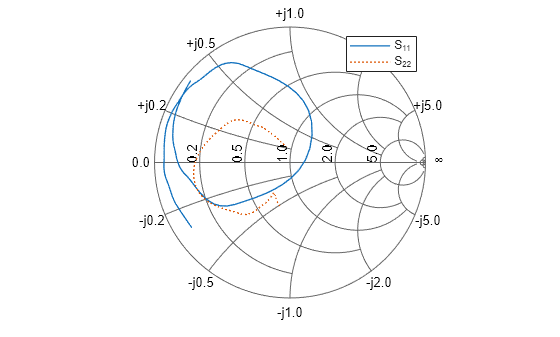
Plot Input and Output Reflection Coefficient in Smith Chart
Import network parameters, noise data, and power data from the default.amp
file into the amplifier object h
.
h = read(rfckt.amplifier,'default.amp');
Set the interpolation method of the amplifier object, h
, to cubic
.
h.IntpType = 'cubic';
Plot the S11 and S22 parameters of the amplifier object h
on a Z Smith chart.
lineseries = smith(h,'S11','S22'); lineseries(1).LineStyle = '-'; lineseries(1).LineWidth = 1; lineseries(2).LineStyle = ':'; lineseries(2).LineWidth = 1;
Plot Output Power of Amplifier
Create an amplifier object from the specified P2D file.
ckt1 = read(rfckt.amplifier, 'default.p2d');
Plot the input reflection coefficient and output power of the amplifier.
smith(ckt1,'S11','Pout','Freq','GHz');
Plot the output power of the amplifier when the input power is at 18
dBm.
smith(ckt1,'S11','Pout','Freq','GHz','bias',1.5,'Pin',18);
Plot Amplifier Data on Smith Chart
Create an amplifier object from the specified Touchstone® file.
amp = read(rfckt.amplifier,'default.s2p');
Set the circuit parameters as S11
and grid type as y
and plot the amplifier data on the Smith chart.
[lineseries,hsm] = smith(amp,'S11','y');
Change the color of the Smith chart.
set(hsm,'Color',[0.7 0.3 0.35]);
Input Arguments
hnet
— RF network parameter object
abcdparameters
| sparameters
| yparameters
| zparameters
| gparameters
| hparameters
| tparameters
RF network parameter object, specified as a one of these objects:
Note
Use the smithplot
function to plot network parameters that are not part of an RFCKT or RF data object
but are specified as vector data.
i,j
— (i, j)th parameter of network object
positive integers
(i, j)th parameter
of the network object, hnet
, specified as positive integers.
When
hnet
is a hybrid or hybrid-g parameter object, specify i and j in the range[1,2]
.When
hnet
is an ABCD, S, Y, or Z-parameters object, specify i and j such that they are less than or equal to number of ports inhnet
.
Example: smith(hnet,2,1)
h
— RFCKT or RF data object
rfckt
or rfdata
object
RFCKT or RF data object, specified as a rfckt
or
rfdata
object.
For complete list of RFCKT and RF data objects, see RF Circuit Objects and RF Data Objects.
circuitPara
— Valid RFCKT or RF data object parameter
character vector | string scalar
Valid RFCKT or data object parameter, specified as a character vector or string scalar.
Use listparam(h)
for a list of valid parameters for the circuit
or data object h
. You can also use
listformat(h,parameter)
to see the valid formats for a specific
parameter.
xAxisPara
— Independent variables to plot with circuit parameters
Pin
(default) | Freq
| AM
| character vector | string scalar
Independent variables to plot with the circuit parameters,
circuitPara
, specified as a character vector or string scalar.
This table shows the commonly used circuitPara
and their
corresponding xAxisPara
values. The function uses the default values
listed in the table if you do not specify xAxisPara
.
circuitPara Value | xAxisPara Value |
---|---|
Pout , Phase , LS11 ,
LS12 , LS21 ,
LS22 | Pin (default), Freq |
S11 , S12 , S21 ,
S22 , NF , IIP3 ,
OIP3 , GroupDelay ,
VSWRIn , VSWROut ,
GammaIn , GammaOut ,
FMIN , GammaOPT , RN ,
TF1 , TF2 , Gt ,
Ga , Gp , Gmag ,
Gmsg , GammaMS ,
GammaML , K , Delta ,
Mu , MuPrime | Freq |
AM/AM , AM/PM | AM |
xAxisFmt
— xAxisPara
format
dBm
(default) | character vector | string scalar
xAxisPara
format, specified as a character vector or string scalar.
You do not need to specify xAxisFmt
when xAxisPara
is an operating condition.
This table shows the commonly used xAxisPara
and their
corresponding xAxisFmt
. The function uses the default values listed
in the table if you do not specify xAxisFmt
.
xAxisPara Value | xAxisFmt Value |
---|---|
Pin | dBm (default), mW ,
W , dBW |
Freq |
By default, |
AM | Magnitude (decibels) (default), Magnitude
(linear) |
Example: smith(h,'Pout','Pin','mW')
plots data on a Smith Chart for circuit object, h
, with
xAxisPara
set to 'Pin'
and
xAxisFmt
set to 'mW'
.
opCon
— Operating conditions
string scalar | character vector
Operating conditions derived from a P2D or S2D file, specified as a string scalar or a character vector.
For some circuit parameters, you can specify a set of frequency or input power values at which the function plots the specified parameter.
For example:
When plotting large-signal S-parameters as a function of input power, you can specify frequency points of interest using
opCon
andopVal
arguments.When plotting large-signal S-parameters as a function of frequency, you can specify input power levels of interest using
opCon
andopVal
arguments.When plotting parameters as a function of an operating condition, you can specify both frequency and input power values using
opCon
andopVal
arguments.
Enter the getop(h)
command at the command line to get the
operating conditions for the RF circuit object h
.
opVal
— Value of operating conditions
scalar
Value of the operating conditions specified using the opCon
argument, specified as a scalar.
Example: smith(h,'Pout','Pin','mW','bias',1.5)
plots the data on a
Smith Chart for circuit object, h
, with opCon
set to 'bias'
and value
set to
1.5
.
gridType
— Smith chart grid type
'z'
(default) | 'y'
| 'zy'
| character vector | string scalar
Smith Chart grid type, specified as a character vector or string scalar.
Example: smith(h,'Pout','Pin','mW','bias',1.5,'Freq',2.4,'y')
plots the data on a Smith Chart for circuit object, h
, with the Smith Chart grid type set to the admittance grid.
Name-Value Arguments
Specify optional pairs of arguments as
Name1=Value1,...,NameN=ValueN
, where Name
is
the argument name and Value
is the corresponding value.
Name-value arguments must appear after other arguments, but the order of the
pairs does not matter.
Before R2021a, use commas to separate each name and value, and enclose
Name
in quotes.
Example: smith(h,'Pout','Pin','mW','bias',1.5,'Freq',2.4)
Freq
— Frequency value
positive scalar
Frequency value used to plot the Smith Chart, specified as the comma-separated pair consisting of
'Freq'
and a positive scalar in Hz.
Pin
— Input power level
scalar
Input power level used to plot the Smith Chart, specified as the comma-separated pair consisting of
'Pin'
and a scalar in dBm.
fin
— Input frequency value to plot spur power
positive scalar
Input frequency value used to plot the spur power in the Smith Chart, specified as the comma-separated pair consisting of
'fin'
and a positive scalar in Hz.
When the input object to the function is an
rfckt.mixer
object, the default value offin
is the input frequency at which the magnitude in decibels of the S21 parameter of the mixer is the highest.When the input object to the function is an
rfckt.cascde
object, the default value offin
is the input frequency at which the magnitude of the S21 parameter of the first mixer in the cascade is highest.
Output Arguments
lineseries
— Line series property object
column vector
Line series property object, returned as a column vector.
hsm
— Smith Chart properties
rfchart.smith
object
Smith Chart properties, returned as an rfchart.smith
object.
More About
Change Properties of Smith Chart
The smith
function returns the Smith Chart properties object, hsm
.
The smith
function plots the Smith Chart using the default property values. Use
set(hsm,'PropertyName',PropertyValue)
to change the property values of
the chart and use get(hsm)
to get the property values.
This table lists all the properties you can specify for a Smith Chart object along with their descriptions and associated values. Use the table below to change the properties of the chart.
Name | Description | Units, Values |
---|---|---|
| Line color for a Z or Y Smith Chart and the color of the Z line for a ZY Smith Chart | Default value is |
| Color of the line labels | Default value is |
| Size of the line labels |
|
| Visibility of the line labels |
|
| Line spec for a Z or Y Smith Chart. For a ZY Smith Chart, the Z line spec | Default value is |
| Line width for a Z or Y Smith Chart. For a ZY Smith Chart, width of the Z line | Number of points. Default value is |
| The Y line color for a ZY Smith Chart | Default value is |
| The Y line spec for a ZY Smith Chart | Default value is |
| The Y line width for a ZY Smith Chart | Number of points. Default value is |
| Type of Smith Chart |
|
| Two-row matrix. First row specifies the values of the constant resistance and reactance lines that appear on the chart. For constant resistance or reactance lines, each element in second row specifies the value of the constant reactance or resistance line at which the corresponding line specified in first row ends | 2-by-n matrix. Default is [ |
Change Properties of Plotted Lines
The smith
function returns a
lineseries
object as a column vector of handles to
lineseries
objects, one object per plotted line. For more information,
see Line Properties.
Line Specification
Use the table provided to set Line style of the Smith Chart.
Line Style | Description | Resulting Line |
---|---|---|
'-' | Solid line |
|
'--' | Dashed line |
|
':' | Dotted line |
|
'-.' | Dash-dotted line |
|
Color Specification
Use the table provided to set color of the Smith Chart.
Color Name | Short Name | RGB Triplet | Hexadecimal Color Code | Appearance |
---|---|---|---|---|
'red' | 'r' | [1 0 0] | '#FF0000' |
|
'green' | 'g' | [0 1 0] | '#00FF00' |
|
'blue' | 'b' | [0 0 1] | '#0000FF' |
|
'cyan'
| 'c' | [0 1 1] | '#00FFFF' |
|
'magenta' | 'm' | [1 0 1] | '#FF00FF' |
|
'yellow' | 'y' | [1 1 0] | '#FFFF00' |
|
'black' | 'k' | [0 0 0] | '#000000' |
|
'white' | 'w' | [1 1 1] | '#FFFFFF' |
|
Here are the RGB triplets and hexadecimal color codes for the default colors MATLAB® uses in many types of plots.
RGB Triplet | Hexadecimal Color Code | Appearance |
---|---|---|
[0 0.4470 0.7410] | '#0072BD' |
|
[0.8500 0.3250 0.0980] | '#D95319' |
|
[0.9290 0.6940 0.1250] | '#EDB120' |
|
[0.4940 0.1840 0.5560] | '#7E2F8E' |
|
[0.4660 0.6740 0.1880] | '#77AC30' |
|
[0.3010 0.7450 0.9330] | '#4DBEEE' |
|
[0.6350 0.0780 0.1840] | '#A2142F' |
|
Tips
Type
listparam(h)
to get a list of valid parameters for the circuit objecth
.Note
For all circuit objects, except those that contain data from a data file, you must use the
analyze
function to perform a frequency domain analysis before callingsmith
.
Version History
Introduced before R2006a
MATLAB Command
You clicked a link that corresponds to this MATLAB command:
Run the command by entering it in the MATLAB Command Window. Web browsers do not support MATLAB commands.
Select a Web Site
Choose a web site to get translated content where available and see local events and offers. Based on your location, we recommend that you select: .
You can also select a web site from the following list:
How to Get Best Site Performance
Select the China site (in Chinese or English) for best site performance. Other MathWorks country sites are not optimized for visits from your location.
Americas
- América Latina (Español)
- Canada (English)
- United States (English)
Europe
- Belgium (English)
- Denmark (English)
- Deutschland (Deutsch)
- España (Español)
- Finland (English)
- France (Français)
- Ireland (English)
- Italia (Italiano)
- Luxembourg (English)
- Netherlands (English)
- Norway (English)
- Österreich (Deutsch)
- Portugal (English)
- Sweden (English)
- Switzerland
- United Kingdom (English)