smithplot
Plot measurement data on Smith chart
Syntax
Description
smithplot( creates a Smith chart
based on the input data specified in data)data.
Note
A Smith chart is commonly used to display the relationship between a reflection coefficient, typically S11 or S22, and a normalized impedance.
The
smithplotfunction replaces thesmithchartfunction. (since R2023b)
smithplot(ax,___) creates a Smith chart with a
user defined axes handle, ax, instead of the current axes handle.
Axes handles are not supported for network parameter objects. This parameter can be
used with either of the two previous syntaxes.
smithplot( plots the
(i,j)th parameter of
hnet,i,j)hnet. hnet can be a network parameter, an
rfckt, an rfdata,or an nport object.
smithplot(
plots multiple parameters (i1,
j1,
i2,
j2, …,
in,
jn) of hnet,[i1,j1;i2,j2;....,in,jn])hnet.
hnet can be a network parameter, an rfckt, an rfdata, or an
nport object.
smithplot( plots the
reflection coefficient of an rfbudgetobj,i,i)rfbudget object.
Note
For rfbudget objects, smith plot is restricted to
reflection coefficients.
s = smithplot(___)
s = smithplot('gco')p was not returned or retained.
smithplot(___,Name,Value) creates a Smith chart
with additional properties specified by one or more name-value pair arguments.
Name is the property name and Value is the
corresponding property value. You can specify several name-value pair arguments in
any order as Name1, Value1,
..., NameN, ValueN.
Properties not specified retain their default values.
For list of properties, see SmithPlot Properties.
Note
The property 'Parent' might be used to control the
location where Smith chart gets plotted. Target can be figure, UI figure, UI
panel, etc.
Examples
Use the Smith plot interactive menu to change grid type of the Smith plot.
Plot the Smith plot of S-parameters data file, default.s2p.
data = nport("default.s2p");
smithplot(data)
Right click on the S11 line to reveal interactive menu, DISPLAY. Use Grid to change the grid to YZ on the Smith plot.

YZ- grid Smith plot is displayed below.

Plot the Smith plot of S11 of s-parameter data file using an impedance of 75 ohms.
data = sparameters('passive.s2p' );
s = sparameters(data,75);
p = smithplot(s,1,1, 'GridType','ZY');

Use the data cursor icon in the toolbar to insert a cursor on your smith plot chart. You now know the S11, VSWR, Impedance, and frequency values at that cursor. For admittance value, change the Grid Type.

Plot the Smith chart of an rfckt.amplifier object.
S = read(rfckt.amplifier,'passive.s2p');
ports = [1,1;1,2];
s = smithplot(S,ports);
s.LineStyle = {'--', '-'};

This example shows how to plot impedance data on a smithplot.
Define impedance data.
z1 = 0.1*50 + 1j*(0:2:50);
z2 = (0:2:50) - 0.6*50j;
Characteristic Impedance:
z0 = 50;
Convert impedance data to reflection coefficient.
gamma1 = z2gamma(z1,z0);
gamma2 = z2gamma(z2,z0);
Plot the impedance data on the smithplot.
s = smithplot(gamma1,'Color',[0.2 0 1],'GridType',"Z");
hold on;
s = smithplot(gamma2,'Color','g','LineStyle','-.','LineWidth',1);
s.Marker = {'+','s'}

s =
  smithplot with properties:

         Data: {[26×1 double]  [26×1 double]}
    Frequency: {[]  []}

   Show all properties, methods
Read the S-parameter data.
amp = read(rfckt.amplifier,'default.s2p');
Sa = sparameters(amp);
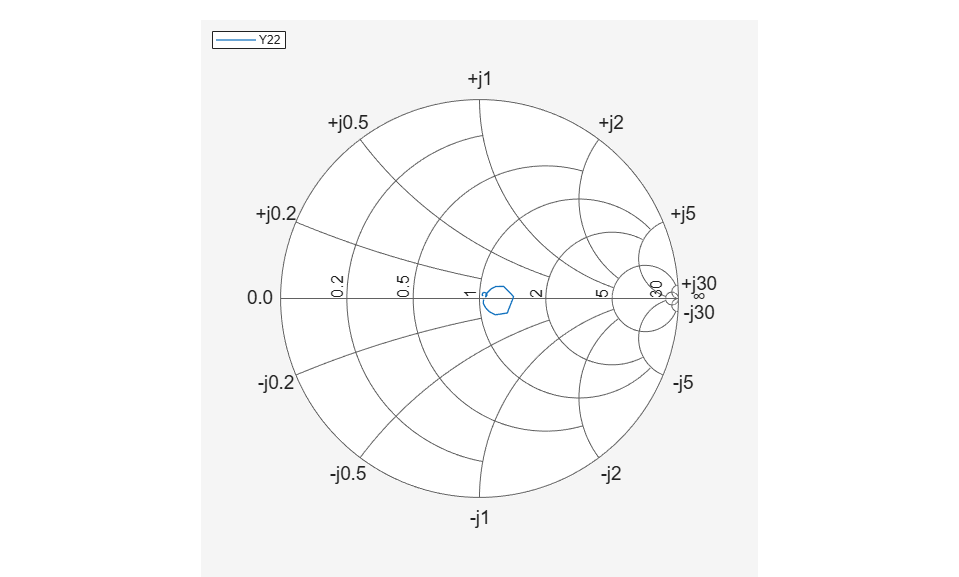
Convert the S-parameter data to Y-parameter and plot it on a Smith plot.
Ya = yparameters(Sa);
smithplot(Ya,2,2)
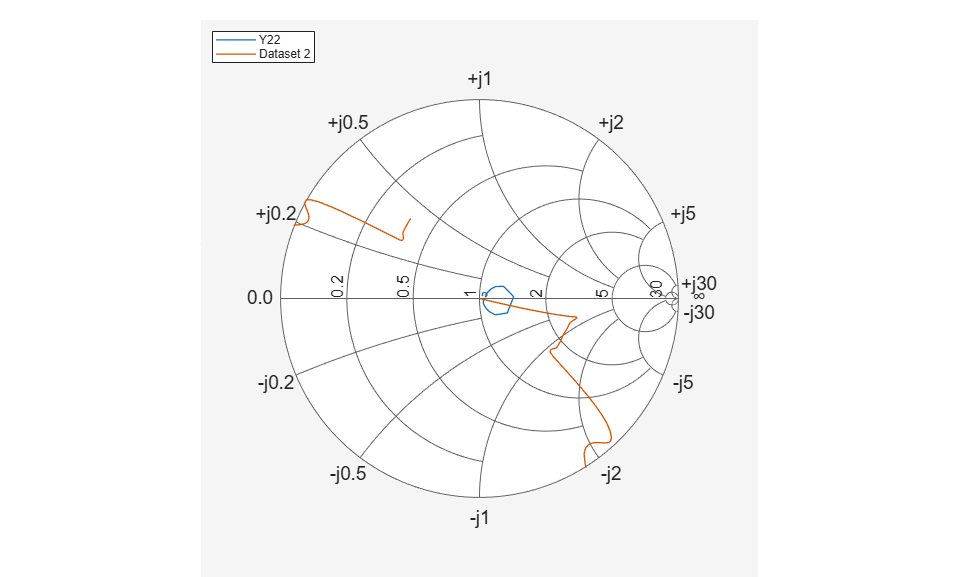
Add Z-parameter data to the same plot.
Za = zparameters(Sa);
Z12 = rfparam(Za,1,2);
Freq = Za.Frequencies;
s = smithplot('gco');
add(s, Freq, Z12);
Input Arguments
Output Arguments
Tips
To list all the property
Name,Valuepairs insmithplot, usedetails(s). You can use the properties to extract any data from the Smith chart. For example,s = smithplot(data,'GridType','Z')displays the impedance data grid from the Smith chart.For a list of properties of
smithplot, see SmithPlot Properties.You can use the
smithplotinteractive menu to change the line and marker styles.