setMapData
Description
Add-On Required: This feature requires the Robotics System Toolbox Offroad Autonomy Library add-on.
setMapData(
assigns values to the specified map layer, map,layername,layerinputs)layername, at locations
defined by layerinputs. The layerinputs argument
specifies individual cells or blocks of data in world, local, or grid coordinates
depending on the underlying map layer.
inBounds = setMapData(map,layername,layerinputs)layerinputs
input argument.
Examples
This example shows how to augment a geometric traversability map with semantic cost information derived from satellite imagery. You first compute a traversability map from a digital elevation model (DEM). You then fuse semantic segmentation data to penalize or promote specific terrain classes, resulting in a more realistic and task-aware traversability estimate.
Load the digital elevation model (DEM) of Manassas National Battlefield Park, Virginia, to visualize its height profile to understand the underlying geometry. The Zreal stores the elevation data and res specifies the grid resolution.
% Add helper folders to path
addpath("Data");

load("manassasData.mat", "Xreal", "Yreal" , "Zreal", "res");
Visualize the digital elevation model (DEM) to inspect terrain features such as roads, elevation changes, and man-made structures.
figure
surf(Xreal, Yreal, Zreal, EdgeColor="none")
title("Digital Elevation Model")
xlabel('X [m]');
ylabel('Y [m]')
ylabel("Z [m]")
xlim([Xreal(1,1), Xreal(1,end)])
ylim([Yreal(1,1), Yreal(end,1)])
colorbar
view(2)
![Figure contains an axes object. The axes object with title Digital Elevation Model, xlabel X [m], ylabel Z [m] contains an object of type surface.](../../examples/offroad_autonomy/win64/EstimateTerrainTraversabilityWithSemanticCostInformationExample_01.png)
Create geometric traversability map for the terrain from the digital elevation model (DEM) by specifying the SlopeThreshold property and disabling the RoughnessThreshold and StepHeightThreshold properties. This configuration highlights large-scale geometric features of the terrain.
map = traversabilityMap(flipud(Zreal), res);
map.SlopeThreshold = [10, 15]*pi/180; % safe and critical slope thresholds in radians
map.RoughnessThreshold = inf;
map.StepHeightThreshold = inf;
Visualize resulting geometric traversability map.
figure
show(map)
title("Traversability Map (geometric)")![Figure contains an axes object. The axes object with title Traversability Map (geometric), xlabel X [meters], ylabel Y [meters] contains an object of type image.](../../examples/offroad_autonomy/win64/EstimateTerrainTraversabilityWithSemanticCostInformationExample_02.png)
The geometric traversability map captures features such as roads, open regions, and building boundaries based solely on terrain shape. However, geometry alone cannot distinguish between visually similar but semantically different regions, such as grass versus paved roads.
Now, load the satellite image corresponding to the same location and dimensions. This image provides visual cues for identifying terrain classes such as roads, vegetation, and buildings.
img = imread("visitorcenter_satellitesq.jpg");

figure;
image(img)
title("Satellite Image")
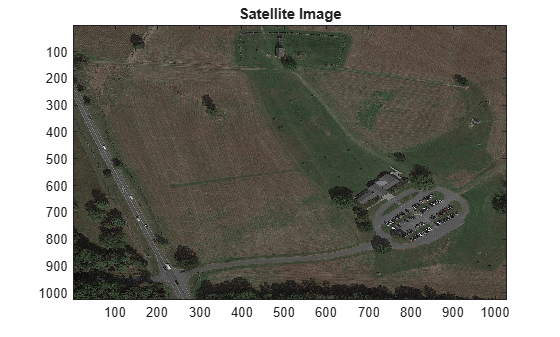
Load semantic segmentation masks generated for the satellite image. Each mask represents a specific semantic class, such as roads, trees, grass, or buildings. These masks were generated using the Get Started with the Image Labeler (Computer Vision Toolbox) app or can be produced using automated segmentation models.
load("visitorcenter_satellitesq_segmented.mat", "masks")
masks
masks =

  dictionary (string ⟼ cell) with 5 entries:

    "low_grass" ⟼ {1027×1027 double}
    "trees"     ⟼ {1027×1027 double}
    "building"  ⟼ {1027×1027 double}
    "road"      ⟼ {1027×1027 double}
    "soil"      ⟼ {1027×1027 double}
Assign semantic cost to each terrain class. Lower costs indicate preferred traversal regions, while higher costs represent obstacles or restricted areas.
For semantic classes such as roads, assign a cost of 0. For obstacles like trees, assign a cost of 1. And for classes such as grass or soil, assign a cost between 0 and 1.
Compute combined semantic cost map by weighting each semantic mask with its corresponding cost.
costRoad = 0;
costLowGrass = 0.3;
costSoil = 0.7;
costBuildings = 1;
costTrees = 1;

semanticCost = costRoad * cell2mat(masks("road"))  + costLowGrass  * cell2mat(masks("low_grass")) + costSoil * cell2mat(masks("soil")) + ...
               costTrees* cell2mat(masks("trees")) + costBuildings * cell2mat(masks("building"));
Resize semantic cost map to match the resolution of the elevation data.
semanticCost = resize(semanticCost, size(Zreal));
Integrate semantic cost map with the geometric traversability map. This step adjusts traversability scores based on semantic context.
setMapData(map, "Semantic", semanticCost)Integrate the semantic cost map with the geometric traversability map. This step adjusts traversability scores based on semantic context.
show(map)
title('Traversability map (geometric + semantic)')![Figure contains an axes object. The axes object with title Traversability map (geometric + semantic), xlabel X [meters], ylabel Y [meters] contains an object of type image.](../../examples/offroad_autonomy/win64/EstimateTerrainTraversabilityWithSemanticCostInformationExample_04.png)
Input Arguments
Output Arguments
Extended Capabilities
Version History
Introduced in R2026a